Multidimensional Poverty Analysis National Multidimensional Poverty Index NMPI
 In Collaboration with OPHI and DCS")


, Indicators(13), and Weights of National MPI Dimension (Weight) Indicator (Weight) Year of")
")


 Variation across districts Consumption poverty Headcount vs. Multidimensional poverty Headcount 70.")
 by age")


- Slides: 18
Multidimensional Poverty Analysis National Multidimensional Poverty Index (NMPI) In Collaboration with OPHI and DCS Presented by P. M. P. Anura Kumara Additional Director General Department of Census & Statistics Sri Lanka 1
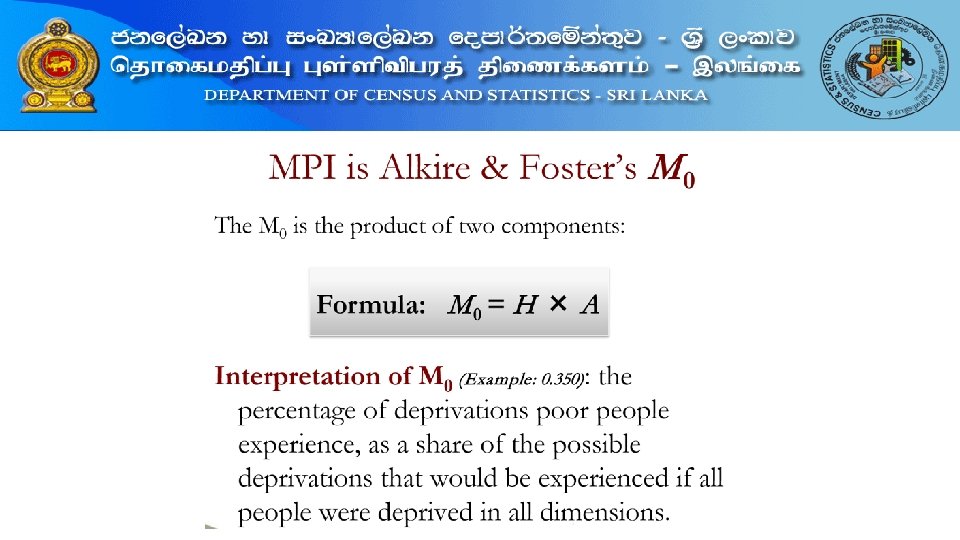
Alkire and Foster Method An MPI reflects the multiple deprivations each person faces at the same time. The MPI dashboard’s key statistics include: • Incidence of poverty: The percentage of multi dimensionally poor people. • Intensity of poverty: The average proportion of deprivations poor people face at once. • Composition of poverty: The percentage of people who are poor and deprived in each indicator.
Education Health Women empowerment Sanitation Housing Safe drinking water Assets Indoor pollution Access to media Bank account Not Employed Nutrition of child Nutrition of adult Tobacco consumption School items Year of Schooling Dimensions and Indicators of National Multidimensional Index Sri Lanka 13 Indicators Standard of living 4 Dimensions 4
Dimensions (4), Indicators(13), and Weights of National MPI Dimension (Weight) Indicator (Weight) Year of Schooling (1/8) Education (1/4) School items (1/8) Health ((1/4) Smoking Tobacco consumption (1/12) Nutrition of adult (1/12) Nutrition of child (1/12) Standard of living Housing (1/20) (1/4) Sanitation (1/20) Women empowerment Deprivation cut-off A household is deprived in schooling if No household member (16 years and above) has completed ten years of schooling A household is deprived in School items if any school age child hasn't enough school books, shoes and uniform A household is deprived if any member smoke or chew tobacco on a daily basis A household is deprived in nutrition if any adult in the household with nutritional information is low BMI or high BMI A household is deprived in nutrition if any child in the household is undernourished A household is deprived in housing if construction materials of are semi-permanent ( floor, wall, and roof) A household is deprived in sanitation if the household's sanitation facility is not improved or it is shared with other households Safe drinking water (1/20) A household is deprived in water if the household does not have access to safe drinking water or safe water is more than 15 -minute walk Indoor pollution (1/20) A household is deprived if smoke coming to inside the household Assets (1/20) Household does not own at most one radio: telephone, TV, bike, motorbike or refrigerator and does not own a car/van/Jeep/bus/lorry/motor boat or truck A household is deprived if female haven't a bank account A household is deprived if female does not access to media A household is deprived if female does not work Bank account (1/12) Access to media (1/12) Employment (1/12)
Distribution of general and multidimensionally poor population by sector-2016 90. 0 Percentage of population(%) 80. 0 The poor population share is 79. 5 78. 6 MPI poor Total population 70. 0 higher than the general population share in estate sector. 60. 0 50. 0 In rural sector also share of poor 40. 0 30. 0 20. 0 12. 0 population is slightly higher that 17. 4 10. 0 8. 5 4. 1 0. 0 Rural Urban Sector Estate that of general population.
ar w Ki a llin eliy M oc a on hc ar hi Ba aga tti la Ra cal tn oa ap u Po Ba ra lo du nn lla a M ruw ul a la iti v Tr Ka u in n co dy m a Am lee pa M ra at Ke ale Va gall vu e Sr niy i L a a An Pu nka ur tta ad lam Ku hap ru ura ne ga la Ga ll Ja e f M fna an n Ha Kalu ar m ta ba ra nt o M ta Ga atar m a p Co ah lo a m bo Nu National Variation across districts Multidimensional Poverty Index (MPI) by district 25 20 15 10 5 0 District
Headcount Ratios by indicator -2016 • Indoor pollution and deprivation of eligible women employment shows the higher headcount index than other indicators Vari atio n acro ss Indi cato rs Percentage of poor and deprived population (%) 30. 0 25. 0 20. 0 15. 0 10. 0 5. 0 0. 0 TC NA Health NC YS SI Education IP AS SDW Standard of living HS SN EM BA AM Women empowerment The percentage share of population who are multidimensionally poor and deprived in each dimensions. • The third highest headcount has reported from tobacco consumption.
Contribution of each Dimension to National MPI Women Empower ment, 28. 2% Education, 14. 2% Health, 29. 7% Living Standard, 27. 9% Deprivation of Health, Women Empowerment and Living Standard more or less equally contribute to National MPI and lowest contribution reported from Education
Percentage Contribution of Each Indicator to national MPI, 2016 The highest contribution is given by women employment and second highest is tobacco consumption and third highest is indoor pollution. The lowest contribution is given by sanitation.
Percentage Contribution of Each Indicator to national MPI by sector 2016 100% • The graph depicts that in urban and rural deprivation of women employment contribute to poverty is higher than other indicators 90% 80% Percentatge(%) 70% 60% 50% 40% 30% 20% 10% 0% Housing Sanitation Access to media School items Assets Safe drinking water Bank account Nutrition of child Nutrition of adult Year of Schooling Indoor pollution Tobacco consumption Employment Urban 1. 8 3. 0 3. 7 4. 7 5. 0 1. 2 11. 2 8. 8 11. 7 8. 6 7. 2 13. 3 19. 9 Rural 2. 7 2. 8 4. 1 5. 3 5. 6 7. 3 7. 5 7. 7 8. 7 11. 2 14. 6 17. 7 Estate 10. 1 3. 5 1. 6 3. 6 10. 0 8. 6 6. 2 5. 2 16. 0 8. 6 14. 0 7. 5 • In estate sector the highest contributing indicator for poverty is year of schooling. • The second highest contribution to poverty in all three sectors is deprivation of tobacco consumption.
Percentage Contribution of Each Indicator to national MPI by District 2016 Women Employment (20. 7%) 100% 90% Tobacco Consumption (18. 6%) Percentage contribution(%) 80% School items 11. 5% 70% 60% Year of schooling 14. 1% • The contribution of year of schooling is high in the districts Puttalama(14. 1%), Mannar (13. 6%), Trincomalee (13. 0%), Nuwaraeliya(12. 9 • The highest contribution to overall poverty by school items is reported from Batticaloa district (11. 5%). 50% 40% • The highest contribution of tobacco consumption is reported from Hambantota (18. 6%) followed by Rathnapura (18. 1%), Gall (17. 3%), Kalutara (16. 9%) 30% 20% 10% Co lo G mb am o p K aha al ut a K ra an N M dy uw at ar ale ae liy a G al l H Ma e am ta ba ra nt ot a Ja f n M a an V nar av M un ul ia K laiti ili w no u Ba chc tti hi ca lo A Tr m a in pa co ra K ma ur le un e Pu ega A tta la nu la r m Po ada a lo pu nn ra ar u Ba wa M d on ull a a Ra rag th ala na p K ura eg al le 0% Year of Schooling School items Tobacco consumption Nutrition of adult Nutrition of child Housing Safe drinking water Indoor pollution Assets Bank account Access to media Employment Indicator contribution is not alike by districts • The highest contribution of women employment has been reported from Hambanthota(20. 7%)
Percentage of population(%) Variation across districts Consumption poverty Headcount vs. Multidimensional poverty Headcount 70. 0 60. 0 50. 0 40. 0 30. 0 20. 0 10. 0 N uw ar K aeli ill in ya o M chc on hi ar a Ba gala tti c Ra aloa tn ap ur Ba a Po d lo ulla nn ar M uwa ul la iti v A u Tr mp in ara co m al ee K an dy M at a K le eg V alle av un Sr iya A i. L nu an k ra dh a ap u Pu ra t K tala ur m un eg al a G al le Ja ffn M a an n K ar al u H am tara ba nt ot M a at G ara am pa Co ha lo m bo 0. 0 District Headcount of multidimensional poverty Consumton Poverty Headcount(H) • The poorest district by multidimensional poverty is not much monetary poor • Monetary poverty and Multidimensional poverty do not trend together
NATIONAL HEADCOUNT FOR CHILDREN AND OTHER ADULT POPULATION Multidimensional poverty headcount (H) by age groups-2016 60. 0 Variation across age groups Percentage of population (%) 50. 0 40. 0 30. 0 20. 0 10. 0 0 -9 10 - 17 18 -24 25 -35 Age group 36 -49 50 -64 14 65 and above
Conclusions • The highest deprived indicator is indoor pollution , Secondly highest is female not work mainly due to difficult to find a job and need to be home for the children and the third highest deprived indicator is tobacco consumption. • NMPI is much higher in estate sector than that of other two sectors in Sri Lanka. It more than twice than rural sector. • The highest National Multidimensional Poverty indices are reported from Nuwara-Eliya district and the lowest has been reported from Colombo district. • The health, women empowerment and living standard dimensions more or less equally contribute to overall poverty and contribution of education to overall poverty is comparatively less than other dimensions. 15
Cont. ……. • Among the indicators the highest contribution is given by women employment and second highest is tobacco consumption and third highest is indoor pollution. • The contribution of year of schooling is high in Puttalama distict (14. 1%), • The highest contribution to overall poverty by school items is reported from Batticaloa district (11. 5%). • The highest contribution of tobacco consumption is reported from Hambantota (18. 6%) • Monetary poverty and Multidimensional poverty do not trend together 16
AKNOWLEDGEMENT Support Provided by Mrs. M. D. Deepawansa statistician Department of Census & Statistics Sri Lanka
THANK YOU 18