Data Mining Concepts and Techniques Chapter 1 2
- Slides: 56
Data Mining: Concepts and Techniques — Chapter 1, 2 — DR. Musaab Riyadh Abdulrazzaq Mustansiriyah University College of Science- Computer Dept. 1
Why Data Mining? n The Explosive Growth of Data: from terabytes to petabytes n Data collection and data availability n Automated data collection tools, database systems, Web, computerized society n Major sources of abundant data n Business: Web, e-commerce, transactions, stocks, … n Science: Remote sensing, bioinformatics, scientific simulation, … n Society and everyone: news, digital cameras, You. Tube n We are drowning in data, but starving for knowledge! n “Necessity is the mother of invention”—Data mining—Automated analysis of massive data sets 2
What Is Data Mining? n Data mining (knowledge discovery from data) n Extraction of interesting (non-trivial, implicit, previously unknown and potentially useful) patterns or knowledge from huge amount of data n n Alternative names n n Data mining: a misnomer? Knowledge discovery (mining) in databases (KDD), knowledge extraction, data/pattern analysis, data archeology, data dredging, information harvesting, business intelligence, etc. Watch out: Is everything “data mining”? n Simple search and query processing n (Deductive) expert systems 3
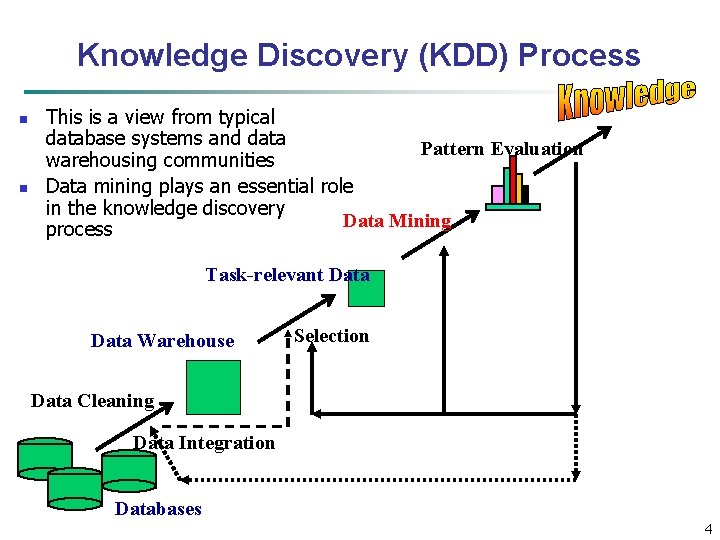
Knowledge Discovery (KDD) Process n n This is a view from typical database systems and data Pattern Evaluation warehousing communities Data mining plays an essential role in the knowledge discovery Data Mining process Task-relevant Data Warehouse Selection Data Cleaning Data Integration Databases 4
Chapter 2: Getting to Know Your Data n Data Objects and Attribute Types n Basic Statistical Descriptions of Data n Data Visualization n Measuring Data Similarity and Dissimilarity n Summary 5
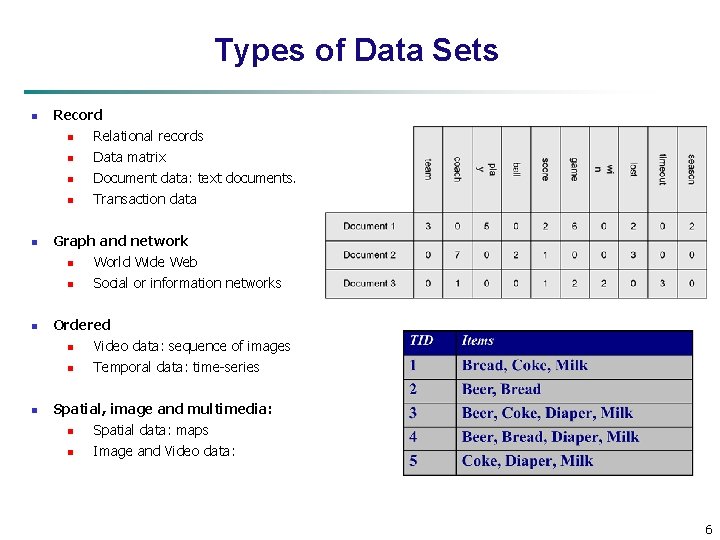
Types of Data Sets n n Record n Relational records n Data matrix n Document data: text documents. n Transaction data Graph and network n World Wide Web n Social or information networks Ordered n Video data: sequence of images n Temporal data: time-series Spatial, image and multimedia: n Spatial data: maps n Image and Video data: 6
Data Objects n Data sets are made up of data objects. n A data object represents an entity. n Examples: n n sales database: customers, store items, sales n medical database: patients, treatments n university database: students, professors, courses Also called samples , examples, instances, data points, objects, tuples. n Data objects are described by attributes. n Database rows -> data objects; columns ->attributes. 7
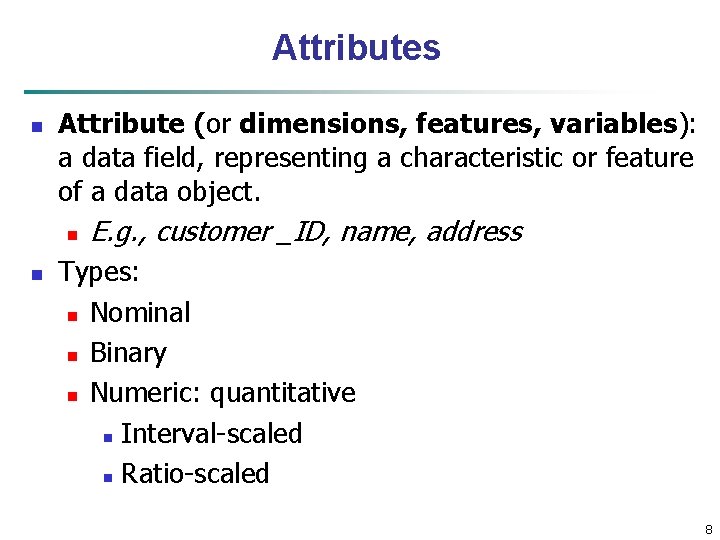
Attributes n Attribute (or dimensions, features, variables): a data field, representing a characteristic or feature of a data object. n n E. g. , customer _ID, name, address Types: n Nominal n Binary n Numeric: quantitative n Interval-scaled n Ratio-scaled 8
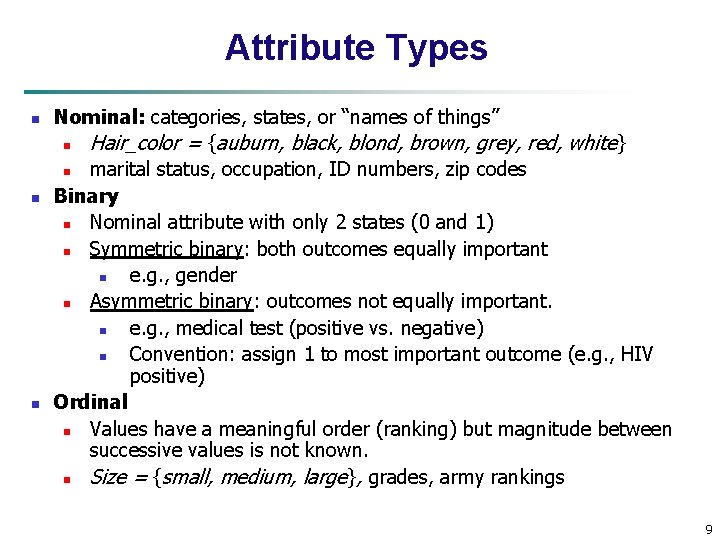
Attribute Types n n n Nominal: categories, states, or “names of things” n Hair_color = {auburn, black, blond, brown, grey, red, white} n marital status, occupation, ID numbers, zip codes Binary n Nominal attribute with only 2 states (0 and 1) n Symmetric binary: both outcomes equally important n e. g. , gender n Asymmetric binary: outcomes not equally important. n e. g. , medical test (positive vs. negative) n Convention: assign 1 to most important outcome (e. g. , HIV positive) Ordinal n Values have a meaningful order (ranking) but magnitude between successive values is not known. n Size = {small, medium, large}, grades, army rankings 9
Numeric Attribute Types n n n Quantity (integer or real-valued) Interval n Measured on a scale of equal-sized units n Values have order n E. g. , temperature in C˚or F˚, calendar dates Ratio n Inherent zero-point n We can speak of values as being an order of magnitude larger than the unit of measurement (10 K˚ is twice as high as 5 K˚). n e. g. , temperature in Kelvin, length, counts, monetary quantities 10
Discrete vs. Continuous Attributes n n Discrete Attribute n Has only a finite or countably infinite set of values n E. g. , zip codes, profession, or the set of words in a collection of documents n Sometimes, represented as integer variables n Note: Binary attributes are a special case of discrete attributes Continuous Attribute n Has real numbers as attribute values n E. g. , temperature, height, or weight n Practically, real values can only be measured and represented using a finite number of digits n Continuous attributes are typically represented as floating-point variables 11
Chapter 2: Getting to Know Your Data n Data Objects and Attribute Types n Basic Statistical Descriptions of Data n Data Visualization n Measuring Data Similarity and Dissimilarity n Summary 12
Basic Statistical Descriptions of Data Motivation n To better understand the data: central tendency, variation and spread n Data dispersion characteristics n median, max, min, quantiles, outliers, variance, etc. n Numerical dimensions correspond to sorted intervals n Data dispersion: analyzed with multiple granularities of precision n Boxplot or quantile analysis on sorted intervals n Dispersion analysis on computed measures n Folding measures into numerical dimensions n Boxplot or quantile analysis on the transformed cube n 13
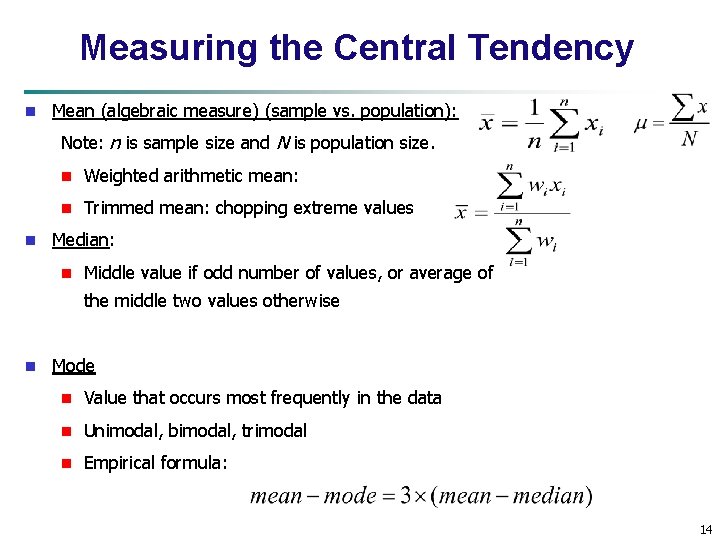
Measuring the Central Tendency n Mean (algebraic measure) (sample vs. population): Note: n is sample size and N is population size. n n Weighted arithmetic mean: n Trimmed mean: chopping extreme values Median: n Middle value if odd number of values, or average of the middle two values otherwise n Mode n Value that occurs most frequently in the data n Unimodal, bimodal, trimodal n Empirical formula: 14
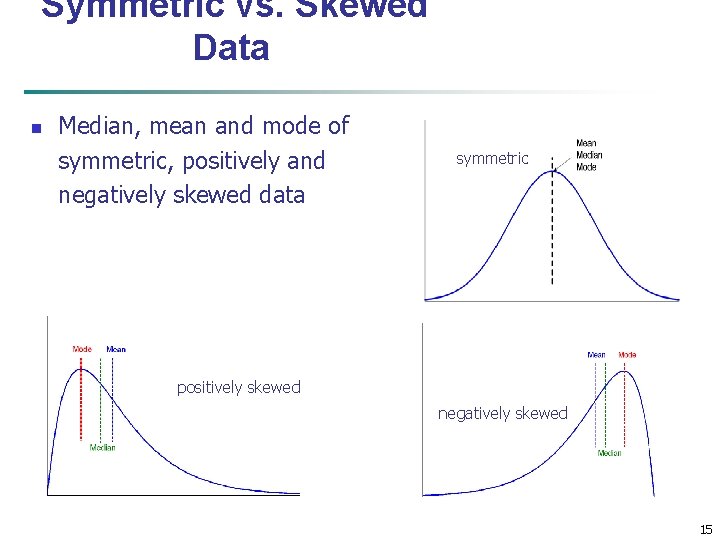
Symmetric vs. Skewed Data n Median, mean and mode of symmetric, positively and negatively skewed data symmetric positively skewed negatively skewed 15
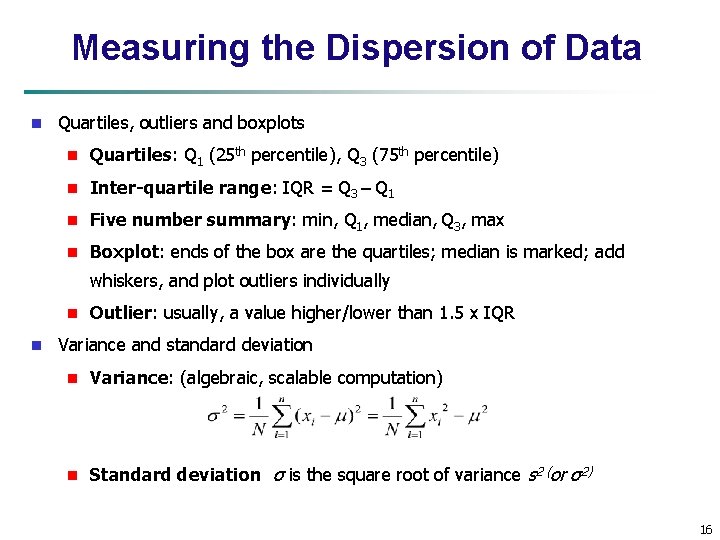
Measuring the Dispersion of Data n Quartiles, outliers and boxplots n Quartiles: Q 1 (25 th percentile), Q 3 (75 th percentile) n Inter-quartile range: IQR = Q 3 – Q 1 n Five number summary: min, Q 1, median, Q 3, max n Boxplot: ends of the box are the quartiles; median is marked; add whiskers, and plot outliers individually n n Outlier: usually, a value higher/lower than 1. 5 x IQR Variance and standard deviation n Variance: (algebraic, scalable computation) n Standard deviation σ is the square root of variance s 2 (or σ2) 16
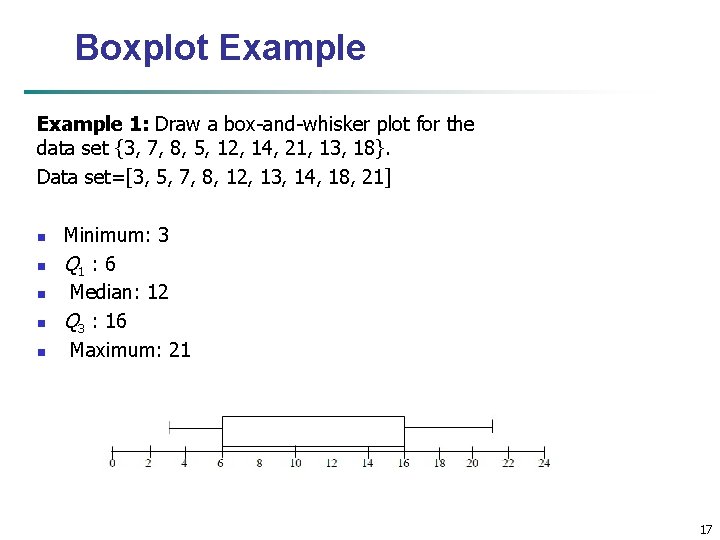
Boxplot Example 1: Draw a box-and-whisker plot for the data set {3, 7, 8, 5, 12, 14, 21, 13, 18}. Data set=[3, 5, 7, 8, 12, 13, 14, 18, 21] n n n Minimum: 3 Q 1 : 6 Median: 12 Q 3 : 16 Maximum: 21 17
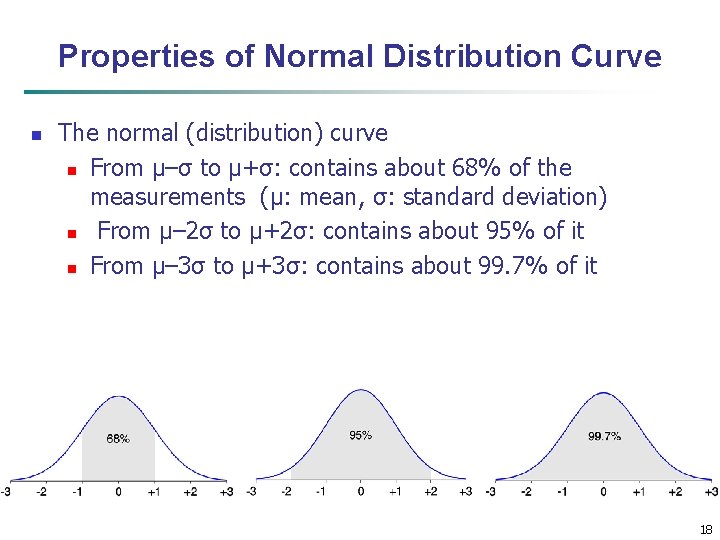
Properties of Normal Distribution Curve n The normal (distribution) curve n From μ–σ to μ+σ: contains about 68% of the measurements (μ: mean, σ: standard deviation) n From μ– 2σ to μ+2σ: contains about 95% of it n From μ– 3σ to μ+3σ: contains about 99. 7% of it 18
Graphic Displays of Basic Statistical Descriptions n Boxplot: graphic display of five-number summary n Histogram: x-axis are values, y-axis repres. frequencies n Scatter plot: each pair of values is a pair of coordinates and plotted as points in the plane 19
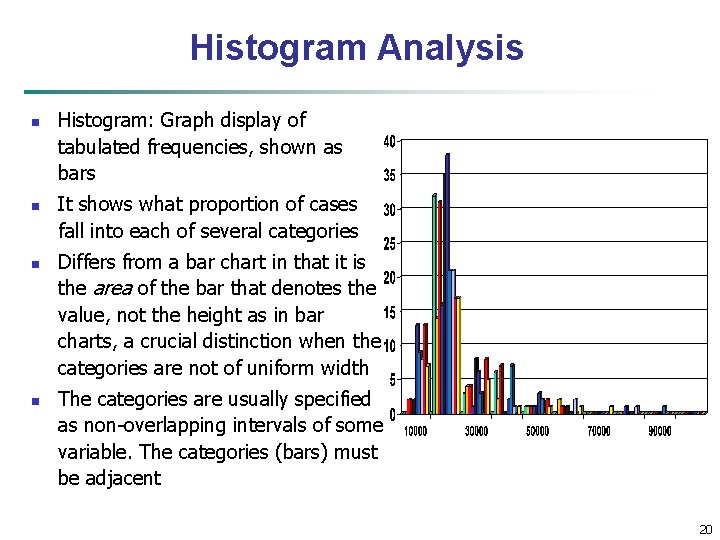
Histogram Analysis n n Histogram: Graph display of tabulated frequencies, shown as bars It shows what proportion of cases fall into each of several categories Differs from a bar chart in that it is the area of the bar that denotes the value, not the height as in bar charts, a crucial distinction when the categories are not of uniform width The categories are usually specified as non-overlapping intervals of some variable. The categories (bars) must be adjacent 20
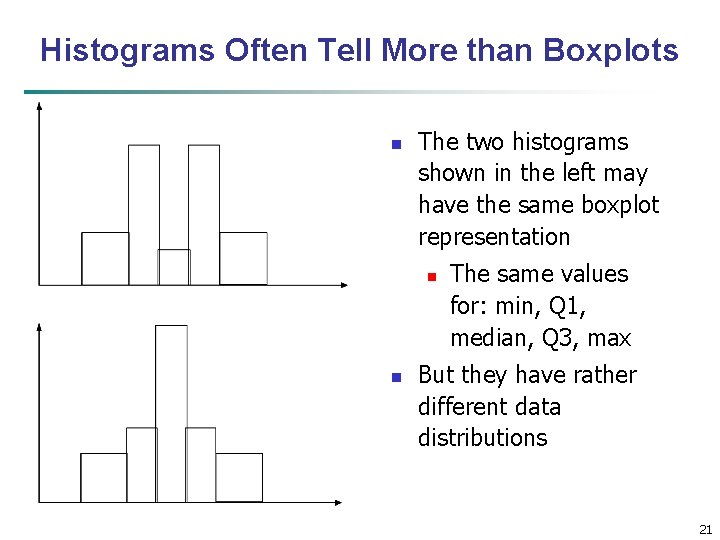
Histograms Often Tell More than Boxplots n The two histograms shown in the left may have the same boxplot representation n n The same values for: min, Q 1, median, Q 3, max But they have rather different data distributions 21
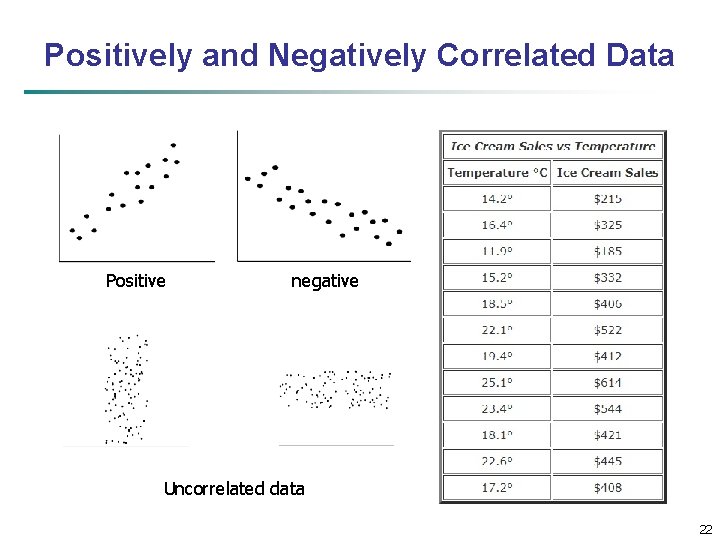
Positively and Negatively Correlated Data Positive negative Uncorrelated data 22
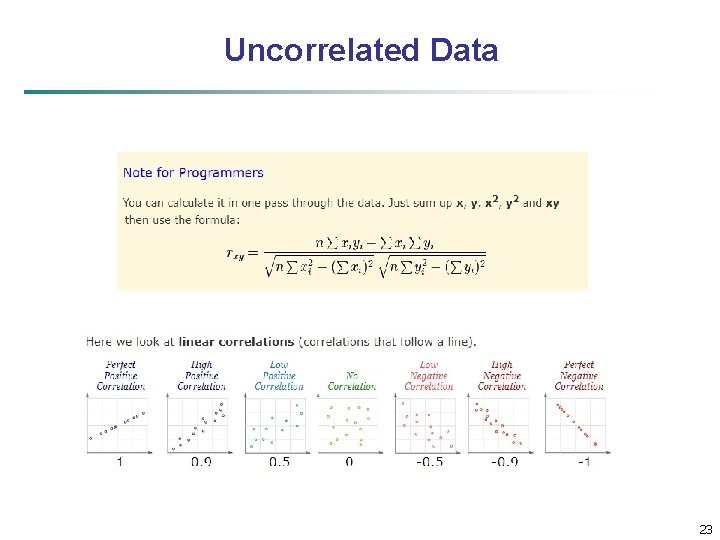
Uncorrelated Data 23
Chapter 2: Getting to Know Your Data n Data Objects and Attribute Types n Basic Statistical Descriptions of Data n Data Visualization n Measuring Data Similarity and Dissimilarity n Summary 24
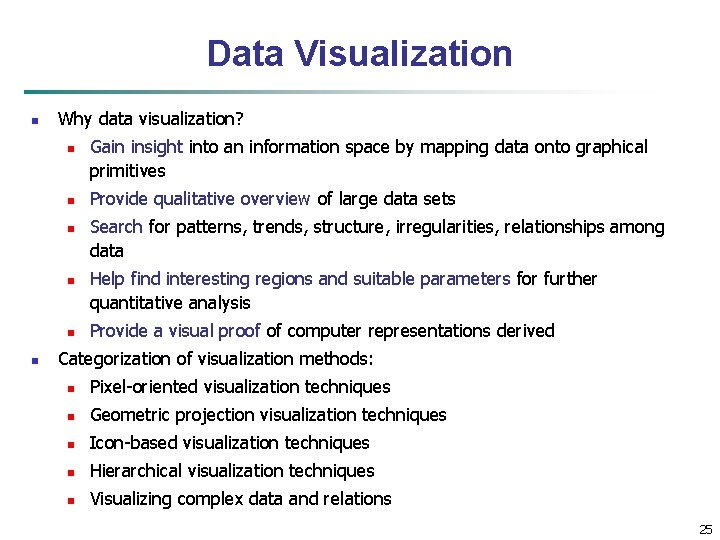
Data Visualization n Why data visualization? n n n Gain insight into an information space by mapping data onto graphical primitives Provide qualitative overview of large data sets Search for patterns, trends, structure, irregularities, relationships among data Help find interesting regions and suitable parameters for further quantitative analysis Provide a visual proof of computer representations derived Categorization of visualization methods: n Pixel-oriented visualization techniques n Geometric projection visualization techniques n Icon-based visualization techniques n Hierarchical visualization techniques n Visualizing complex data and relations 25
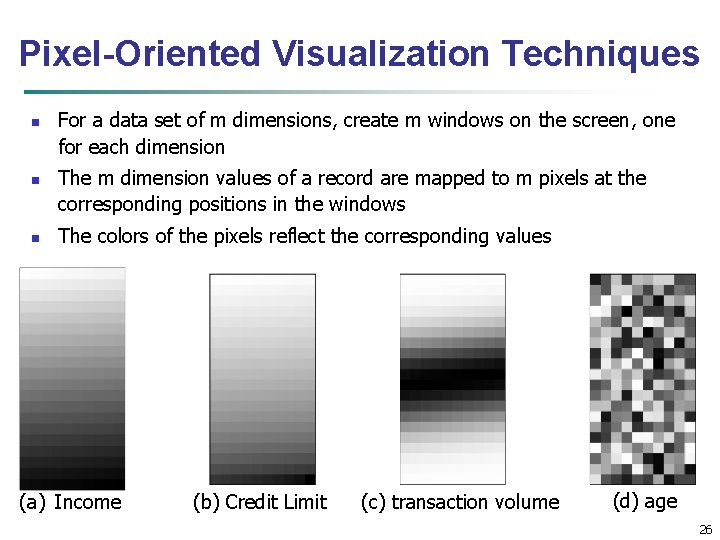
Pixel-Oriented Visualization Techniques n n n For a data set of m dimensions, create m windows on the screen, one for each dimension The m dimension values of a record are mapped to m pixels at the corresponding positions in the windows The colors of the pixels reflect the corresponding values (a) Income (b) Credit Limit (c) transaction volume (d) age 26
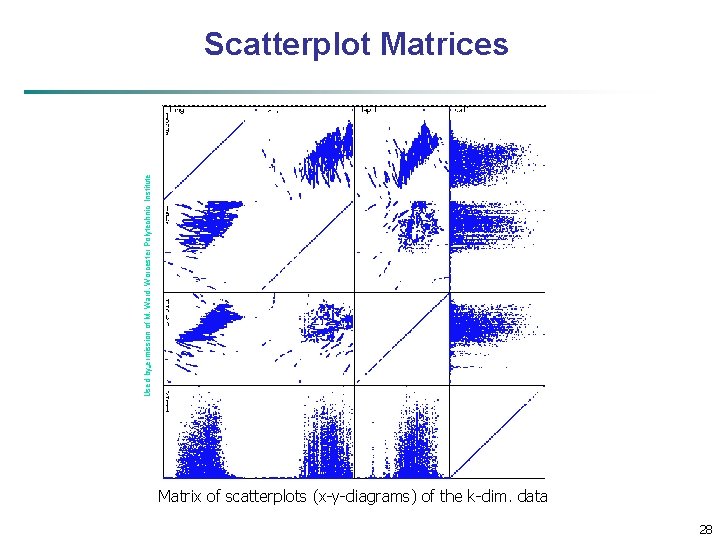
Geometric Projection Visualization Techniques n n Visualization of geometric transformations and projections of the data Methods n Scatterplot and scatterplot matrices n Parallel coordinates 27
Used by ermission of M. Ward, Worcester Polytechnic Institute Scatterplot Matrices Matrix of scatterplots (x-y-diagrams) of the k-dim. data 28
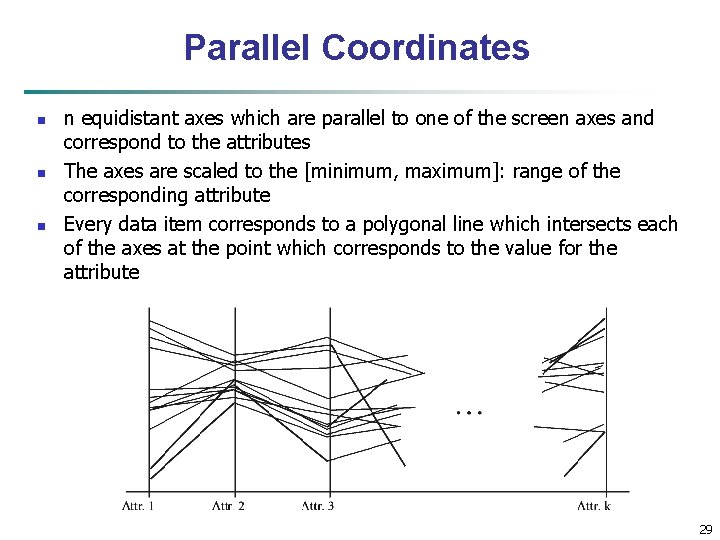
Parallel Coordinates n n equidistant axes which are parallel to one of the screen axes and correspond to the attributes The axes are scaled to the [minimum, maximum]: range of the corresponding attribute Every data item corresponds to a polygonal line which intersects each of the axes at the point which corresponds to the value for the attribute 29
Icon-Based Visualization Techniques n Visualization of the data values as features of icons n Typical visualization methods n n Chernoff Faces General techniques n n n Shape coding: Use shape to represent certain information encoding Color icons: Use color icons to encode more information Tile bars: Use small icons to represent the relevant feature vectors in document retrieval 30
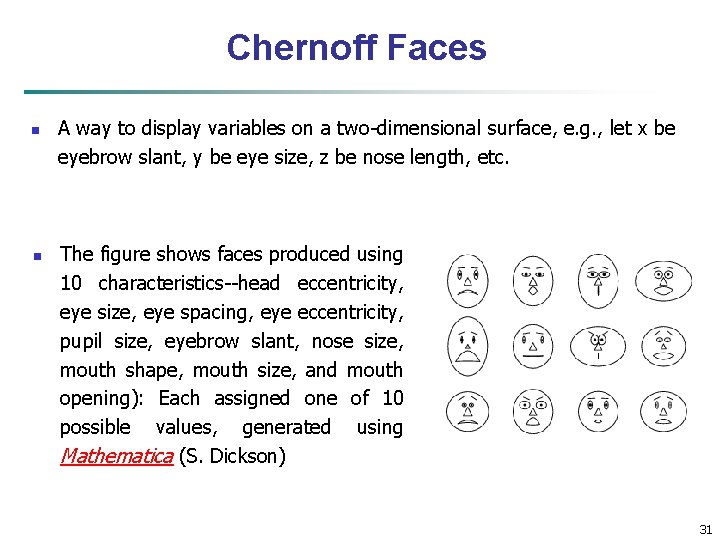
Chernoff Faces n n A way to display variables on a two-dimensional surface, e. g. , let x be eyebrow slant, y be eye size, z be nose length, etc. The figure shows faces produced using 10 characteristics--head eccentricity, eye size, eye spacing, eye eccentricity, pupil size, eyebrow slant, nose size, mouth shape, mouth size, and mouth opening): Each assigned one of 10 possible values, generated using Mathematica (S. Dickson) 31
Hierarchical Visualization Techniques n n Visualization of the data using a hierarchical partitioning into subspaces Methods n Dimensional Stacking n Worlds-within-Worlds n Tree-Map 32
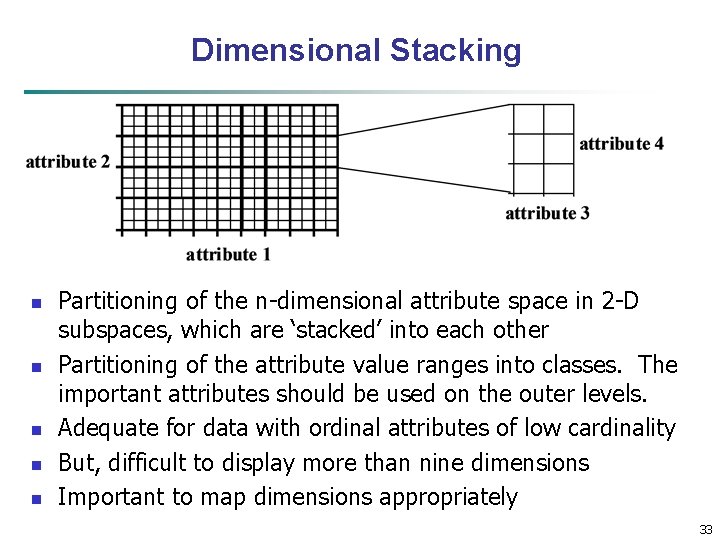
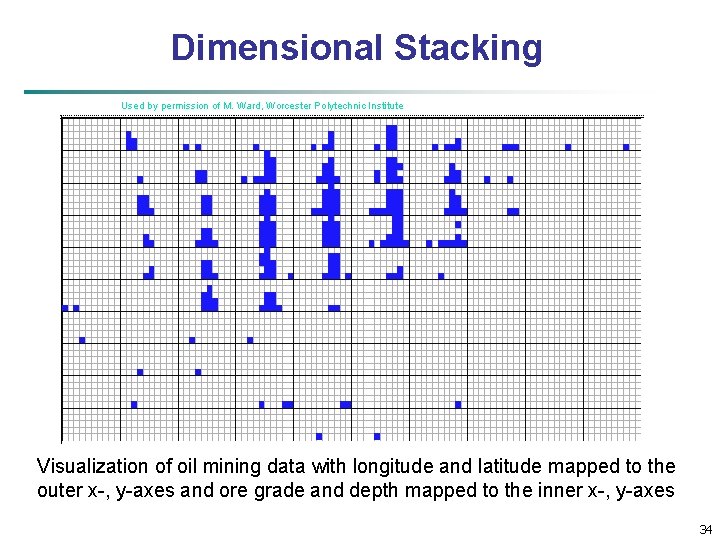
Dimensional Stacking n n n Partitioning of the n-dimensional attribute space in 2 -D subspaces, which are ‘stacked’ into each other Partitioning of the attribute value ranges into classes. The important attributes should be used on the outer levels. Adequate for data with ordinal attributes of low cardinality But, difficult to display more than nine dimensions Important to map dimensions appropriately 33
Dimensional Stacking Used by permission of M. Ward, Worcester Polytechnic Institute Visualization of oil mining data with longitude and latitude mapped to the outer x-, y-axes and ore grade and depth mapped to the inner x-, y-axes 34
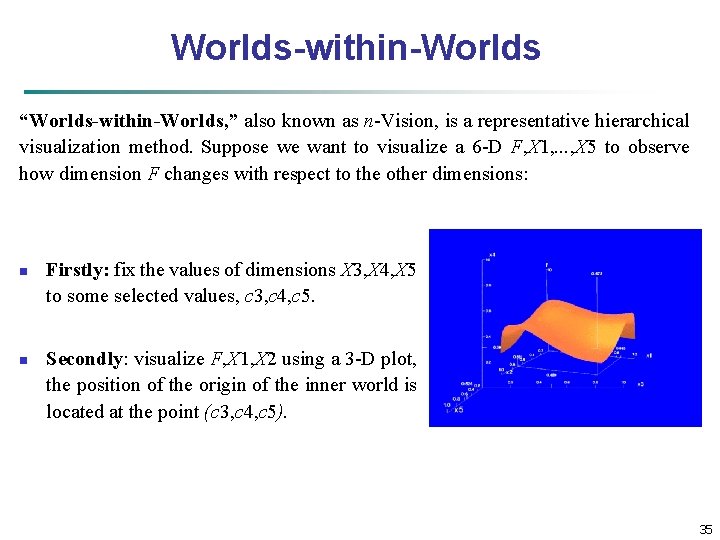
Worlds-within-Worlds “Worlds-within-Worlds, ” also known as n-Vision, is a representative hierarchical visualization method. Suppose we want to visualize a 6 -D F, X 1, . . . , X 5 to observe how dimension F changes with respect to the other dimensions: n n Firstly: fix the values of dimensions X 3, X 4, X 5 to some selected values, c 3, c 4, c 5. Secondly: visualize F, X 1, X 2 using a 3 -D plot, the position of the origin of the inner world is located at the point (c 3, c 4, c 5). 35
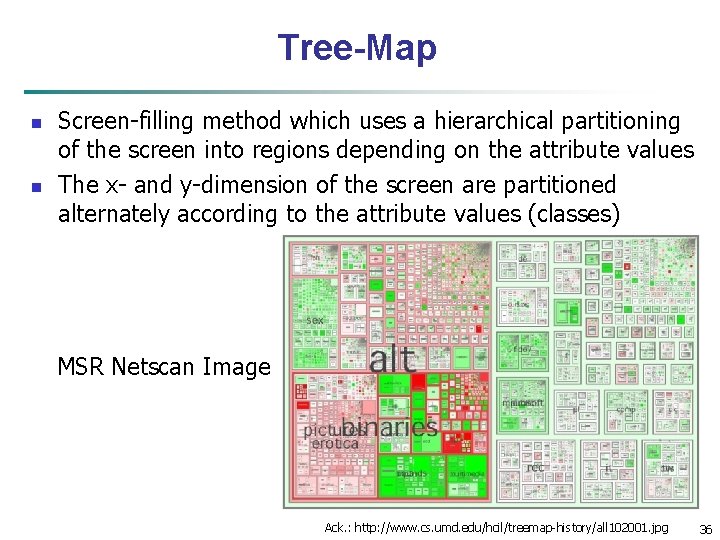
Tree-Map n n Screen-filling method which uses a hierarchical partitioning of the screen into regions depending on the attribute values The x- and y-dimension of the screen are partitioned alternately according to the attribute values (classes) MSR Netscan Image Ack. : http: //www. cs. umd. edu/hcil/treemap-history/all 102001. jpg 36
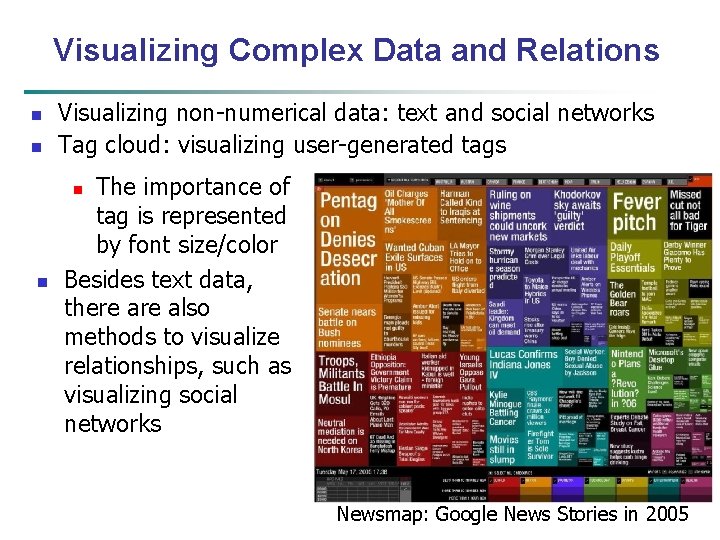
Visualizing Complex Data and Relations n n Visualizing non-numerical data: text and social networks Tag cloud: visualizing user-generated tags The importance of tag is represented by font size/color Besides text data, there also methods to visualize relationships, such as visualizing social networks n n Newsmap: Google News Stories in 2005
Chapter 2: Getting to Know Your Data n Data Objects and Attribute Types n Basic Statistical Descriptions of Data n Data Visualization n Measuring Data Similarity and Dissimilarity n Summary 38
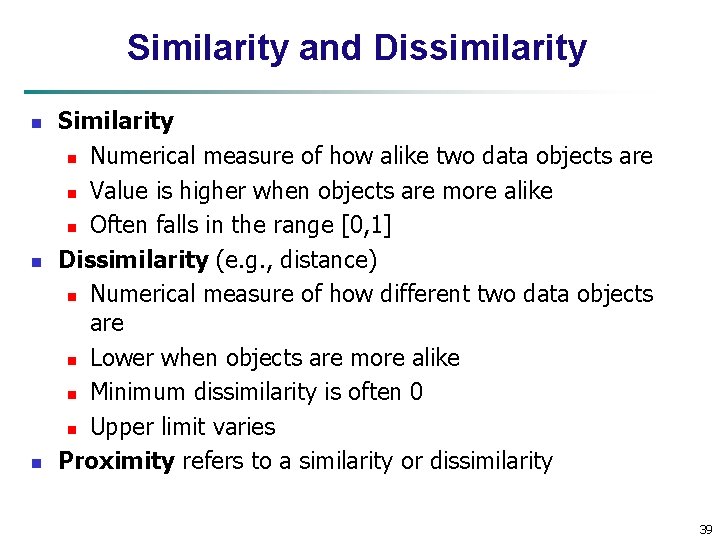
Similarity and Dissimilarity n n n Similarity n Numerical measure of how alike two data objects are n Value is higher when objects are more alike n Often falls in the range [0, 1] Dissimilarity (e. g. , distance) n Numerical measure of how different two data objects are n Lower when objects are more alike n Minimum dissimilarity is often 0 n Upper limit varies Proximity refers to a similarity or dissimilarity 39
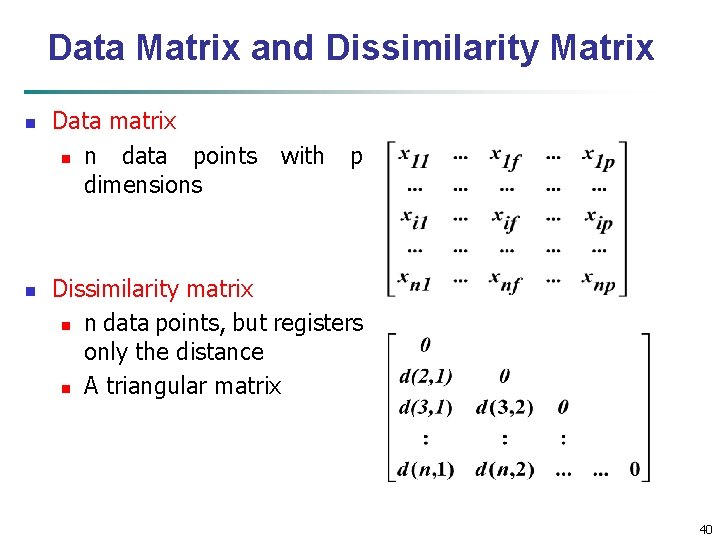
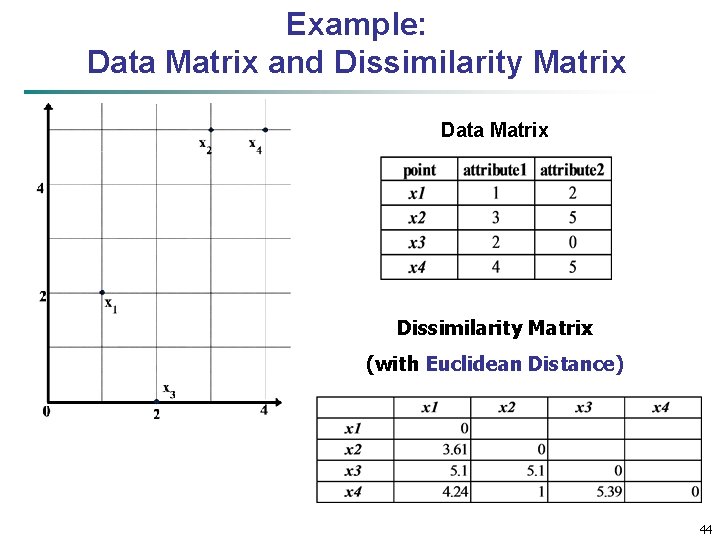
Data Matrix and Dissimilarity Matrix n n Data matrix n n data points with p dimensions Dissimilarity matrix n n data points, but registers only the distance n A triangular matrix 40
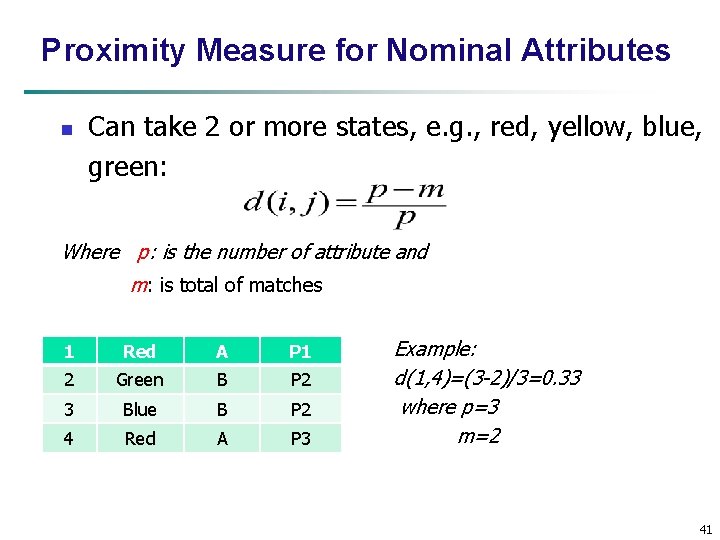
Proximity Measure for Nominal Attributes n Can take 2 or more states, e. g. , red, yellow, blue, green: Where p: is the number of attribute and m: is total of matches 1 Red A P 1 2 Green B P 2 3 Blue B P 2 4 Red A P 3 Example: d(1, 4)=(3 -2)/3=0. 33 where p=3 m=2 41
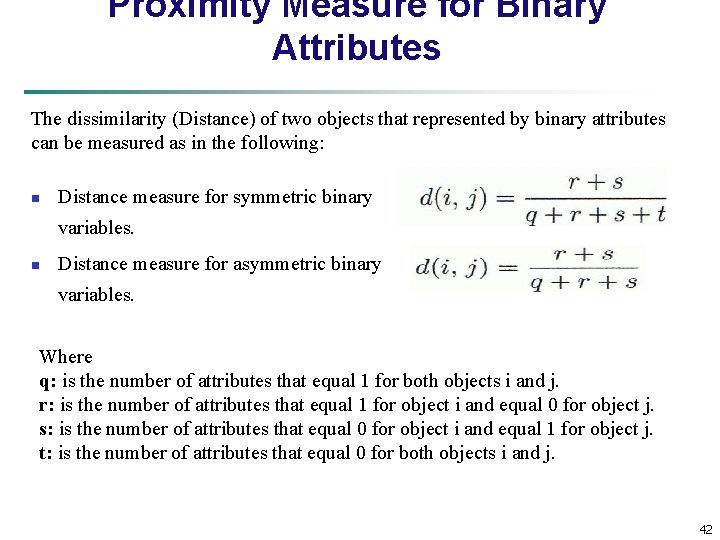
Proximity Measure for Binary Attributes The dissimilarity (Distance) of two objects that represented by binary attributes can be measured as in the following: n Distance measure for symmetric binary variables. n Distance measure for asymmetric binary variables. Where q: is the number of attributes that equal 1 for both objects i and j. r: is the number of attributes that equal 1 for object i and equal 0 for object j. s: is the number of attributes that equal 0 for object i and equal 1 for object j. t: is the number of attributes that equal 0 for both objects i and j. 42
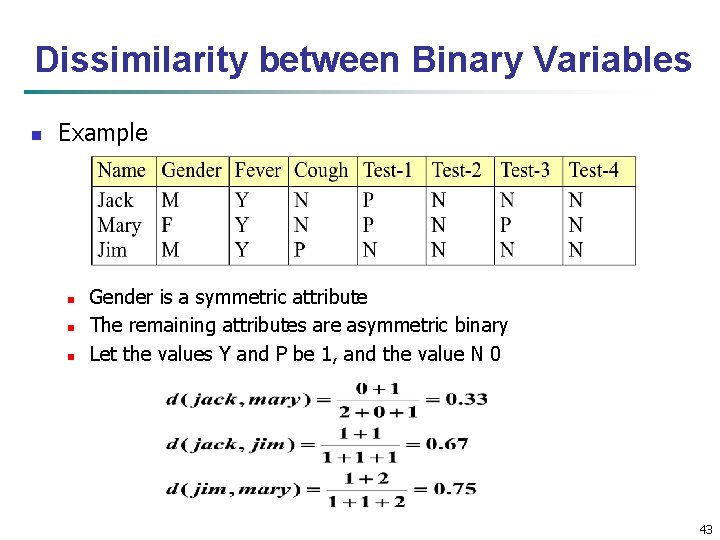
Dissimilarity between Binary Variables n Example n n n Gender is a symmetric attribute The remaining attributes are asymmetric binary Let the values Y and P be 1, and the value N 0 43
Example: Data Matrix and Dissimilarity Matrix Data Matrix Dissimilarity Matrix (with Euclidean Distance) 44
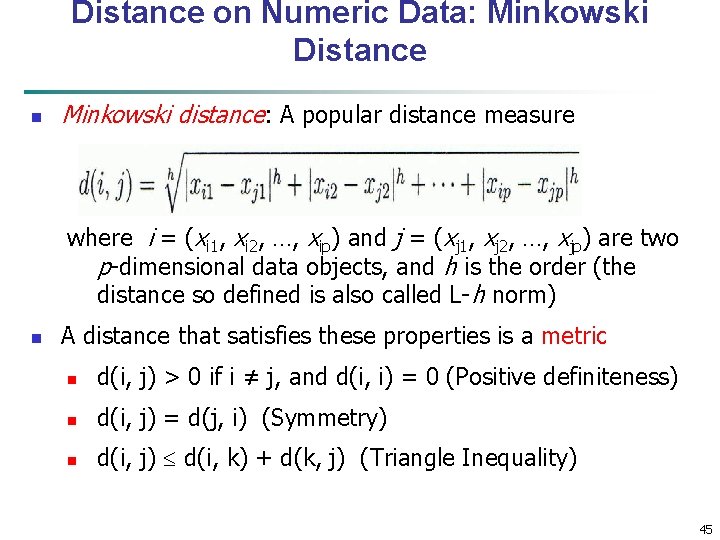
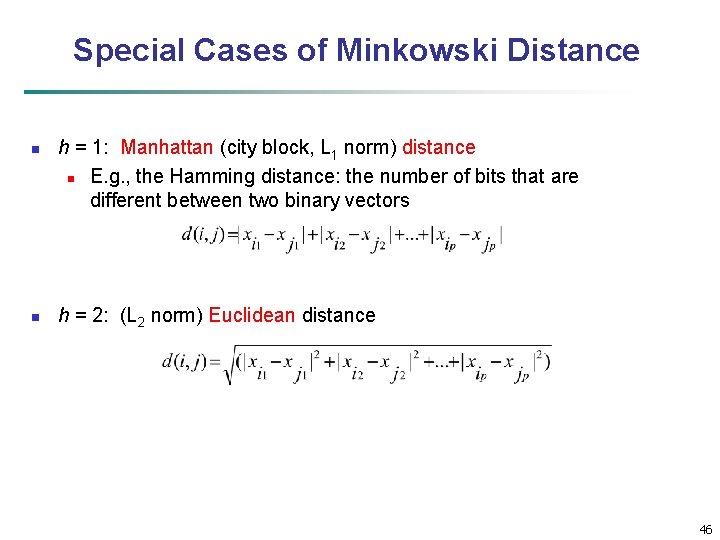
Distance on Numeric Data: Minkowski Distance n Minkowski distance: A popular distance measure where i = (xi 1, xi 2, …, xip) and j = (xj 1, xj 2, …, xjp) are two p-dimensional data objects, and h is the order (the distance so defined is also called L-h norm) n A distance that satisfies these properties is a metric n d(i, j) > 0 if i ≠ j, and d(i, i) = 0 (Positive definiteness) n d(i, j) = d(j, i) (Symmetry) n d(i, j) d(i, k) + d(k, j) (Triangle Inequality) 45
Special Cases of Minkowski Distance n n h = 1: Manhattan (city block, L 1 norm) distance n E. g. , the Hamming distance: the number of bits that are different between two binary vectors h = 2: (L 2 norm) Euclidean distance 46
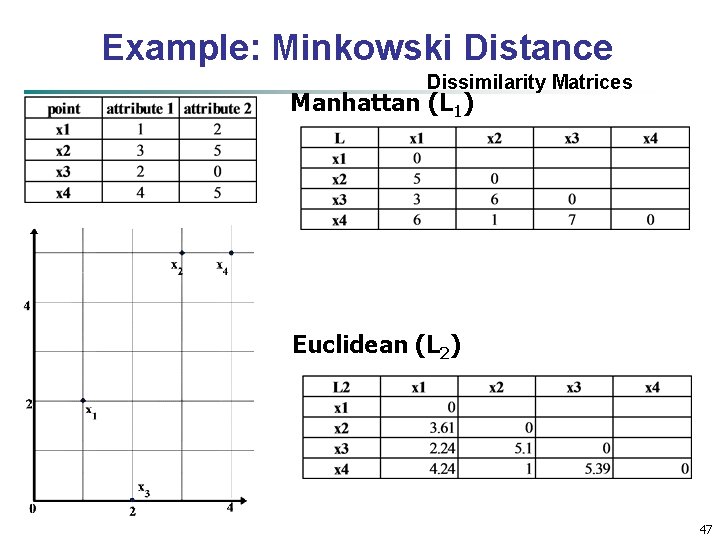
Example: Minkowski Distance Dissimilarity Matrices Manhattan (L 1) Euclidean (L 2) 47
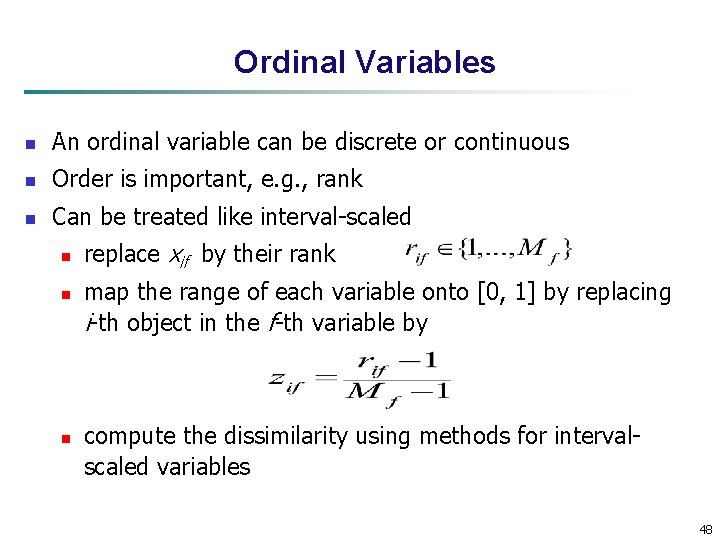
Ordinal Variables n An ordinal variable can be discrete or continuous n Order is important, e. g. , rank n Can be treated like interval-scaled n n n replace xif by their rank map the range of each variable onto [0, 1] by replacing i-th object in the f-th variable by compute the dissimilarity using methods for intervalscaled variables 48
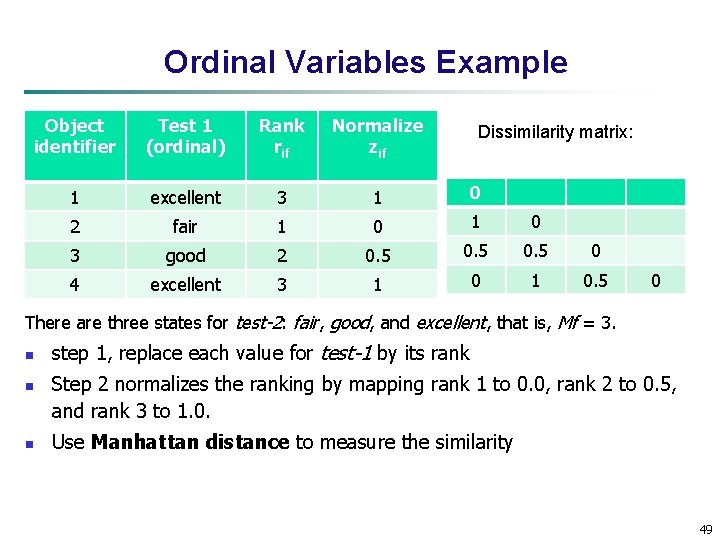
Ordinal Variables Example Object identifier Test 1 (ordinal) Rank rif Normalize zif 1 excellent 3 1 0 2 fair 1 0 3 good 2 0. 5 0 4 excellent 3 1 0. 5 Dissimilarity matrix: 0 There are three states for test-2: fair, good, and excellent, that is, Mf = 3. n n n step 1, replace each value for test-1 by its rank Step 2 normalizes the ranking by mapping rank 1 to 0. 0, rank 2 to 0. 5, and rank 3 to 1. 0. Use Manhattan distance to measure the similarity 49
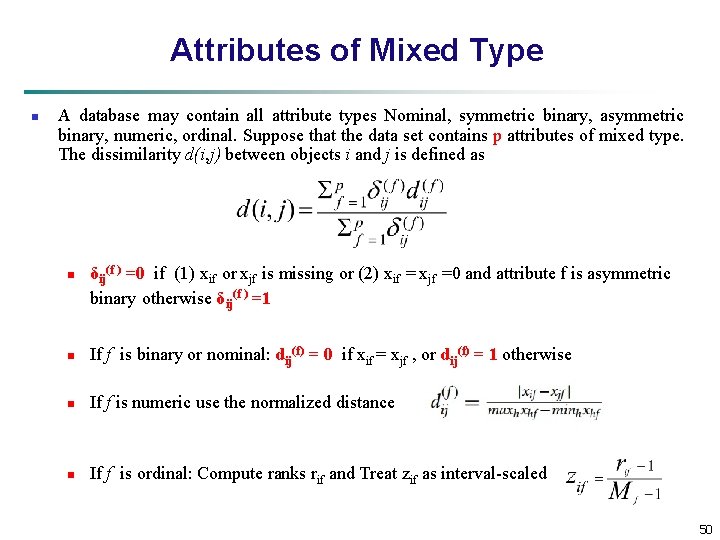
Attributes of Mixed Type n A database may contain all attribute types Nominal, symmetric binary, asymmetric binary, numeric, ordinal. Suppose that the data set contains p attributes of mixed type. The dissimilarity d(i, j) between objects i and j is defined as n δij(f ) =0 if (1) xif or xjf is missing or (2) xif = xjf =0 and attribute f is asymmetric binary otherwise δij(f ) =1 n If f is binary or nominal: dij(f) = 0 if xif = xjf , or dij(f) = 1 otherwise n If f is numeric use the normalized distance n If f is ordinal: Compute ranks rif and Treat zif as interval-scaled 50
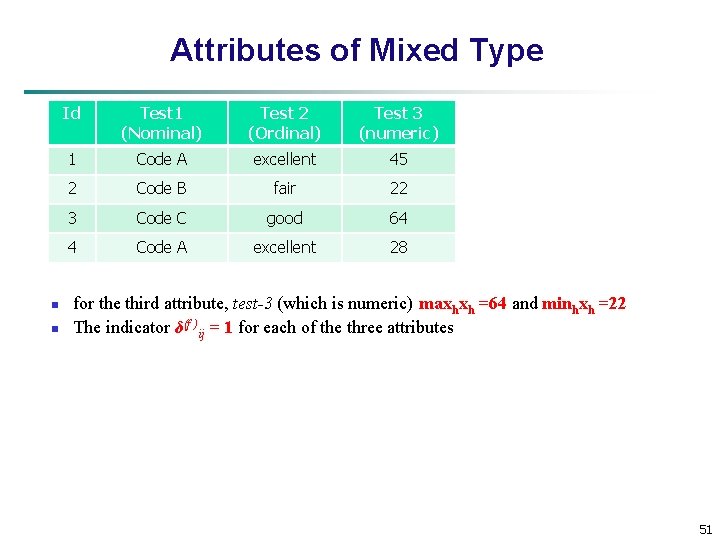
Attributes of Mixed Type n n Id Test 1 (Nominal) Test 2 (Ordinal) Test 3 (numeric) 1 Code A excellent 45 2 Code B fair 22 3 Code C good 64 4 Code A excellent 28 for the third attribute, test-3 (which is numeric) maxhxh =64 and minhxh =22 The indicator δ(f )ij = 1 for each of the three attributes 51
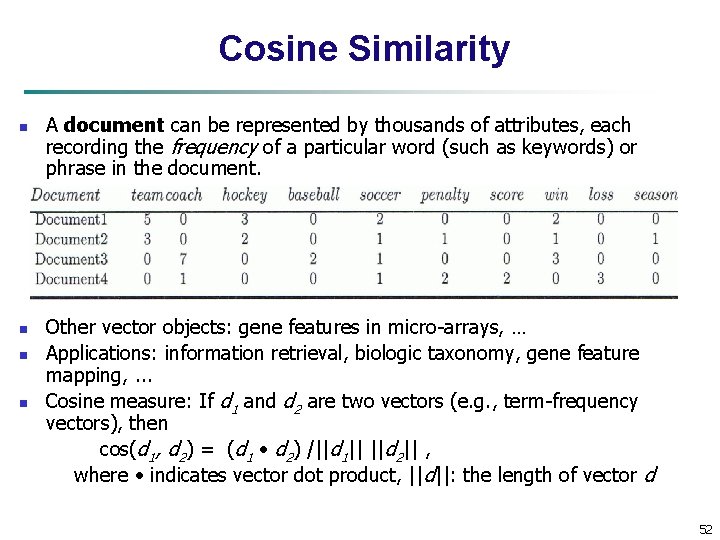
Cosine Similarity n A document can be represented by thousands of attributes, each recording the frequency of a particular word (such as keywords) or phrase in the document. Other vector objects: gene features in micro-arrays, … n Applications: information retrieval, biologic taxonomy, gene feature mapping, . . . n Cosine measure: If d 1 and d 2 are two vectors (e. g. , term-frequency vectors), then cos(d 1, d 2) = (d 1 d 2) /||d 1|| ||d 2|| , where indicates vector dot product, ||d||: the length of vector d n 52
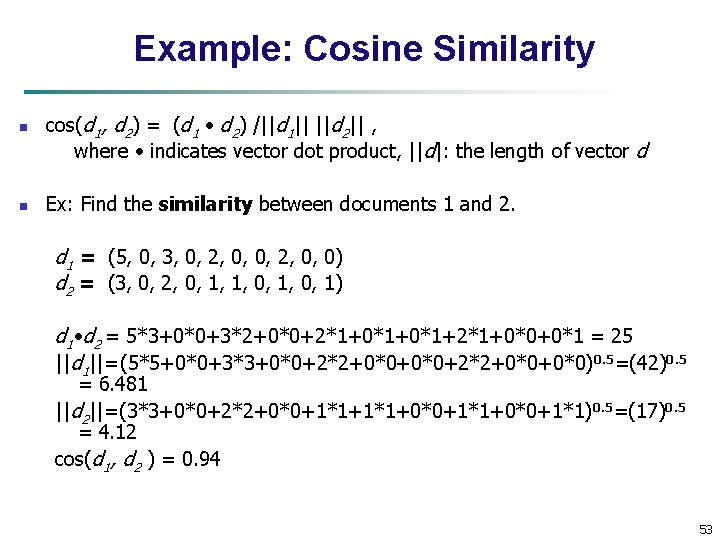
Example: Cosine Similarity n n cos(d 1, d 2) = (d 1 d 2) /||d 1|| ||d 2|| , where indicates vector dot product, ||d|: the length of vector d Ex: Find the similarity between documents 1 and 2. d 1 = (5, 0, 3, 0, 2, 0, 0) d 2 = (3, 0, 2, 0, 1, 1, 0, 1) d 1 d 2 = 5*3+0*0+3*2+0*0+2*1+0*1+2*1+0*0+0*1 = 25 ||d 1||= (5*5+0*0+3*3+0*0+2*2+0*0+0*0) 0. 5=(42)0. 5 = 6. 481 ||d 2||= (3*3+0*0+2*2+0*0+1*1+0*0+1*1) 0. 5=(17)0. 5 = 4. 12 cos(d 1, d 2 ) = 0. 94 53
Chapter 2: Getting to Know Your Data n Data Objects and Attribute Types n Basic Statistical Descriptions of Data n Data Visualization n Measuring Data Similarity and Dissimilarity n Summary 54
Summary n Data attribute types: nominal, binary, ordinal, interval-scaled, ratioscaled n Many types of data sets, e. g. , numerical, text, graph, Web, image. n Gain insight into the data by: n Basic statistical data description: central tendency, dispersion, graphical displays n Data visualization: map data onto graphical primitives n Measure data similarity n Above steps are the beginning of data preprocessing. n Many methods have been developed but still an active area of research. 55
Reference n Han Jiawei & Kamber Micheline. (2012). Data Mining: Concepts and Techniques, 3 nd edition, Morgan Kaufman. 56