
2170715 Data Mining Business Intelligence UNIT 4 Data
2170715 - Data Mining & Business Intelligence UNIT - 4 Data Preprocessing Prof. Naimish R. Vadodariya naimish. vadodariya@darshan. ac. in +91 -8866215253 Computer Engineering Darshan Institute of Engineering & Technology
Outline § Why to preprocess data? § Mean, median, mode & range § Attribute types § Data preprocessing tasks • Data cleaning • Data integration • Data transformation • Data reduction § Data mining task primitives Unit: 4 – Data Preprocessing 2 Darshan Institute of Engineering & Technology
Why to preprocess data? § Real world data are generally “dirty” • Incomplete: Missing attribute values, lack of certain attributes of interest, or containing only aggregate data. o E. g. Occupation=“ ” • Noisy: Containing errors or outliers. o E. g. Salary=“abcxy” • Inconsistent: Containing similarity in codes or names. o E. g. “Gujarat” & “Gujrat” (Common mistakes like spelling, grammar, articles) Unit: 4 – Data Preprocessing 3 Darshan Institute of Engineering & Technology
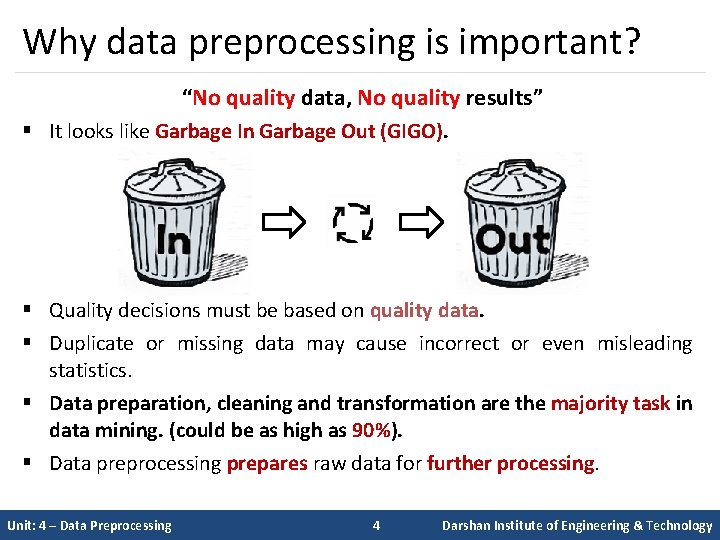
Why data preprocessing is important? “No quality data, No quality results” § It looks like Garbage In Garbage Out (GIGO). § Quality decisions must be based on quality data. § Duplicate or missing data may cause incorrect or even misleading statistics. § Data preparation, cleaning and transformation are the majority task in data mining. (could be as high as 90%). § Data preprocessing prepares raw data for further processing. Unit: 4 – Data Preprocessing 4 Darshan Institute of Engineering & Technology
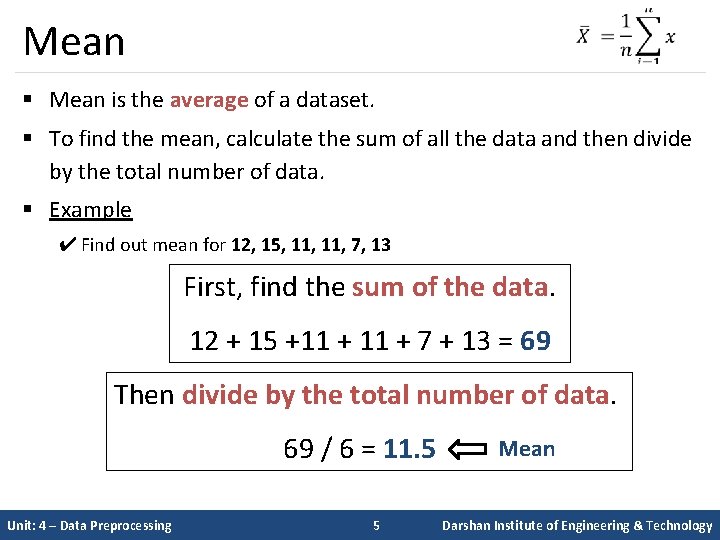
Mean § Mean is the average of a dataset. § To find the mean, calculate the sum of all the data and then divide by the total number of data. § Example ✔ Find out mean for 12, 15, 11, 7, 13 First, find the sum of the data. 12 + 15 +11 + 7 + 13 = 69 Then divide by the total number of data. 69 / 6 = 11. 5 Unit: 4 – Data Preprocessing 5 Mean Darshan Institute of Engineering & Technology
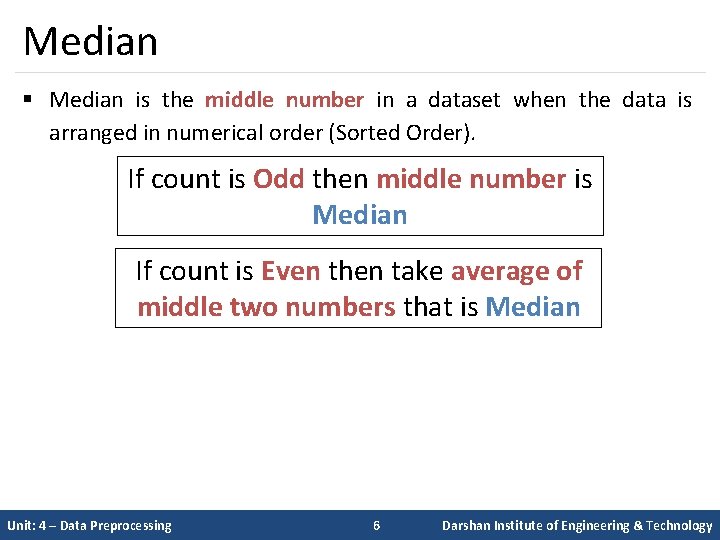
Median § Median is the middle number in a dataset when the data is arranged in numerical order (Sorted Order). If count is Odd then middle number is Median If count is Even then take average of middle two numbers that is Median Unit: 4 – Data Preprocessing 6 Darshan Institute of Engineering & Technology
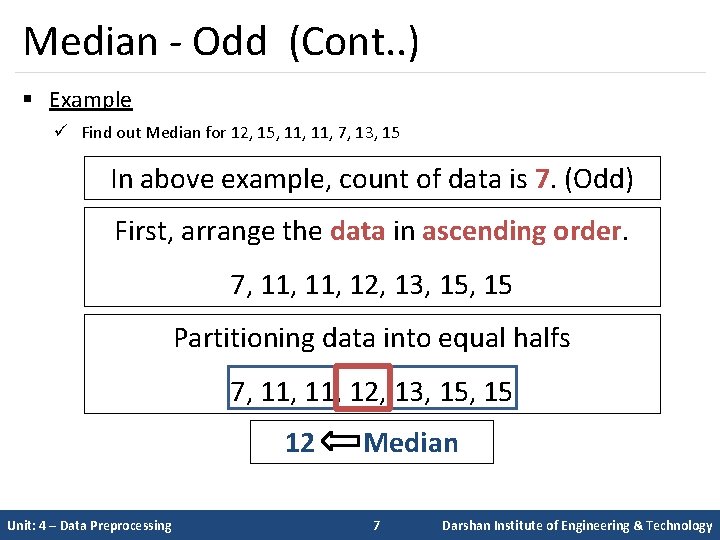
Median - Odd (Cont. . ) § Example ü Find out Median for 12, 15, 11, 7, 13, 15 In above example, count of data is 7. (Odd) First, arrange the data in ascending order. 7, 11, 12, 13, 15 Partitioning data into equal halfs 7, 11, 12, 13, 15 12 Median Unit: 4 – Data Preprocessing 7 Darshan Institute of Engineering & Technology
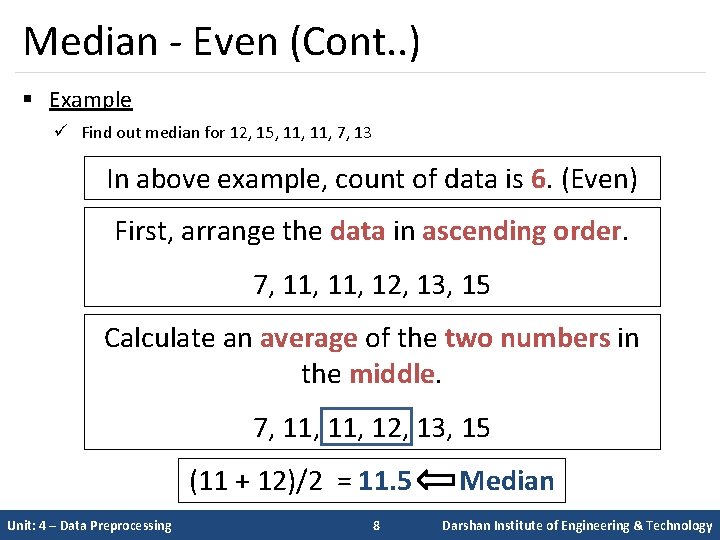
Median - Even (Cont. . ) § Example ü Find out median for 12, 15, 11, 7, 13 In above example, count of data is 6. (Even) First, arrange the data in ascending order. 7, 11, 12, 13, 15 Calculate an average of the two numbers in the middle. 7, 11, 12, 13, 15 (11 + 12)/2 = 11. 5 Unit: 4 – Data Preprocessing 8 Median Darshan Institute of Engineering & Technology
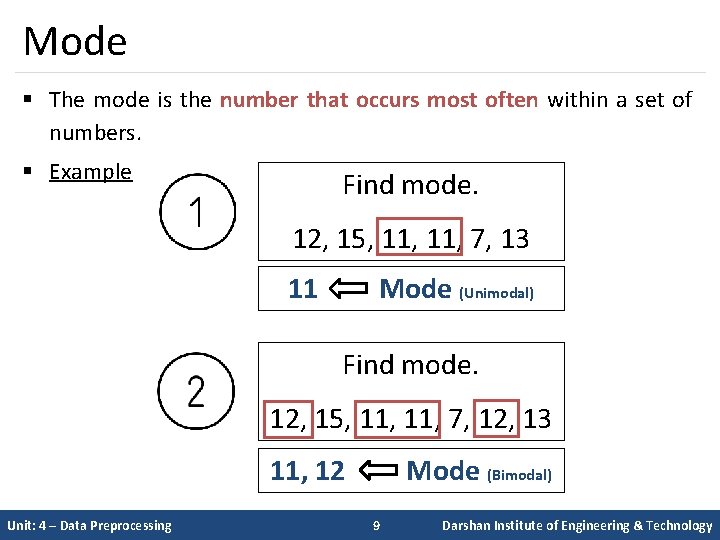
Mode § The mode is the number that occurs most often within a set of numbers. § Example Find mode. 12, 15, 11, 7, 13 11 Mode (Unimodal) Find mode. 12, 15, 11, 7, 12, 13 11, 12 Unit: 4 – Data Preprocessing Mode (Bimodal) 9 Darshan Institute of Engineering & Technology
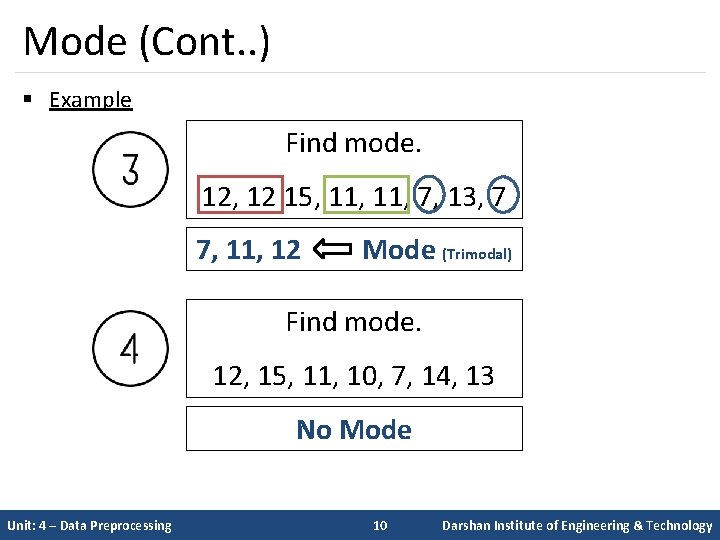
Mode (Cont. . ) § Example Find mode. 12, 12 15, 11, 7, 13, 7 7, 11, 12 Mode (Trimodal) Find mode. 12, 15, 11, 10, 7, 14, 13 No Mode Unit: 4 – Data Preprocessing 10 Darshan Institute of Engineering & Technology
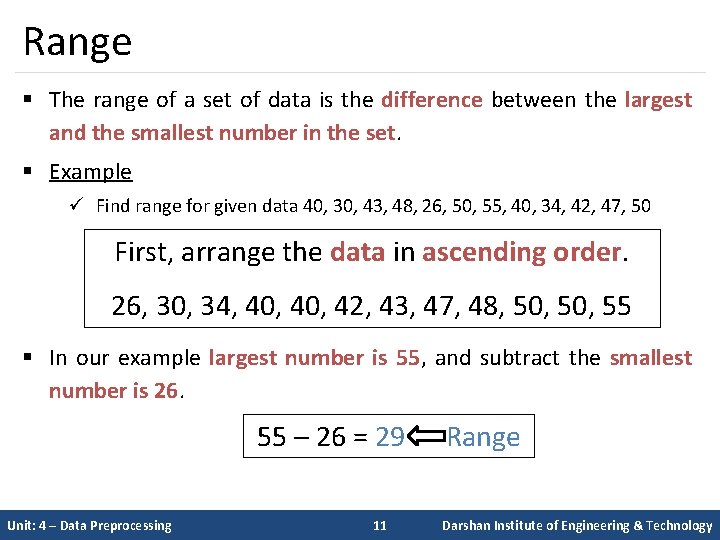
Range § The range of a set of data is the difference between the largest and the smallest number in the set. § Example ü Find range for given data 40, 30, 43, 48, 26, 50, 55, 40, 34, 42, 47, 50 First, arrange the data in ascending order. 26, 30, 34, 40, 42, 43, 47, 48, 50, 55 § In our example largest number is 55, and subtract the smallest number is 26. 55 – 26 = 29 Range Unit: 4 – Data Preprocessing 11 Darshan Institute of Engineering & Technology
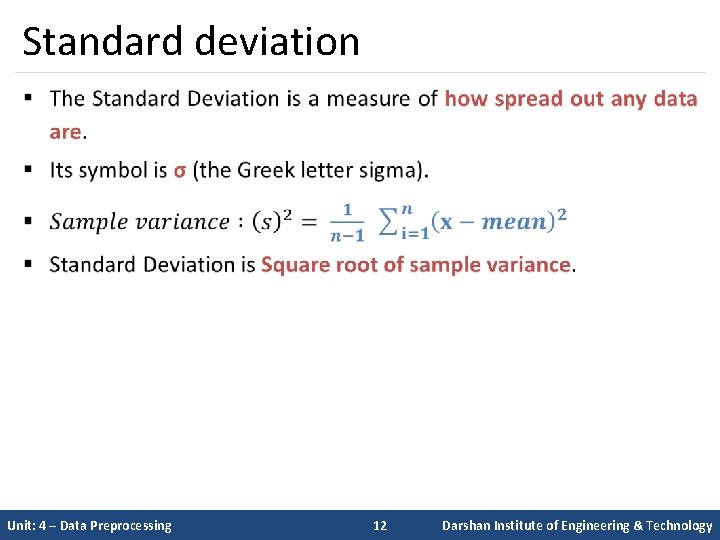
Standard deviation § Unit: 4 – Data Preprocessing 12 Darshan Institute of Engineering & Technology
Standard deviation (Cont. . ) § The Variance is defined as: The average of the squared differences from the Mean. To calculate the variance follow these steps: 1. Calculate the mean, x. 2. Write a table that subtracts the mean from each observed value. 3. Square each of the differences, add this column. 4. Divide by n -1 where n is the number of items in the sample, this is the variance (In actual case take n). 5. To get the standard deviation we take the square root of the variance. Unit: 4 – Data Preprocessing 13 Darshan Institute of Engineering & Technology
Standard deviation - example § The owner of the Indian restaurant is interested in how much people spend at the restaurant. § He examines 10 randomly selected receipts for parties and writes down the following data. 44, 50, 38, 96, 42, 47, 40, 39, 46, 50 1. Find out Mean (1 st step) ü Mean is 49. 2 2. Write a table that subtracts the mean from each observed value. (2 nd step) Unit: 4 – Data Preprocessing 14 Darshan Institute of Engineering & Technology
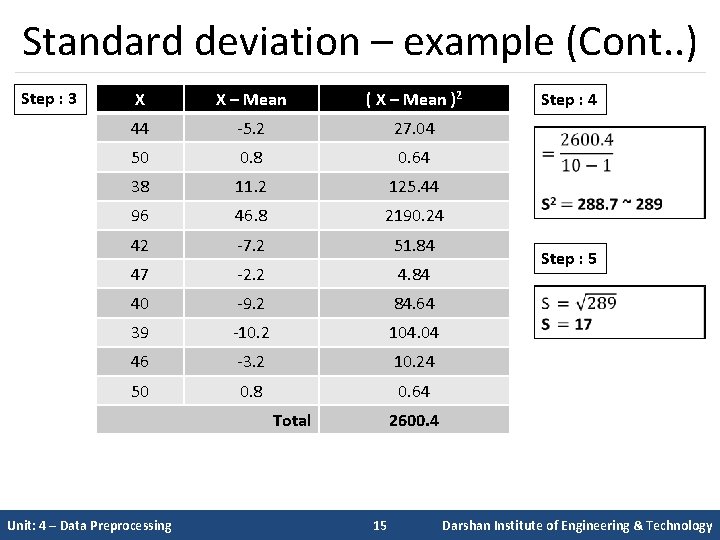
Standard deviation – example (Cont. . ) Step : 3 X X – Mean ( X – Mean )2 44 -5. 2 27. 04 50 0. 8 0. 64 38 11. 2 125. 44 96 46. 8 2190. 24 42 -7. 2 51. 84 47 -2. 2 4. 84 40 -9. 2 84. 64 39 -10. 2 104. 04 46 -3. 2 10. 24 50 0. 8 0. 64 Total Unit: 4 – Data Preprocessing Step : 4 Step : 5 2600. 4 15 Darshan Institute of Engineering & Technology
Standard deviation – example (Cont. . ) § Standard deviation can be thought of measuring how far the data values lie from the mean, we take the mean and move on standard deviation in either direction. § The mean for this example is 49. 2 and the standard deviation is 17. § Now, 49. 2 - 17 = 32. 2 and 49. 2 + 17 = 66. 2 § This means that most of the data probably spend between 32. 2 and 66. 2. § If all data are same then variance & standard deviation is 0 (zero). Unit: 4 – Data Preprocessing 16 Darshan Institute of Engineering & Technology
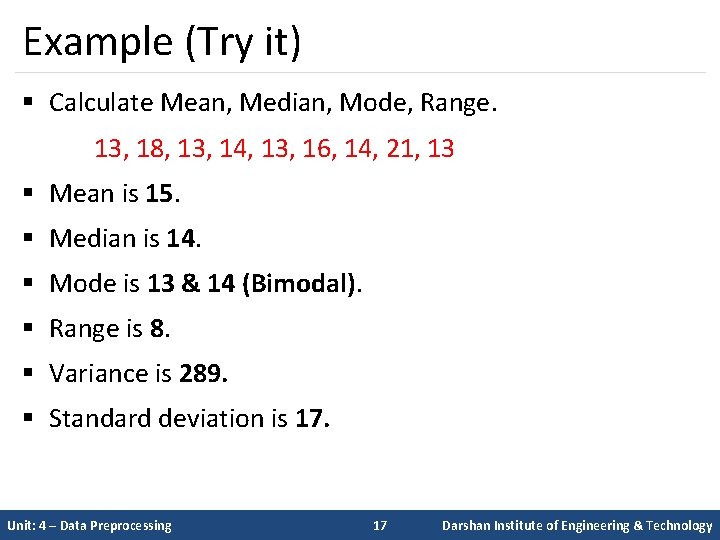
Example (Try it) § Calculate Mean, Median, Mode, Range. 13, 18, 13, 14, 13, 16, 14, 21, 13 § Mean is 15. § Median is 14. § Mode is 13 & 14 (Bimodal). § Range is 8. § Variance is 289. § Standard deviation is 17. Unit: 4 – Data Preprocessing 17 Darshan Institute of Engineering & Technology
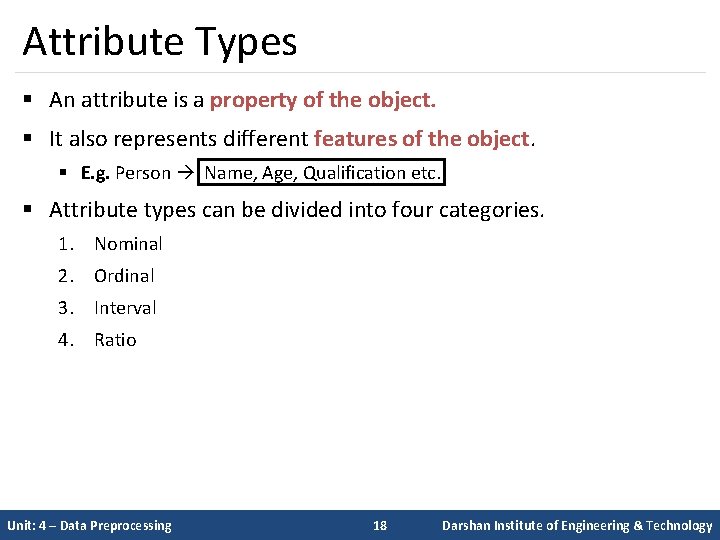
Attribute Types § An attribute is a property of the object. § It also represents different features of the object. § E. g. Person Name, Age, Qualification etc. § Attribute types can be divided into four categories. 1. Nominal 2. Ordinal 3. Interval 4. Ratio Unit: 4 – Data Preprocessing 18 Darshan Institute of Engineering & Technology
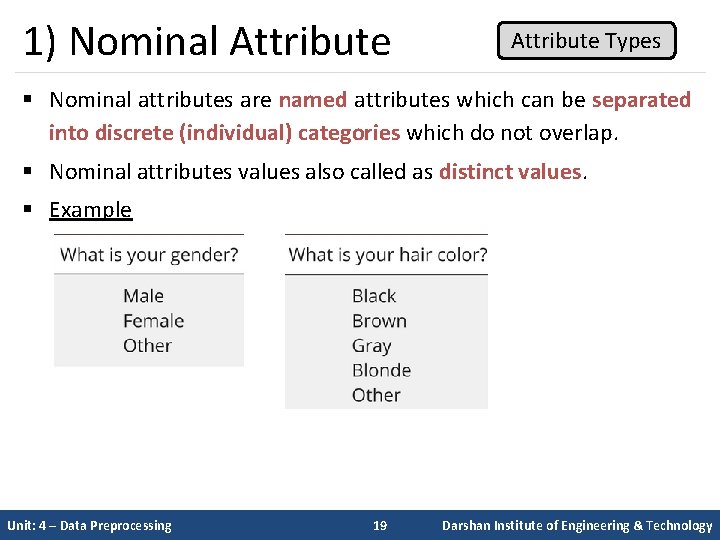
1) Nominal Attribute Types § Nominal attributes are named attributes which can be separated into discrete (individual) categories which do not overlap. § Nominal attributes values also called as distinct values. § Example Unit: 4 – Data Preprocessing 19 Darshan Institute of Engineering & Technology
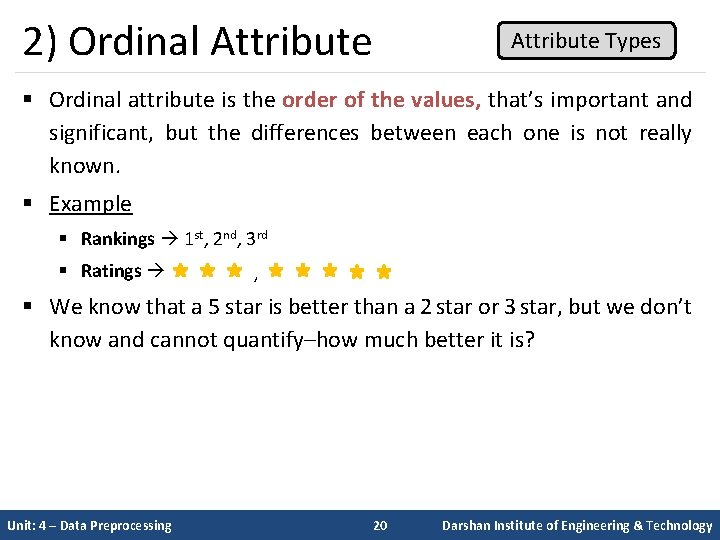
2) Ordinal Attribute Types § Ordinal attribute is the order of the values, that’s important and significant, but the differences between each one is not really known. § Example § Rankings 1 st, 2 nd, 3 rd § Ratings , § We know that a 5 star is better than a 2 star or 3 star, but we don’t know and cannot quantify–how much better it is? Unit: 4 – Data Preprocessing 20 Darshan Institute of Engineering & Technology
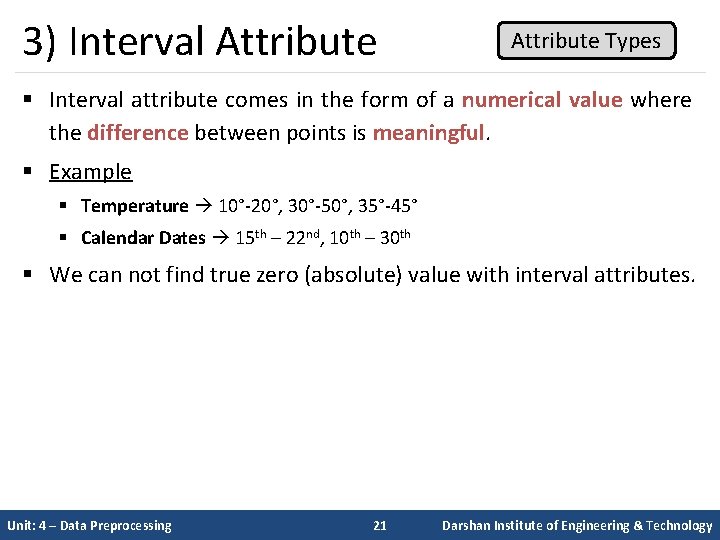
3) Interval Attribute Types § Interval attribute comes in the form of a numerical value where the difference between points is meaningful. § Example § Temperature 10°-20°, 30°-50°, 35°-45° § Calendar Dates 15 th – 22 nd, 10 th – 30 th § We can not find true zero (absolute) value with interval attributes. Unit: 4 – Data Preprocessing 21 Darshan Institute of Engineering & Technology
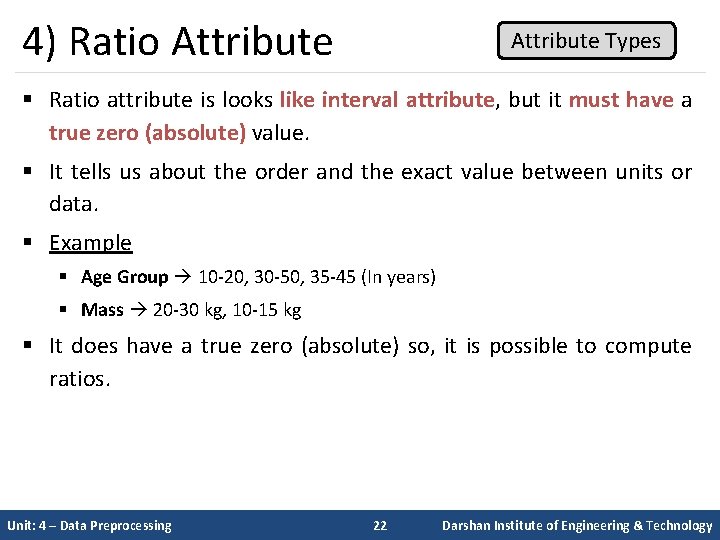
4) Ratio Attribute Types § Ratio attribute is looks like interval attribute, but it must have a true zero (absolute) value. § It tells us about the order and the exact value between units or data. § Example § Age Group 10 -20, 30 -50, 35 -45 (In years) § Mass 20 -30 kg, 10 -15 kg § It does have a true zero (absolute) so, it is possible to compute ratios. Unit: 4 – Data Preprocessing 22 Darshan Institute of Engineering & Technology
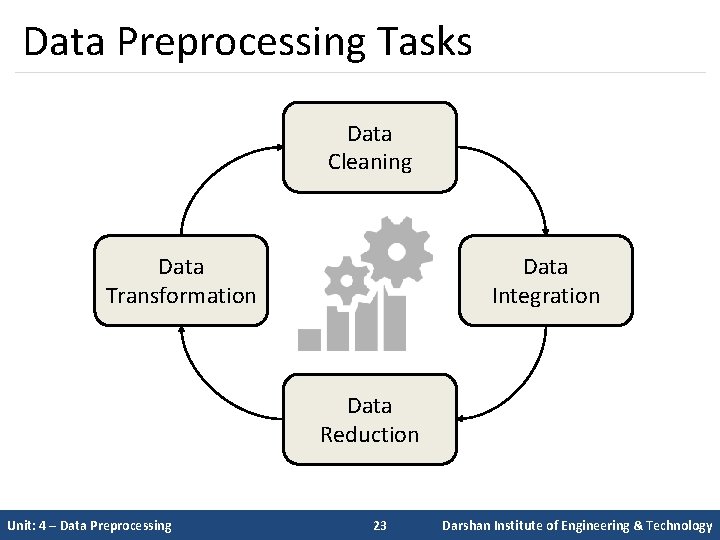
Data Preprocessing Tasks Data Cleaning Data Transformation Data Integration Data Reduction Unit: 4 – Data Preprocessing 23 Darshan Institute of Engineering & Technology
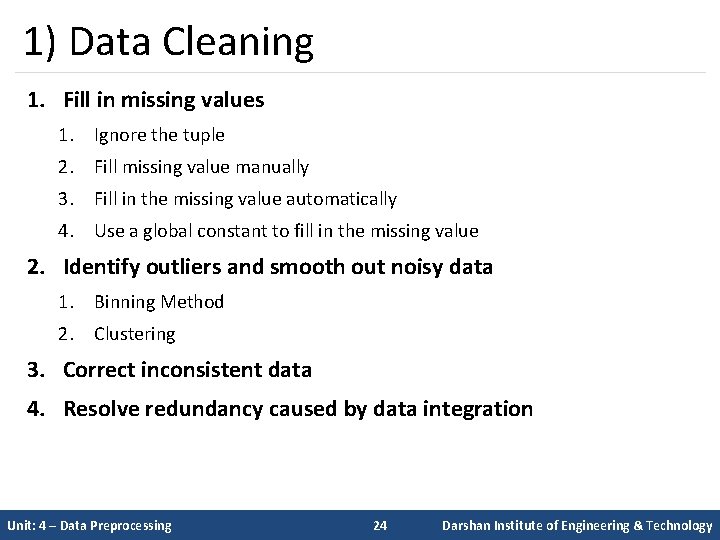
1) Data Cleaning 1. Fill in missing values 1. Ignore the tuple 2. Fill missing value manually 3. Fill in the missing value automatically 4. Use a global constant to fill in the missing value 2. Identify outliers and smooth out noisy data 1. Binning Method 2. Clustering 3. Correct inconsistent data 4. Resolve redundancy caused by data integration Unit: 4 – Data Preprocessing 24 Darshan Institute of Engineering & Technology
1) Fill missing values Data Cleaning § Ignore the tuple (record/row): • Usually done when class label is missing. • Example o The task is to distinguish between two types of emails, “spam” and “non-spam” (Ham). o Spam & non-spam are called as class label. o If an email comes to you, in which class label is missing then it is discarded. § Fill missing value manually: • Use the attribute mean (average) to fill in the missing value and also use the attribute mean (average) for all samples belonging to the same class. Unit: 4 – Data Preprocessing 25 Darshan Institute of Engineering & Technology
1) Fill missing values (Cont. . ) Data Cleaning § Fill in the missing value automatically: • Predict the missing value by using a learning algorithm: o Consider the attribute with the missing value as a dependent variable and run a learning algorithm (usually Naive Bayes or Decision tree) to predict the missing value. § Use a global constant to fill in the missing value • Replace all missing attribute values by the same constant such as a label like “Unknown”. Unit: 4 – Data Preprocessing 26 Darshan Institute of Engineering & Technology
2) Identify outliers and smooth out noisy data Data Cleaning 1. Binning method 2. Clustering Unit: 4 – Data Preprocessing 27 Darshan Institute of Engineering & Technology
1) Binning method § Data binning or bucketing is a data pre-processing technique used to reduce the effects of minor observation errors. § The original data values which fall in a given small interval called as a bin are replaced by a value which represents that interval, often called the central value. § Steps of Binning method 1. Sort the attribute values and partition them into bins. 2. Then smooth by bin means, bin median or bin boundaries. Unit: 4 – Data Preprocessing 28 Darshan Institute of Engineering & Technology
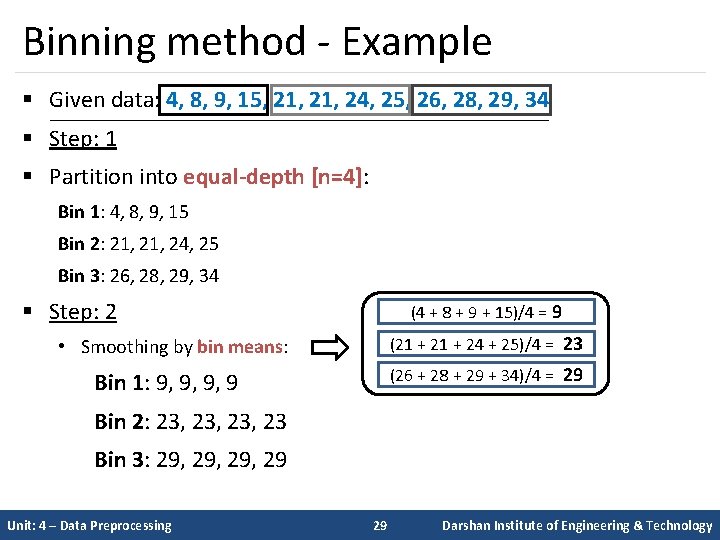
Binning method - Example § Given data: 4, 8, 9, 15, 21, 24, 25, 26, 28, 29, 34 § Step: 1 § Partition into equal-depth [n=4]: Bin 1: 4, 8, 9, 15 Bin 2: 21, 24, 25 Bin 3: 26, 28, 29, 34 § Step: 2 (4 + 8 + 9 + 15)/4 = 9 (21 + 24 + 25)/4 = 23 • Smoothing by bin means: (26 + 28 + 29 + 34)/4 = 29 Bin 1: 9, 9, 9, 9 Bin 2: 23, 23, 23 Bin 3: 29, 29, 29 Unit: 4 – Data Preprocessing 29 Darshan Institute of Engineering & Technology
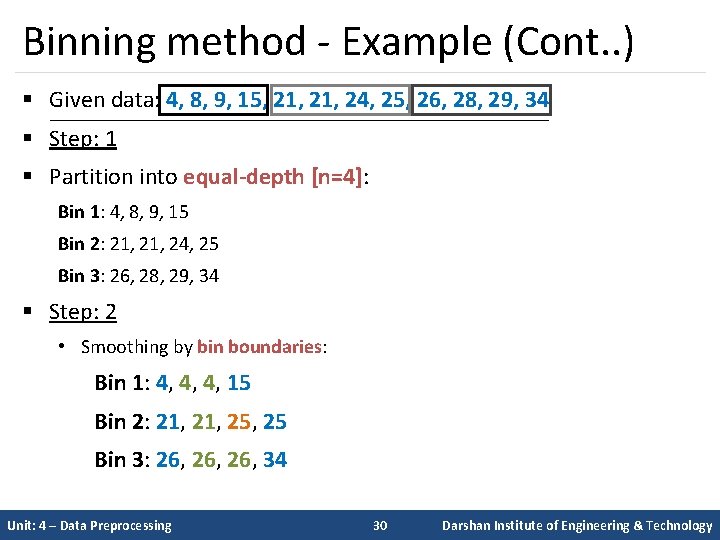
Binning method - Example (Cont. . ) § Given data: 4, 8, 9, 15, 21, 24, 25, 26, 28, 29, 34 § Step: 1 § Partition into equal-depth [n=4]: Bin 1: 4, 8, 9, 15 Bin 2: 21, 24, 25 Bin 3: 26, 28, 29, 34 § Step: 2 • Smoothing by bin boundaries: Bin 1: 4, 4, 4, 15 Bin 2: 21, 25, 25 Bin 3: 26, 26, 34 Unit: 4 – Data Preprocessing 30 Darshan Institute of Engineering & Technology
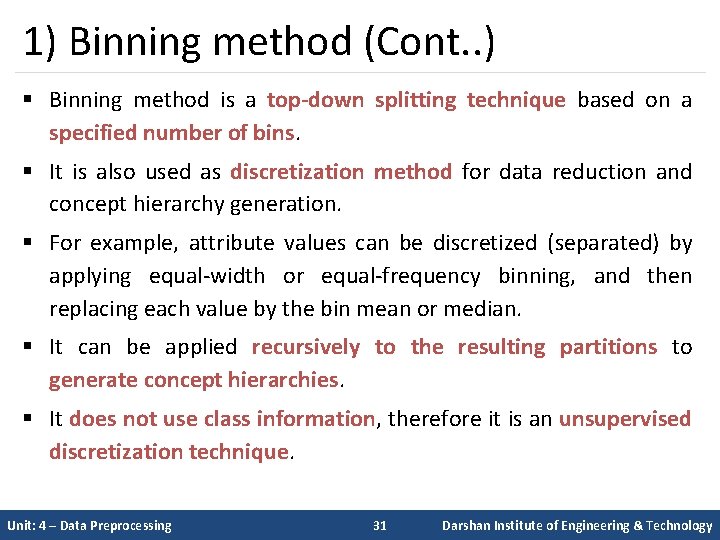
1) Binning method (Cont. . ) § Binning method is a top-down splitting technique based on a specified number of bins. § It is also used as discretization method for data reduction and concept hierarchy generation. § For example, attribute values can be discretized (separated) by applying equal-width or equal-frequency binning, and then replacing each value by the bin mean or median. § It can be applied recursively to the resulting partitions to generate concept hierarchies. § It does not use class information, therefore it is an unsupervised discretization technique. Unit: 4 – Data Preprocessing 31 Darshan Institute of Engineering & Technology
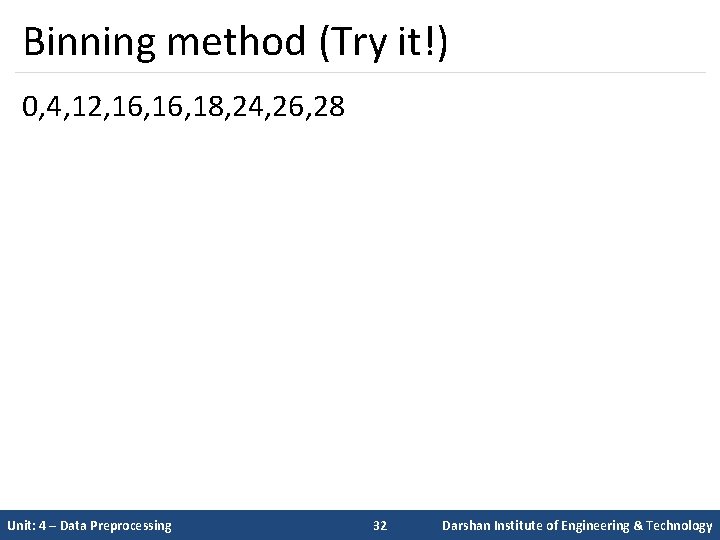
Binning method (Try it!) 0, 4, 12, 16, 18, 24, 26, 28 Unit: 4 – Data Preprocessing 32 Darshan Institute of Engineering & Technology
2) Clustering § Clustering is a process of partitioning a set of data (or objects) into a set of meaningful sub-classes, called clusters. § It enables the abstraction of large amounts data by forming meaningful groups or categories of objects. § In clustering, objects in the same cluster are similar to each other and those in different clusters are dissimilar. § Example • Library (Group of Books based on different categories) • Cloths (By size S, M, L, XXL etc. ) Unit: 4 – Data Preprocessing 33 Darshan Institute of Engineering & Technology
3) Correct inconsistent data Data Cleaning § If you have inconsistencies in your data, it can cause major problems later on. § But with larger datasets, it can be difficult to find all of the inconsistencies. § It contains similarity in codes or names. § We can manually solve common mistakes like spelling, grammar, articles or use other tools for it. Unit: 4 – Data Preprocessing 34 Darshan Institute of Engineering & Technology
4) Resolve redundancy caused by data integration Data Cleaning § Data redundancy occurs in database systems which have a field that is repeated in two or more tables. § When customer data is duplicated and attached with each product bought, then redundancy of data is known as inconsistency. § So, the entity "customer" might appear with different values. § Database normalization prevents redundancy and makes the best possible usage of storage. § The proper use of foreign keys can minimize data redundancy and reduce the chance of destructive anomalies appearing. Unit: 4 – Data Preprocessing 35 Darshan Institute of Engineering & Technology
Data Integration § Data integration involves combining data residing in different sources and providing users with a unified view of these all data. § In relational databases we also combine schemas like A. Customer. ID = B. Customer. ID. § In real world, attribute values from different sources are different. § Data Integration may involve inconsistent data and therefore needs data cleaning also. Unit: 4 – Data Preprocessing 36 Darshan Institute of Engineering & Technology
Data Transformation § Data transformation is the process of converting data from one form to another form. § Data often resides in different locations across the storage and also differs in format. § Data transformation is necessary to ensure that data from one application or database is understandable to other applications and databases also. Unit: 4 – Data Preprocessing 37 Darshan Institute of Engineering & Technology
Data Transformation (Cont. . ) § Data transformation strategies includes the following: 1. Smoothing 2. Attribute construction 3. Aggregation 4. Normalization 5. Discretization 6. Concept hierarchy generation for nominal data Unit: 4 – Data Preprocessing 38 Darshan Institute of Engineering & Technology
Data Transformation (Cont. . ) 1. Smoothing • It works to remove noise from the data. • It is a form of data cleaning where users specify transformations to correct data inconsistencies. • Such techniques include binning, regression and clustering. 2. Attribute construction • It is referred as new attributes are constructed and added from the given set of attributes to help the mining process. 3. Aggregation • In this, summary or aggregation operations are applied to the data. • E. g. Daily sales data are aggregated at individual source so sales manager can compute monthly and annually total amounts. Unit: 4 – Data Preprocessing 39 Darshan Institute of Engineering & Technology
Data Transformation (Cont. . ) 4. Normalization • Normalization is scaling technique or a mapping technique. • With normalization, we can find new range from an existing range. • There are three techniques for normalization. 1. Min-Max Normalization o This is a simple normalization technique in which we fit given data in a predefined boundary, or a pre-defined interval [0, 1]. 2. Decimal scaling o In this technique we move the decimal point of values of the attribute. Unit: 4 – Data Preprocessing 40 Darshan Institute of Engineering & Technology
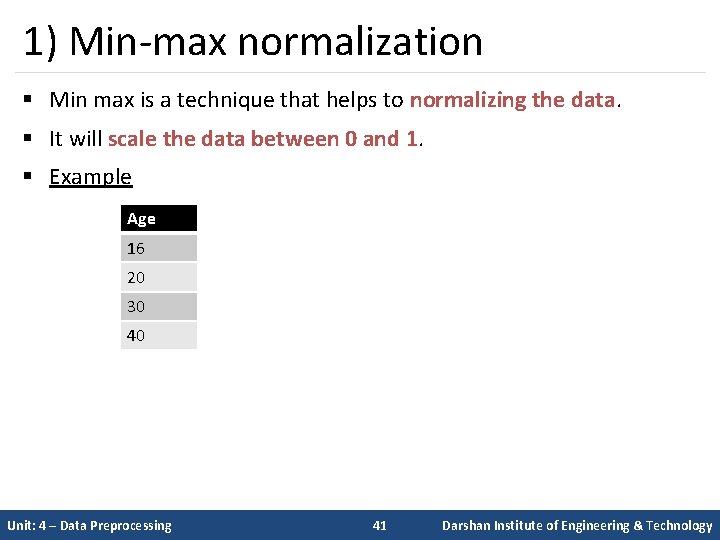
1) Min-max normalization § Min max is a technique that helps to normalizing the data. § It will scale the data between 0 and 1. § Example Age 16 20 30 40 Unit: 4 – Data Preprocessing 41 Darshan Institute of Engineering & Technology
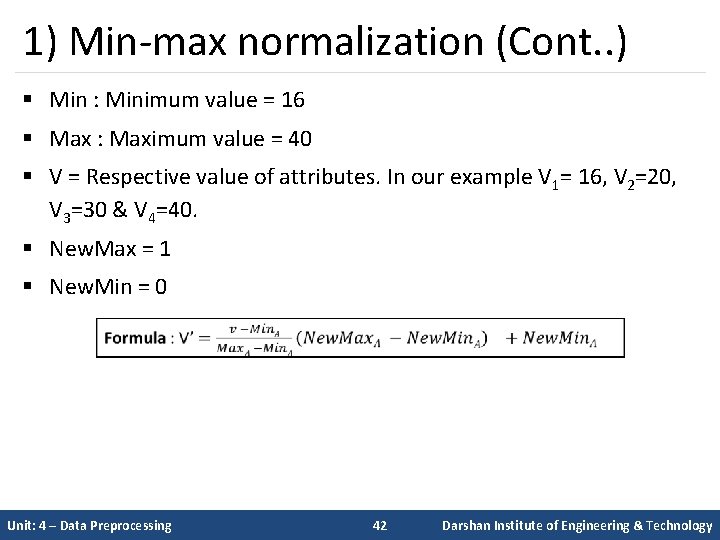
1) Min-max normalization (Cont. . ) § Min : Minimum value = 16 § Max : Maximum value = 40 § V = Respective value of attributes. In our example V 1= 16, V 2=20, V 3=30 & V 4=40. § New. Max = 1 § New. Min = 0 Unit: 4 – Data Preprocessing 42 Darshan Institute of Engineering & Technology
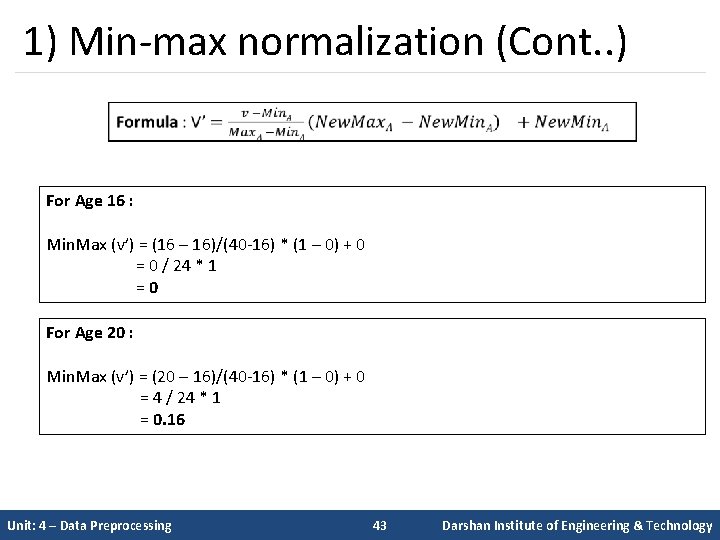
1) Min-max normalization (Cont. . ) For Age 16 : Min. Max (v’) = (16 – 16)/(40 -16) * (1 – 0) + 0 = 0 / 24 * 1 = 0 For Age 20 : Min. Max (v’) = (20 – 16)/(40 -16) * (1 – 0) + 0 = 4 / 24 * 1 = 0. 16 Unit: 4 – Data Preprocessing 43 Darshan Institute of Engineering & Technology
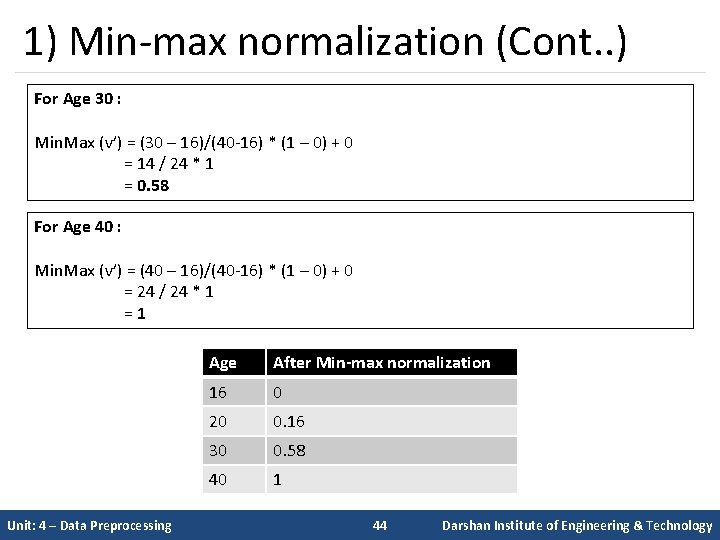
1) Min-max normalization (Cont. . ) For Age 30 : Min. Max (v’) = (30 – 16)/(40 -16) * (1 – 0) + 0 = 14 / 24 * 1 = 0. 58 For Age 40 : Min. Max (v’) = (40 – 16)/(40 -16) * (1 – 0) + 0 = 24 / 24 * 1 = 1 Unit: 4 – Data Preprocessing Age After Min-max normalization 16 0 20 0. 16 30 0. 58 40 1 44 Darshan Institute of Engineering & Technology
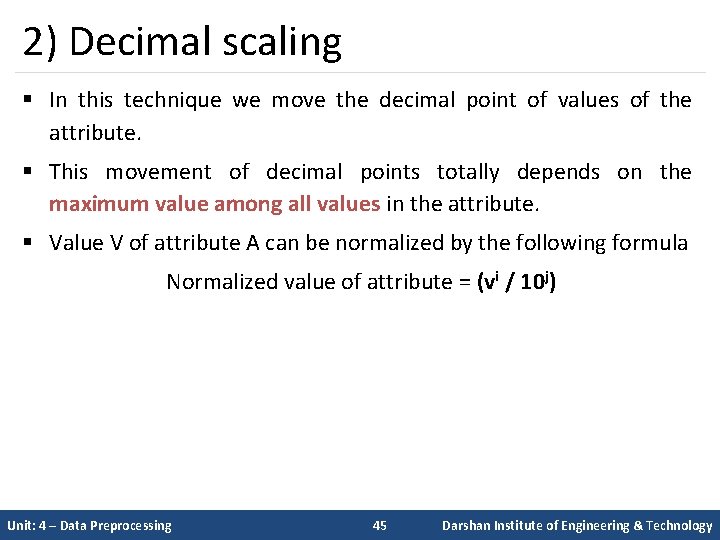
2) Decimal scaling § In this technique we move the decimal point of values of the attribute. § This movement of decimal points totally depends on the maximum value among all values in the attribute. § Value V of attribute A can be normalized by the following formula Normalized value of attribute = (vi / 10 j) Unit: 4 – Data Preprocessing 45 Darshan Institute of Engineering & Technology
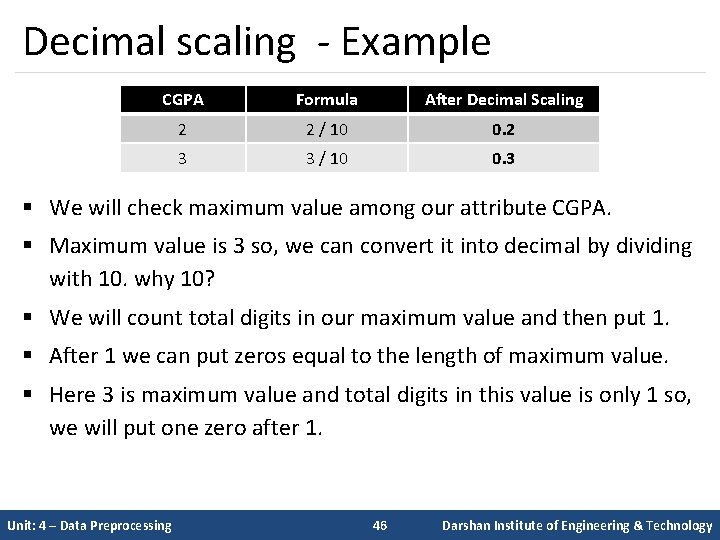
Decimal scaling - Example CGPA Formula After Decimal Scaling 2 2 / 10 0. 2 3 3 / 10 0. 3 § We will check maximum value among our attribute CGPA. § Maximum value is 3 so, we can convert it into decimal by dividing with 10. why 10? § We will count total digits in our maximum value and then put 1. § After 1 we can put zeros equal to the length of maximum value. § Here 3 is maximum value and total digits in this value is only 1 so, we will put one zero after 1. Unit: 4 – Data Preprocessing 46 Darshan Institute of Engineering & Technology
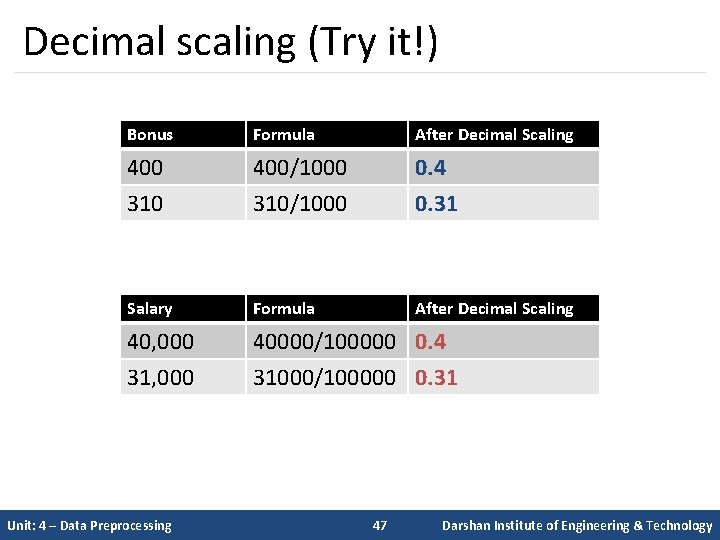
Decimal scaling (Try it!) Bonus Formula After Decimal Scaling 400/1000 0. 4 310/1000 0. 31 Salary Formula After Decimal Scaling 40, 000 31, 000 40000/100000 0. 4 31000/100000 0. 31 Unit: 4 – Data Preprocessing 47 Darshan Institute of Engineering & Technology
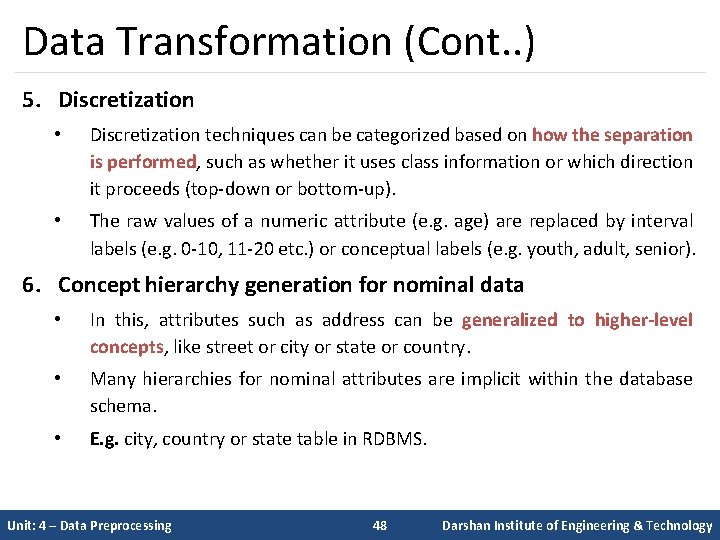
Data Transformation (Cont. . ) 5. Discretization • Discretization techniques can be categorized based on how the separation is performed, such as whether it uses class information or which direction it proceeds (top-down or bottom-up). • The raw values of a numeric attribute (e. g. age) are replaced by interval labels (e. g. 0 -10, 11 -20 etc. ) or conceptual labels (e. g. youth, adult, senior). 6. Concept hierarchy generation for nominal data • In this, attributes such as address can be generalized to higher-level concepts, like street or city or state or country. • Many hierarchies for nominal attributes are implicit within the database schema. • E. g. city, country or state table in RDBMS. Unit: 4 – Data Preprocessing 48 Darshan Institute of Engineering & Technology
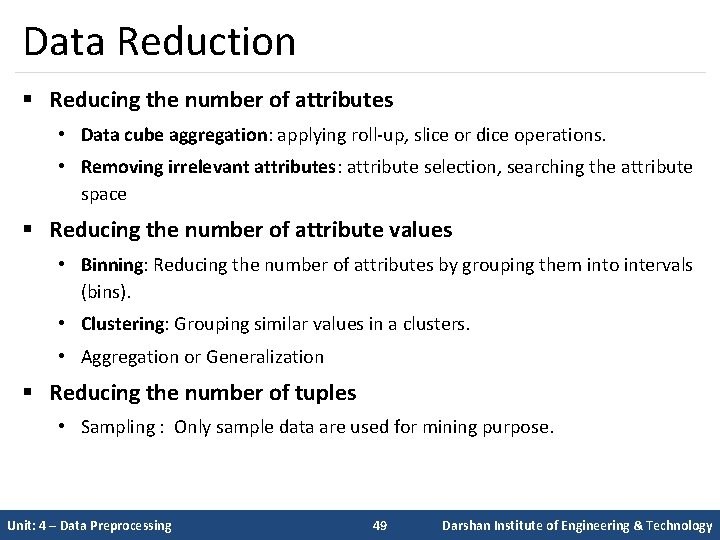
Data Reduction § Reducing the number of attributes • Data cube aggregation: applying roll-up, slice or dice operations. • Removing irrelevant attributes: attribute selection, searching the attribute space § Reducing the number of attribute values • Binning: Reducing the number of attributes by grouping them into intervals (bins). • Clustering: Grouping similar values in a clusters. • Aggregation or Generalization § Reducing the number of tuples • Sampling : Only sample data are used for mining purpose. Unit: 4 – Data Preprocessing 49 Darshan Institute of Engineering & Technology
Data mining task primitives § A data mining task can be specified in the form of a data mining query, which is input to the data mining system. § A data mining query is defined in terms of data mining task primitives. § These primitives allow the user to inter-actively communicate with the data mining system during discovery of knowledge. Unit: 4 – Data Preprocessing 50 Darshan Institute of Engineering & Technology
Data mining task primitives (Cont. . ) § The data mining task primitives includes the following: • Task-relevant data • Kind of knowledge to be mined • Background knowledge • Interestingness measurement • Presentation for visualizing the discovered patterns Unit: 4 – Data Preprocessing 51 Darshan Institute of Engineering & Technology
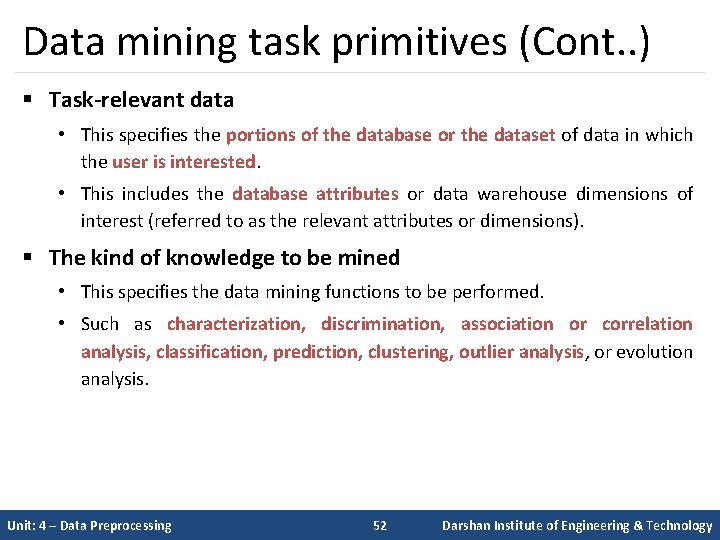
Data mining task primitives (Cont. . ) § Task-relevant data • This specifies the portions of the database or the dataset of data in which the user is interested. • This includes the database attributes or data warehouse dimensions of interest (referred to as the relevant attributes or dimensions). § The kind of knowledge to be mined • This specifies the data mining functions to be performed. • Such as characterization, discrimination, association or correlation analysis, classification, prediction, clustering, outlier analysis, or evolution analysis. Unit: 4 – Data Preprocessing 52 Darshan Institute of Engineering & Technology
Data mining task primitives (Cont. . ) § The background knowledge to be used in the discovery process • The knowledge about the domain is useful for guiding the knowledge discovery process for evaluating the interesting patterns. • Concept hierarchies are a popular form of background knowledge, which allow data to be mined at multiple levels of abstraction. • An example of a concept hierarchy for the attribute (or dimension) age is shown in user beliefs regarding relationships in the data are another form of background knowledge. Unit: 4 – Data Preprocessing 53 Darshan Institute of Engineering & Technology
Data mining task primitives (Cont. . ) § The interestingness measures and thresholds for pattern evaluation § Different kinds of knowledge may have different interestingness measures. § For example, interestingness measures for association rules include support and confidence. § Rules whose support and confidence values are below user-specified thresholds are considered uninteresting. § The expected representation for visualizing the discovered patterns • It refers to the discovered patterns are to be displayed, which may include rules, tables, charts, graphs, decision trees, and cubes. • A data mining query language can be designed to incorporate these primitives, allowing users to flexibly interact with data mining systems. Unit: 4 – Data Preprocessing 54 Darshan Institute of Engineering & Technology

- Slides: 55