Data and Analytics that InHouse Counsel are Watching


![Am Law 200 Revenue Share Chart Title 65 [VALUE]% 60 55 [VALUE]% 50 45](https://slidetodoc.com/presentation_image_h2/040601e3e437d1e36de771d748e05016/image-4.jpg "Am Law 200 Revenue Share Chart Title 65 [VALUE]% 60 55 [VALUE]% 50 45")


 (Open) (Closed) Latest Survey Eff.")


- Slides: 45
Data and Analytics that In-House Counsel are Watching…. …. And How To Drive Revenue Patrick Fuller Director of Legal Analytics ELM Solutions Legal Analytics
How did we get to this point? 2
Revenue Disparity $2 600 000 $2 200 000 $2 521 500 000 $1 800 000 104% $1 400 000 $1 232 000 $1 000 000 2003 2004 2005 2006 2007 2008 2009 2010 2011 2012 2013 2014 2015 Revenue Disparity 3
Am Law 200 Revenue Share Chart Title 65 [VALUE]% 60 55 [VALUE]% 50 45 [VALUE]% 40 [VALUE]% 35 30 2003 2004 2005 2006 2007 2008 Top 50 Revenue Share 2009 2010 2011 2012 2013 2014 2015 Bottom 150 Revenue Share 4
Revenue / RPL-PPEP Rank Disparity Metric § Disparity Score = (Revenue Rank – RPL Rank) + (Revenue Rank – PPEP Rank) § Bottom 20 Firms § Average score: -180. 9 § Average Am Law Rank: 49 § Average Firm Size: 1652 § Top 20 Firms § Average score: 182. 2 § Average Am Law Rank: 157 § Average Firm Size: 183 5
Am Law 200 Revenue, 2003 - Present Total Revenue $115 000 000 000 $100 357 578 154, 00 $95 000 000 $85 000 000 $75 000 000 $65 000 000 $55 000 000 000 $49 981 000, 00 2003 2004 2005 2006 2007 2008 2009 2010 2011 2012 2013 2014 2015 Sources: Copyright 2003 -2015, Deductive Intelligence Group, LLC and American Lawyer Media, Inc. 6
The Numbers: Am Law 200 Comparison Revenue Growth, 2003 - 2015 140% 120% 100% 80% 131% 60% 111% 101% 40% 80% 20% 37% 0% Am Law 200 MLB Am Law 200 NBA MLB NBA NFL Fortune 500 Sources: Copyright 2003 -2015, Deductive Intelligence Group, LLC, American Lawyer Media, Inc. , & Statista. com 7
Benchmarking
Benchmarking – Corporate Legal Departments 9
Benchmarking of Phase Execution Amongst Firms The Client’s top 5 outside counsel firms – Product Liability Benchmark data from The Legal. VIEW Database, showing both Tier 1 & 2 markets for Am Law 1 -25 & 1 -100 groupings. This is an example of benchmarking Phase execution & spend concentration amongst firms for a selected practice area(s), market, and/or Industry. 10
Rates vs. Region Litigation Timekeeper Am. Law 100 Am. Law 200 Unranked Firms Partners $685 $486 $335 Associates $465 $304 $241 • • • General Commercial Litigation Matters All Industries 750 -1100 Billed Hours Timekeeper Am. Law 100 Am. Law 200 Unranked Firms Partners $566 $371 $302 Associates $339 $234 $201 confidential
Rates vs. Region Timekeeper Am. Law 100 Partners $840 $552 $561 Associates $500 $342 $391 Non-Litigation • • • Am. Law Unranked 200 Firms General Corporate Matters All Industries 750 -1100 Billed Hours Timekeeper Am. Law 100 Am. Law 200 Unranked Firms Partners $604 $412 $354 Associates $356 $247 $226 confidential
Metrics
What Is Measured A Sampling of Metrics Management • • • • • Legal spend month over month Amount of Invoices Flagged vs. Submitted by Vendor Matter spend by duration Legal spend breakdown by practice area Open to close ratio–month over month Top matters by spend Top vendors by spend Legal Department budget to actual Billed rate by role–year over year Practice area blended rate–year over year Total spend by vendor Rate review & comparison Top firms by evaluation Ratio of low to high severity cases % of matters with budget % of matters with assessment Avg Matter cost w/ budget vs. no budget • • • • % of matters handled via AFAs AFA Savings By Initiative / Type / Vendor AFA Adjustments By Vendor / Type / Practice Firm staffing by Matter / Practice / TK TK hours by phase Average Role Rate vs. Average Billed Rate Top Roles By Fee Top Roles by % of Hours Billed Top TK by Hours / Spend TK Rates By Role By Vendor By Practice By Business Unit Diversity % to Actual by Firm Diversity % to Actual by Practice Area by Firm Leverage to Actual by firm Leverage to Actual by Firm by Practice Area Diversity Allocation % by Firm Diversity Allocation by TK Role by Firm by Matter by Exposure Amount confidential
Dashboards Sample Data. For Illustrative Purposes Only.
Interactive Dashboards Legal Department Metrics Sample Data. For Illustrative Purposes Only.
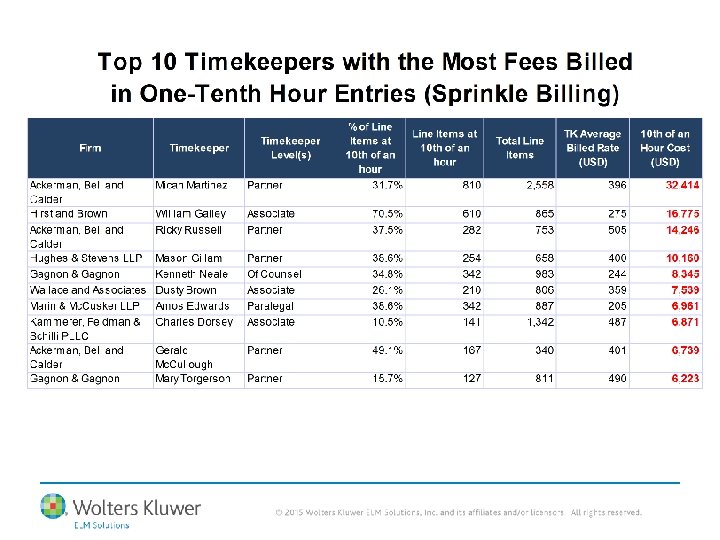
• Assuming the excess (i. e. the number of entries exceeding 20% of all entries) upbilled entries overstate time by 15 minutes per entry, the fees generated by the excess entries are projected in the final column, “Estimated Upbilling Cost. ”
Looking across all law firms, this report identifies those ten individuals who most often use identical language in two or more invoice line item entries to describe work performed.
Looking across all matters, this report identifies those ten individuals who bill the most fees for work performed over the weekend. It identifies the fees, hours and percent of hours billed for work performed on Saturdays and Sundays.
• • Block billing is the practice of including within one invoice line item entry, more than one type of task. This practice should be disallowed for two principal reasons: • The time spent per task is not displayed, making an evaluation the reasonableness of time spent per task impossible. • Most often, the UTBMS Task Code applied is inaccurate relative to one more of the tasks described.
• • • That percentage is calculated as the number of days in which more than 10 hours was billed (“ 10+ Hour Days of Service”), divided by the number of days billed (“Total Days of Service”). Ten hour days are often justified, but certain timekeepers will sometimes include “hollow” or unproductive hours for the day, e. g. a paralegal who bills 12 hours for a trial day, during which day the paralegal is “on call” throughout the day, but is not actively working on trial tasks. Only hours ABOVE the 10 th hour per day are counted towards the “Cost of 10+ Daily Hours” figure.
Promoted Timekeepers – Task Analysis
Matter Level Reporting Top Ten Timekeepers by Hours Billed to XYZ Matter, 2014 Firm Attorney Role Pearson Specter Rachel Zane Legal Assistant Pearson Specter Louis Litt Pearson Specter Total Hours Fees Rate 3528 $1, 129, 088. 00 $320. 00 Partner 3082 $2, 342, 168. 00 $760. 00 Harvey Specter Partner 2987 $2, 383, 755. 00 $865. 00 Pearson Specter Mike Ross Partner 2983 $2, 341, 498. 00 $785. 00 Pearson Specter Jessica Pearson Partner 2926 $2, 325, 852. 00 $795. 00 Kenner Bach Arthur Edens Partner 2699 $2, 240, 004. 00 $830. 00 Kenner Bach Bridget Klein Paralegal 2900 $565, 559. 00 $195. 00 Kenner Bach Barry Grissom Partner 2678 $2, 089, 074. 00 $780. 00 Infeld Daniels Stanton Infeld Partner 2677 $2, 744, 950. 00 $1, 025. 00 Infeld Daniels Damien Karp Partner 2643 $2, 275, 474. 00 $860. 00 24
Analyses of Rachel Zane’s 2014 Billing Tendencies
End of Matter Evaluations
End of Matter Evaluations
Sample Evaluation Criteria § Quality of Legal Work § § § Experience / Expertise Creative solutions to legal issues Achieves business goals / needs § Billing Practices § § § Fees consistent with expectations Timely invoice submittal Billing guideline compliance Work product not excessive or overdone Flexible / creative billing arrangement Efficient staffing of matter § Timeliness of Service / Comm. § Proactive communication of schedules, time, & fee estimates § Matter / Case Management § § § Responsiveness to inquiries, calls, emails Timely updates to significant developments Adherence to agreed strategy § § Effective staffing of matter Organization & planning § Budget Adherence § § § Effectively manages matter to a budget Accuracy of initial budget Frequency of budget updates § Effective Relationship Partner § § § RP conducts quality control of invoices prior to submittal to company RP monitors appropriate staffing of the matters Proactive and effective communication regarding the matter § Would you hire firm / attorney again?
Law Firm Evaluations Law Firm # of Matters (All) (Open) (Closed) Latest Survey Eff. / Process Legal Expert Date Mgmt # of Eval. Resp. / Comm. Pred. Costs/ Budget. Skills Results Deliver / Exec. Understands Obj. / Expect. Overall % Possibility of using Firm Again (1=Poor to 5=Excellent) Law Firm A 360 330 30 3 3/27/13 2. 0 2. 7 3. 0 1. 3 1. 7 2. 2 67% Law Firm B 174 145 29 3 12/13/12 3. 3 3. 0 3. 3 3. 2 100% Law Firm C 107 60 51 7 12/13/12 3. 0 3. 0 100% Law Firm D 12 9 3 1 5/21/13 3. 0 3. 0 100% Law Firm E 13 4 9 1 5/22/13 4. 0 3. 7 0% Law Firm F 233 155 82 3 5/22/13 2. 7 3. 0 2. 7 3. 7 2. 9 33% Law Firm G 184 169 15 3 4/9/13 4. 0 5. 0 4. 7 3. 0 4. 3 100% Law Firm H 31 7 24 2 5/22/13 3. 0 2. 5 2. 8 50% Law Firm I 60 26 35 1 5/22/13 3. 0 3. 0 100%
Core Elements of Business Development
Three Types of BD Demand Known Demand Reactive Demand Unknown Demand
Modern Demand Creation • Modern Day Blue Ocean Strategy • Focused on profitability, not cost • Also referred to prospects as “probable purchasers” • Continued to develop competitive edge
It’s Not Who You Know…. …. It’s Who Knows You
Create Visibility § The address book, rolodex, contacts folder, etc. are all finite. § Thought Leadership is a key way to create differentiation from competitors § Writing & Speaking helps to underscore expertise § Use visibility strategies – through writing, speaking, etc. - to create demand § Shorten The BD Process
Are You Learning…. …As Fast As Your Client’s World Is Changing?
Complexity § The client’s environment is changing daily § The Business is becoming more involved in CLD Operations § The role of CLO / GC continues to broaden § Greater increase in corporate governance, risk management, and key stakeholders § The best leaders and innovators have the widest field of vision § The most successful learners are not loners § “We hire attorneys who know our business and our industry” § Client & Industry Teams are driving this focus in many firms
People’s Buying Decisions Are Driven By Emotion…. …And Justified By Logic
Driving Buying Decisions § Two data sources that are unique to every firm § Emotion: Relationships § Logic: Experience § Corporations are branded by Advertising – Law Firms are branded by Experience § Why Experience is critical for smaller firms… § Are you the “most” of anything? § Let your experience – and success – work for you. § What’s more important initially – to be liked or trusted? § People buy from people they like, but…. § Belief drives passion, and mediocrity is derived more from lack of belief rather than lack of skill § Hunters v. Farmers?
Guiding The Pitch I D E A Inform Differentiate Emotion Action Guiding Question: What do we want the prospect to know? Guiding Question: What do we offer that is unique from our competitors? Guiding Question: What do we want the prospect to feel? What do we want the prospect to do?
How Can Firms Leverage This Intelligence?
Transforming the Business of Law The Corporate Mandate • Streamline legal operations & control costs • Improve efficiencies by looking at all the components that impact the law department budget • Measure metrics and benchmark performance data to identify VALUE delivered by outside counsel • Seek Predictability & Transparency • Performance visibility across the business • Clearly define “success”
What Law Firms Can Do § Ask the right questions to the right people § What’s a win? § How are we being evaluated? § What metrics are you measuring? § Collaborate – both internally and with the CLD § Invest in LPM § Incent & measure efficiency § Sell the efficiency metrics § Use the data being collected to facilitate predictability and transparency § Understand the market - benchmark 42
Why They Buy It’s not about selling, it’s about buying § Ditch the “Needs Analysis” § If there is no perception of differentiation or derived value, price will matter. § Pricing Architecture & Predictability – not the lowest cost – can be a differentiator. § The Three E’s remain critical § Experience § Do you have experience in similar matters? § Will your experience help you see problems early? § Does your experience translate to budget predictability? § Efficiency § § Does your experience in similar matters result in greater efficiencies? Are you making efficient use of your best resources? Are you investing in process improvement? How are you measuring & tracking efficiency? § Effectiveness § Results and quality of the work product. confidential
It’s no longer the big that eat the small. It’s the fast that eat the slow. 44
45