
Chapter 19 Social Network Analytics and Big Data
Chapter 19 – Social Network Analytics (and Big Data) DM for Business Analytics (3 rd ed. )
2000’s: The advent of businesses based on social network data • Early movers: Friendster, Myspace • Later: Facebook, Linked. In, Twitter, Tumblr, Instagram, Yelp, Trip. Advisor, … • Common element: Data on their network of users is the main business asset
SNA and Big Data What is Big Data and why is it “Big? ” 4 V’s. . . 1. Volume – lots, and lots of data 2. Velocity – fast accumulation of data (from many sources) 3. Variety – different types of data (i. e. , Structured and Unstructured) 4. Veracity – truthfulness of data must be questioned (e. g. , Fake News) Sometimes 5 th V. . . � Very Expensive – expensive to store and analyze (for now)
An undirected network (e. g. who is friends with whom on Facebook) Edge (link, connection) Node (vertex)
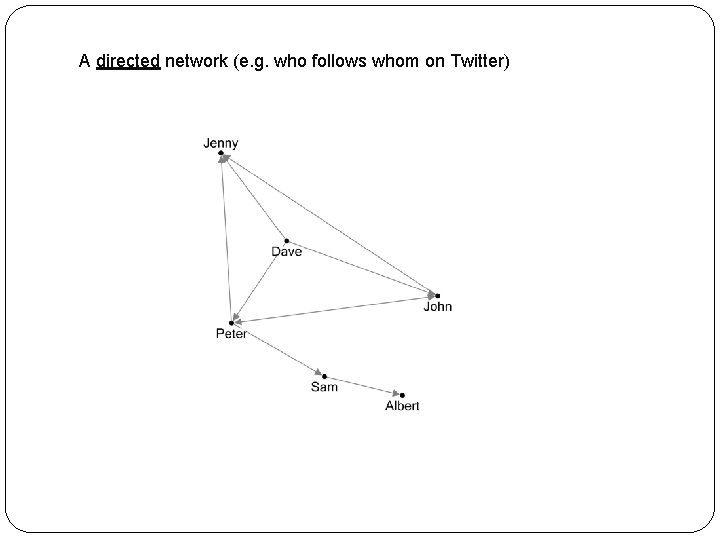
A directed network (e. g. who follows whom on Twitter)
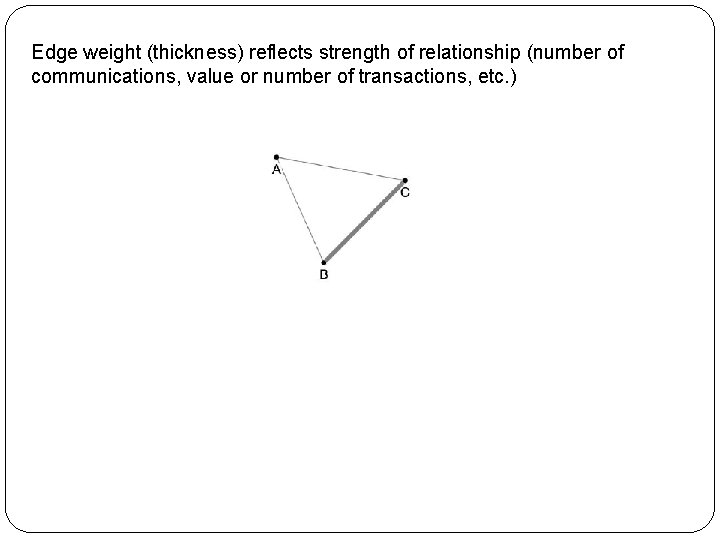
Edge weight (thickness) reflects strength of relationship (number of communications, value or number of transactions, etc. )
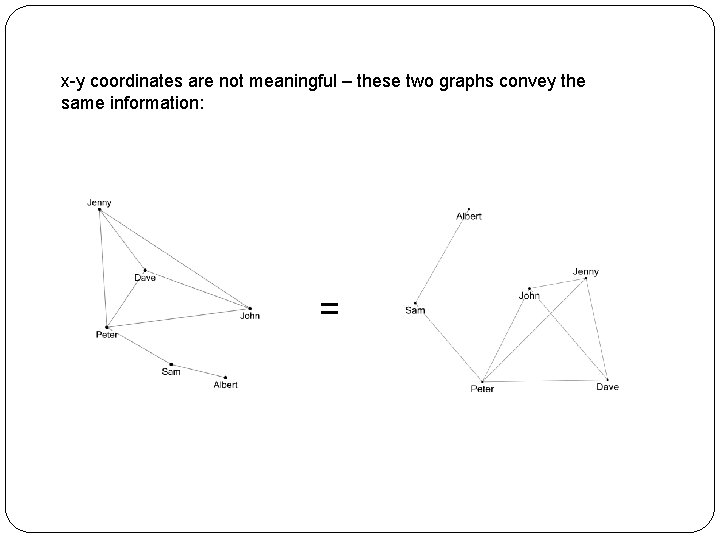
x-y coordinates are not meaningful – these two graphs convey the same information: =
Principles of graph layout: • Every node should be visible • For every node, you should be able to count its degree • For every link, you should be able to follow it from source to destination • Clusters and outliers should be identifiable
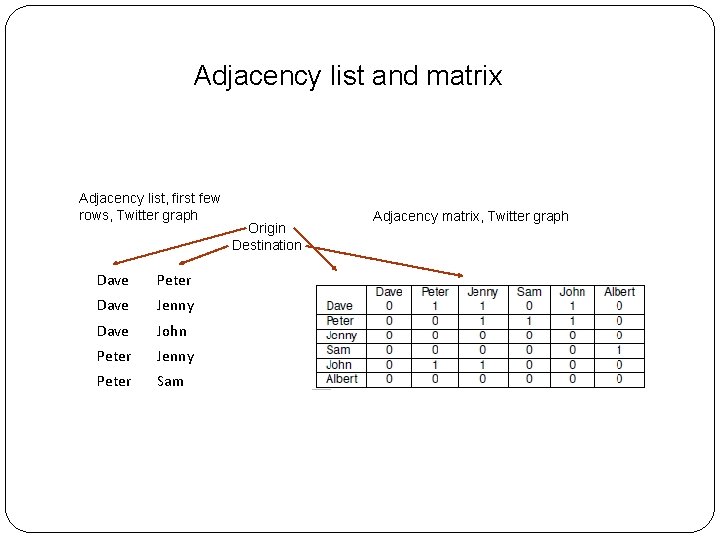
Adjacency list and matrix Adjacency list, first few rows, Twitter graph Dave Peter Dave Jenny Dave John Peter Jenny Peter Sam Origin Destination Adjacency matrix, Twitter graph
Terms Edge weight: strength of relationship Path (and path length): route from one node to another Connected network: each node has a path to all others Clique: each node directly connected by single edge to each other Singleton: unconnected node Degree: number of connections to a node
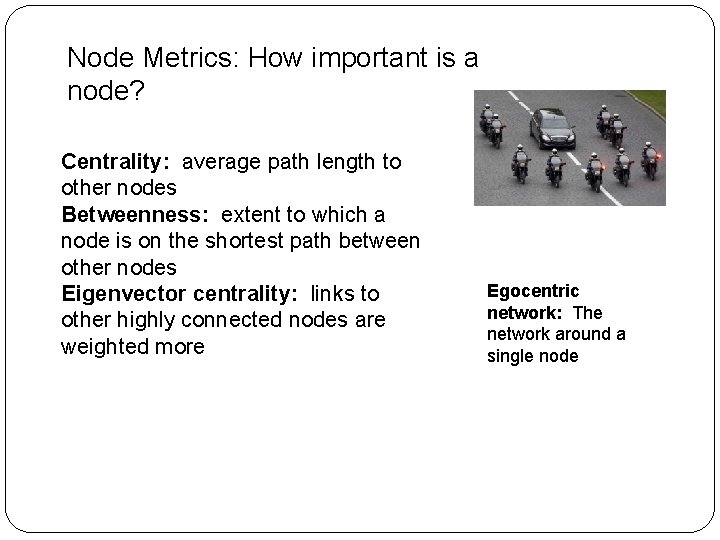
Node Metrics: How important is a node? Centrality: average path length to other nodes Betweenness: extent to which a node is on the shortest path between other nodes Eigenvector centrality: links to other highly connected nodes are weighted more Egocentric network: The network around a single node
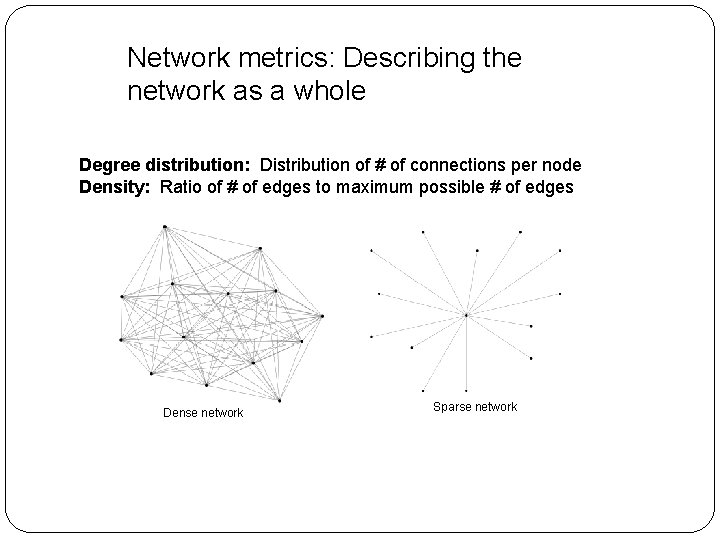
Network metrics: Describing the network as a whole Degree distribution: Distribution of # of connections per node Density: Ratio of # of edges to maximum possible # of edges Dense network Sparse network
Link Prediction: Predicting the next link to form in a network 1. For each node, score similarity to all other nodes 2. Traditional predictive model variables could be used (e. g. demographic info) to calculate similarity [see nearestneighbor methods] 3. Network metrics (shortest path, etc. ) can also be used 4. The unlinked pair with highest similarity score is predicted next link
Similar methods can be used in entity resolution (is “x” the same person as “y”)? A new customer orders online: is the person already in the customer database? A cell phone number is linked to known terrorists: is its owner the same person as a suspect known to a partner intelligence service?
- Slides: 14