Course Title Financial Statement Analysis Course Code MGT537


 Required: a. Calculation the operating ratio and comment on the results")

 Required: a. Calculate the following for 2004, 2003, and 2002 1.")


 Ratios Current Ratio Lecture 11 29")


 • The return on investment applied to ratios measuring the")


- Slides: 65
Course Title: Financial Statement Analysis Course Code: MGT-537 Course Instructor: Dr. Hafiz Muhammad Ishaq Total Lectures: 32
Previous Lecture Summary Statement Analysis for Special Industries: Ø Practical Questions
Today's Lecture Topics Statement Analysis for Special Industries: Ø Practical Questions Ø Ratios Discussed in Lecture 10 Ø Ratios Discussed in Lecture 11 Ø Ratios Discussed in Lecture 13 Ø Ratios Discussed in Lecture 14 Ø Ratios Discussed in Lecture 15 Ø Ratios Discussed in Lecture 16 Ø Ratios Discussed in Lecture 17 Ø Ratios Discussed in Lecture 18 Ø Ratios Discussed in Lecture 19 Ø Ratios Discussed in Lecture 20 Ø Ratios Discussed in Lecture 21 Ø Ratios Discussed in Lecture 25
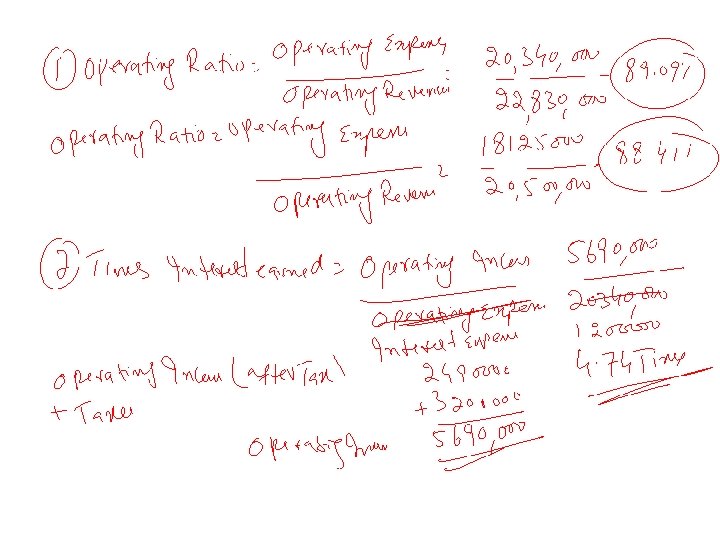
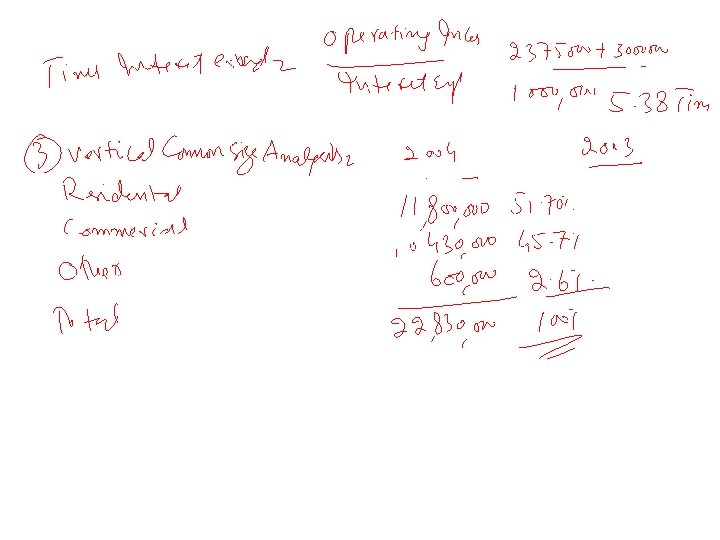
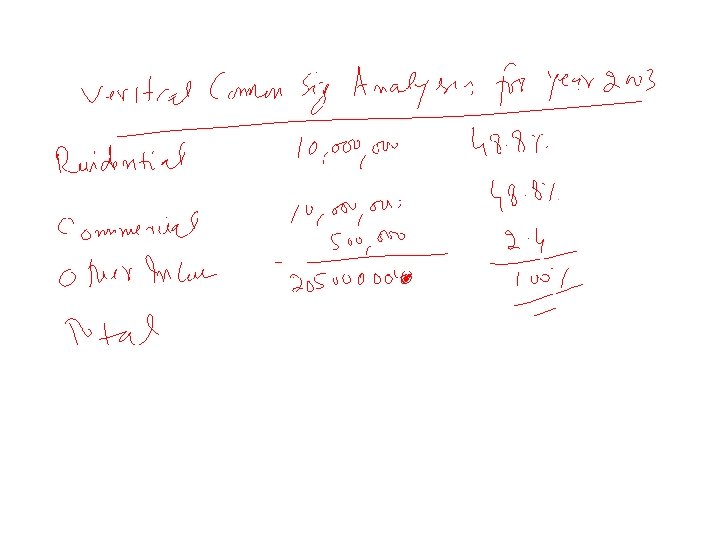
Practical Exercise Super power Company reported the following statistics in its statements of income 2004 2003 Electric revenues: Residential $11, 800, 000 $10, 000 Commercial and industrial $10, 430, 000 $10, 000 Other $ 600, 000 $ 500, 000 $22, 830, 000 $20, 500, 000 Operating expenses and taxes $20, 340, 000 $18, 125, 000 Operating income $ 2, 490, 000 $ 2, 375, 000 Other income $ 200, 000 $ 195, 000 Income before interest deductions $2, 690, 000 $2, 570, 000 Interest deductions $1, 200, 000 $1, 000 Net income $1490, 000 $1, 000 *includes taxes of $3, 200, 000 in 2004 and $3, 000 in 2003
Practical Exercise (Cont’d) Required: a. Calculation the operating ratio and comment on the results b. Calculate the times interest earned and comment on the results c. Perform a vertical common size analysis of revenues using total revenue as the base , and comment on the relative size of the component parts
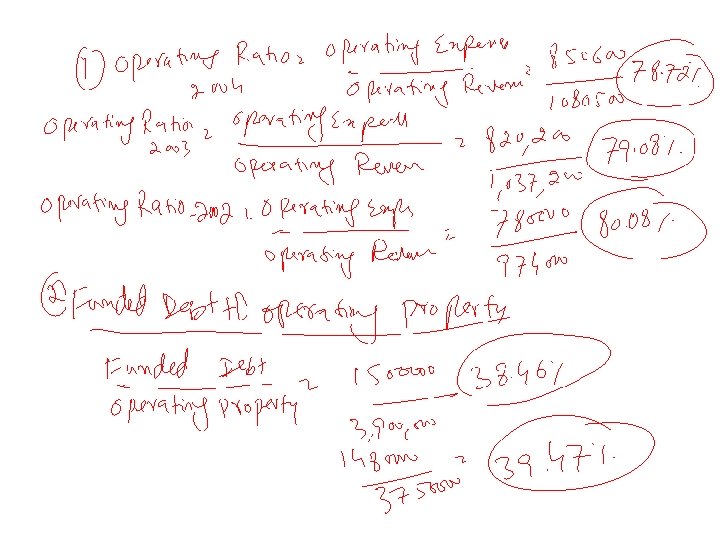
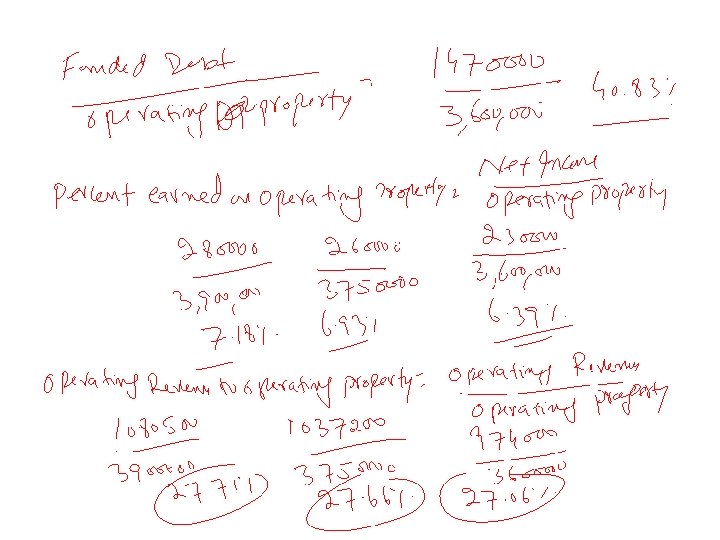
Practical Exercise The following statics relate to Michgate an electric utility 2004 2003 2002 (In thousands of dollars, except per share) Operating expenses $ 850, 600 $ 820, 200 $780, 000 Operating revenues $1, 080, 500 $1, 037, 200 $974, 000 Earnings per share 3. 00 2. 90 2. 60 Cash flow per share 3. 40 3. 25 2. 30 Operating property $ 3, 900, 000 $3, 750, 000 $3, 600, 000 Funded debt (long term) $1, 500, 000 $1, 480, 000 $1, 470, 000 Net income $ 280, 000 $ 260, 000 $ 230, 000
Practical Exercise (Cont’d) Required: a. Calculate the following for 2004, 2003, and 2002 1. Operating ratio 2. Funded debt to operating property 3. Percent earned on operating property 4. Operating revenue to operating property b. Comment on trends found in the ratios computed in (a) c. Comment on the trend between earnings per share and cash flow per share
• The operating ratio decreased, indicating improved efficiency. • Funded debt to operating property decreased, indicating less risk because a lower percentage of funds were supplied by funded debt. • Percent earned to operating property increased, indicating improved profitability. • Operating revenue to operating property increased, indicating improved profitability. • Cash flow per share has increased much more than earnings per share. This would be considered to be positive.
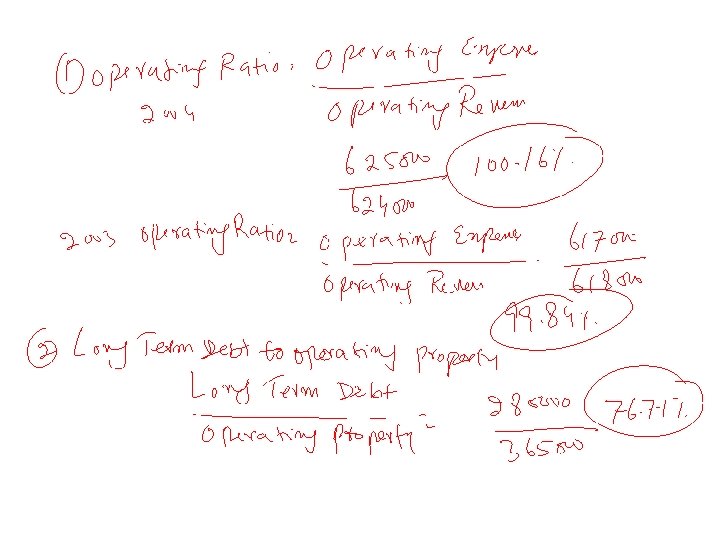
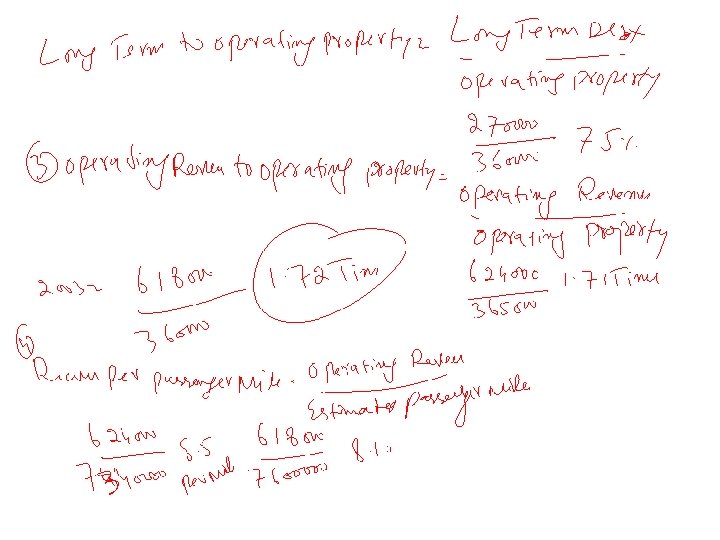
Practical Exercise Local Airways had the following results in the last two years: 2004 2003 Operating revenues $624, 000 $618, 000 Operating expenses $625, 000 $617, 000 Operating property $365, 000 $360, 000 Long term debt $280, 000 $270, 000 Estimated passenger miles $7, 340, 000 $7, 600, 000 Required: Calculate the following for 2004 and 2003; a. Calculate the operating ratio and comment on the trend. b. Calculate the long term debt to operating property ratio. What does this tell about debt use? c. Calculate the operating revenue to operating property and comment on the trend d. Calculate the revenue per passenger mile. What has caused this trend?
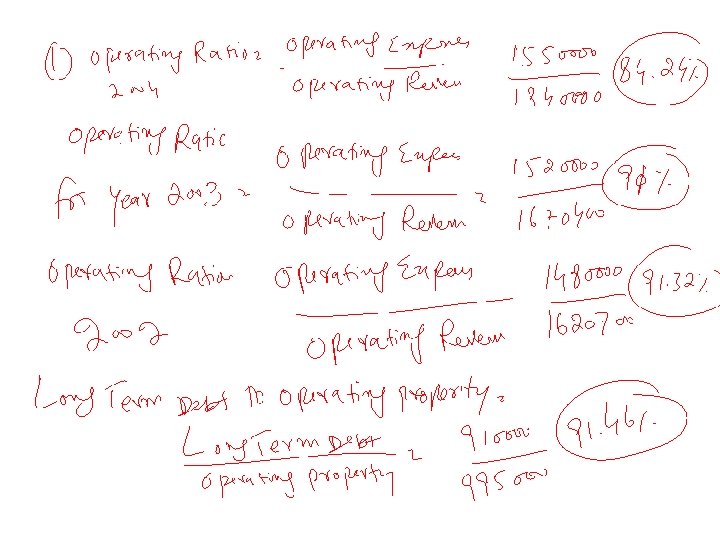
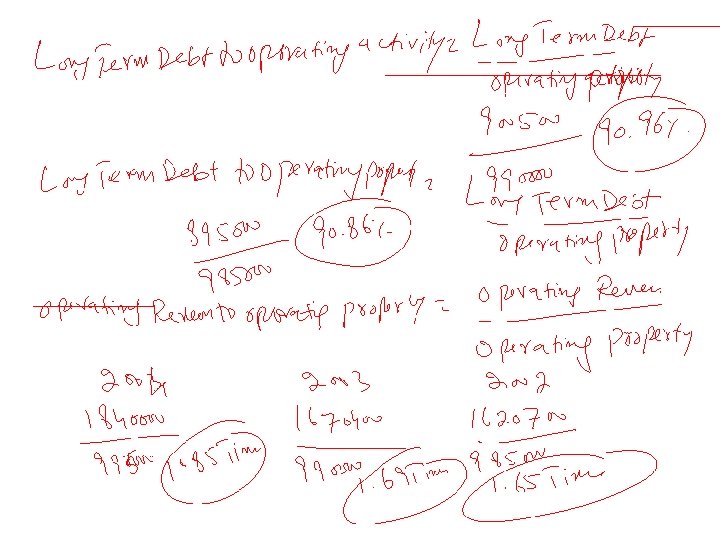
Practical Exercise Chihi Airways had the following results for the last three years: 2004 2003 2002 (In thousands of dollars) Operating expenses $1, 550, 000 $1, 520, 000 $1, 480, 000 Operating revenues $1, 840, 000 $1, 670, 400 $1, 620, 700 Long term debt $ 910, 000 $ 900, 500 $ 895, 000 Operating property $ 995, 000 $ 990, 000 $ 985, 000 Passenger load factor 66. 5% 59. 0% 57. 8% Required: Calculate the following for 2004 , 2003 and 2002: • Operating ratio • Long term debt to operating property • Operating revenue to operating property • Comment on trends found in the ratio computed in (a) • Comment on the passenger load factor
B. • The operating ratio decreased significantly, indicating improved profitability. • Long‑term debt to operating property increased slightly, indicating a slight increase in risk. • Operating revenue to operating property increased moderately, indicating improved profitability. C. • The passenger load factor increased materially, indicating improved profitability.
Days’ Sales in Receivables • Should mirror the company’s credit terms • Reading reflects end-of-year status of receivables – Use of the natural business year (lower sales at year-end) can understate result • Compare – Firm data for several years – Other industry firms and industry averages Lecrure 10 21
Accounts Receivable Turnover • Indicates the liquidity of receivables • Determining average gross receivables – End of year and beginning of year base points for average mask seasonal fluctuations – Internal analysis: use monthly or weekly amounts – External analysis: use quarterly data Lecture 10 22
Accounts Receivable Turnover in Days • Similar to Number of Days’ Sales in Receivables except average receivables are used • Should reflect firm’s credit and collection policies Lecture 10 23
Days’ Sales in Inventory • Indicates the length of time needed to sell all inventory on hand • Use of a natural business year – Understates number of day’s sale in inventory – Overstates liquidity of inventory • Implications of extremes – High: excessive inventory for sales activity – Low: inventory shortage and lost sales Lecture 11 24
Inventory Turnover • Indicates the liquidity of inventory • Determining average inventory – End of year and beginning of year base points for average mask seasonal fluctuations – Internal analysis: use monthly or weekly amounts – External analysis: use quarterly data Lecture 11 25
Inventory Turnover in Days Inventory Turnover per Year Lecture 11 26
Current Assets: Operating Cycle • The time period between acquisition of goods and the final cash realization from sales • Subject to potential understatement from understatement of turnover measures – Use of LIFO – Use of a natural business year – Averages are computed on beginning-of-year and end-of-year data Lecture 11 27
Working Capital – = Current Assets Current Liabilities Working Capital • Subject to understatement if certain assets are understated (i. e. , LIFO inventory) • Longitudinal comparison appropriate • Inter-firm comparison is of no value Lecture 11 28
Acid-Test (Quick) Ratios Current Ratio Lecture 11 29
Cash Ratio • Extremely conservative – Unrealistic for a firm to have sufficient cash and securities to cover all its current liabilities • Appropriate context – Firms with naturally slow-moving inventory and receivables – Firms that are highly speculative Lecture 11 30
Sales to Working Capital • Measures the turnover of working capital per year • Compare with – Historical data – Industry competitors – Industry averages • Assessment – Low: potentially unprofitable use of working capital – High: potential undercapitalization Lecture 11 31
Times Interest Earned Lecrure 13 32
Times Interest Earned Short-Run Variation Lecture 13 33
Fixed Charge Coverage • Ratio trend is usually similar to trend of times-interest-earned ratio Lecture 13 34
Debt Ratio • Indicates the percentage of assets financed by creditors • Comparisons – Industry competitors and averages • Variations in application – Short-term liabilities • Not part of long-term source of funds: exclude • Part of the total source of funds: include – Liabilities that do not necessarily represent a commitment to pay out funds in the future Lecture 14 35
Debt/Equity Ratio • Helps determine how well creditors are protected in case of insolvency • Comparisons – Industry competitors and averages Lecture 14 36
Debt to Tangible Net Worth Ratio • Determines the entity’s long-term debt payment ability • Indicates how well creditors are protected in case of the firm’s insolvency • More conservative than debt ratio or debt/equity ratio due to exclusion of intangibles Lecture 14 37
Net Profit Margin • Also referred to as return on sales • Reflects net income dollars generated by each dollar of sales • Potential distortion – Net “other” income or loss Lecture 15 38
Total Asset Turnover • Measures the activity of the assets and the ability of the firm to generate sales through the use of the assets • Potential distortion – Investments – Construction in progress – Other assets that do not relate to net sales Lecture 15 39
Return on Assets • Measures the ability to utilize assets to create profits • Average total assets – Internal analysis: month-end amounts – External analysis: beginning and ending amounts – If necessary, consistent use of end-of-year amounts Lecture 15 40
Net Profit Margin • Also referred to as return on sales • Reflects net income dollars generated by each dollar of sales • Potential distortion – Net “other” income or loss Lecture 16 41
Total Asset Turnover • Measures the activity of the assets and the ability of the firm to generate sales through the use of the assets • Potential distortion – Investments – Construction in progress – Other assets that do not relate to net sales Lecture 16 42
Return on Assets • Measures the ability to utilize assets to create profits • Average total assets – Internal analysis: month-end amounts – External analysis: beginning and ending amounts – If necessary, consistent use of end-of-year amounts Lecture 16 43
Du. Pont Return on Assets Lecture 17 44
Operating Income Margin • Use operating income in the numerator Lecture 17 45
Operating Asset Turnover • Measures the ability of operating assets to generate sales dollars Lecture 17 46
Return on Operating Assets • Measures the ability of operating assets to generate operating income • Du. Pont analysis of the return on operating assets: Lecture 17 47
Sales to Fixed Assets • Measures the ability to make productive use of property, plant, and equipment by generating sales dollars – Exclude construction in progress • Possible distortions – Old fixed assets – Labor-intensive industry Lecture 17 48
Return on Investment (ROI) • The return on investment applied to ratios measuring the income earned on the invested capital. • These types of measures are widely used to evaluate enterprise performance. • Measures the earnings on investment and indicates how well the firm utilizes its asset base. • Evaluates enterprise performance Lecture 18 49
Return on Total Equity • The return on total equity measures the return to both common and preferred stockholders • Adjustments for redeemable preferred stock – Deduct dividends from net income (numerator) – Deduct stock value from total equity (denominator) Lecture 18 50
Return on Common Equity • This ratio measures the return to the common stockholder • Common equity: Total stockholders’ equity less preferred capital less minority interest reported as equity Lecture 18 51
Gross Profit Margin Sales – Cost of Goods Sold = Gross Profit Beginning Inventory + Purchases of Inventory – Ending Inventory Lecture 18 52
Computation of the Degree of Financial Leverage The degree of financial leverage is the multiplication factor by which the net income changes in respect to changes in EBIT A more simple formula for degree of financial leverage Lecture 19 53
Basic Earnings per Share • Earnings pertain to an entire fiscal period • Average common shares outstanding is used for parity of information Lecture 19 54
Price/Earnings Ratio • Measures the relationship between the market price of a share of common stock and that stock’s current earnings per share – Use of diluted earnings per share gives more conservative price/earnings ratio Lecture 20 55
Percentage of Earnings Retained • Reflects the proportion of current earnings retained for internal growth • Trend analysis is improved by exclusion of nonrecurring items • Higher percentage typically found in – New firms – Growing firms and firms perceived as growth firms Lecture 20 56
Dividend Payout • Measures the portion of current earnings per common share being paid out in dividends • A stable dividend policy is developed by consideration of recurring earnings • Lower payout typically found in – New firms – Growing firms and firms perceived as growth firms 4/11/2020 Lecture 20 57
Dividend Yield • Indicates the relationship between the dividends per common share and the market price per common share • The yield is a function of – The firm’s dividend policy – Market price Lecture 20 58
Book Value per Share • • An accounting term that measures the intrinsic value of a single share of a company’s stock. Book value is calculated by totalling the company’s assets, subtracting all debts, liabilities, and the liquidation price of preferred stock, then dividing the result by the number of outstanding shares of common stock. Preferred equity should be measured at liquidation value, if available Market value vis-à-vis book value – Book value reflects past unrecovered asset costs – Market value reflects the potential of the firm Lecture 21 59
Impact of Stock Option Expense Lecture 21 60
Operating Cash Flow/Current Maturities of Long. Term Debt and Current Notes Payable • Indicates a firm’s abilities to meet its current maturities of debt • Higher ratio indicates better liquidity Lecture 25 61
Operating Cash Flow to Total Debt • Indicates a firm’s ability to cover total debt with the yearly operating cash flow • Conservative approach is to include all possible balance sheet debt Lecture 25 62
Operating Cash Flow Per Share • A better indication of a firm’s ability to make capital expenditure decisions and pay dividends than is earnings per share • Does not reflect firm’s profitability – Firms are prohibited from reporting this statistic in financial statements or in the notes thereto Lecture 25 63
Operating Cash Flow to Cash Dividends • Indicates a firm’s ability to cover cash dividends with the yearly operating cash flow Lecture 25 64
Lecture Summary Statement Analysis for Special Industries: Ø Practical Questions Ø Ratios Discussed in Lecture 10 Ø Ratios Discussed in Lecture 11 Ø Ratios Discussed in Lecture 13 Ø Ratios Discussed in Lecture 14 Ø Ratios Discussed in Lecture 15 Ø Ratios Discussed in Lecture 16 Ø Ratios Discussed in Lecture 17 Ø Ratios Discussed in Lecture 18 Ø Ratios Discussed in Lecture 19 Ø Ratios Discussed in Lecture 20 Ø Ratios Discussed in Lecture 21 Ø Ratios Discussed in Lecture 25