Chapter 2 Financial Statements Cash Flow and Taxes
- Slides: 12
Chapter 2 Financial Statements, Cash Flow, and Taxes 1
Topics in Chapter Read the following sections: n 2 -1: Financial Statements and Reports n 2 -2: The Balance Sheet n 2 -3: The Income Statement 2
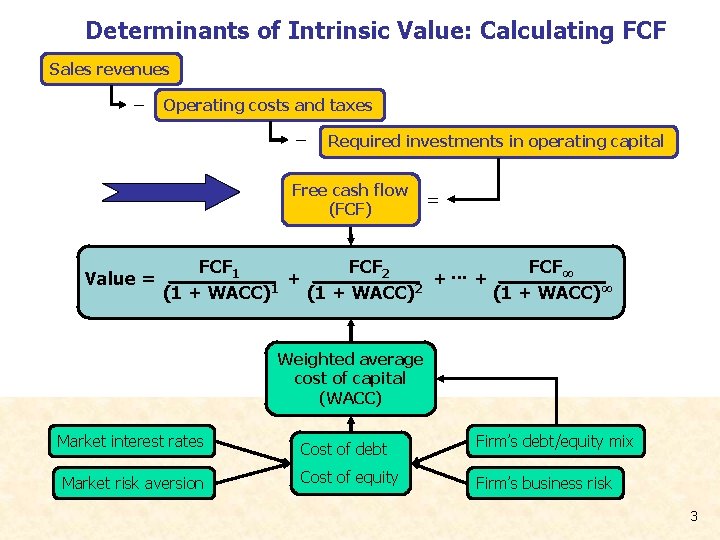
Determinants of Intrinsic Value: Calculating FCF Sales revenues − Operating costs and taxes − Required investments in operating capital Free cash flow (FCF) Value = = FCF 1 FCF 2 FCF∞. . . + + + (1 + WACC)1 (1 + WACC)2 (1 + WACC)∞ Weighted average cost of capital (WACC) Market interest rates Cost of debt Firm’s debt/equity mix Market risk aversion Cost of equity Firm’s business risk 3
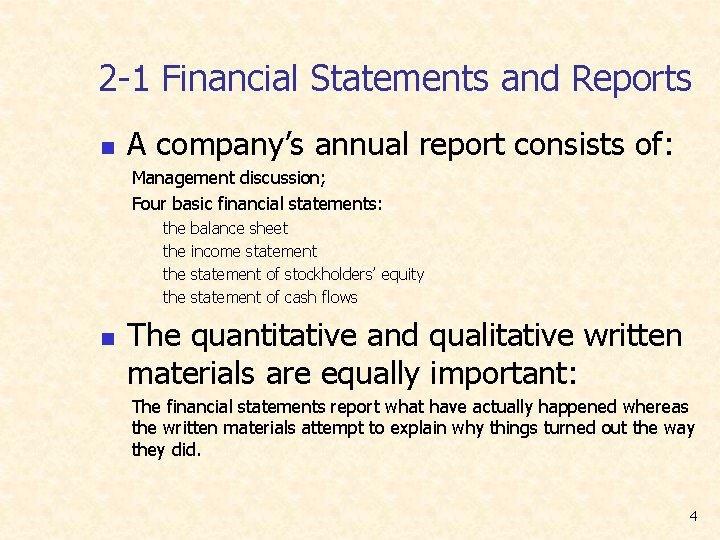
2 -1 Financial Statements and Reports n A company’s annual report consists of: Management discussion; Four basic financial statements: the the n balance sheet income statement of stockholders’ equity statement of cash flows The quantitative and qualitative written materials are equally important: The financial statements report what have actually happened whereas the written materials attempt to explain why things turned out the way they did. 4
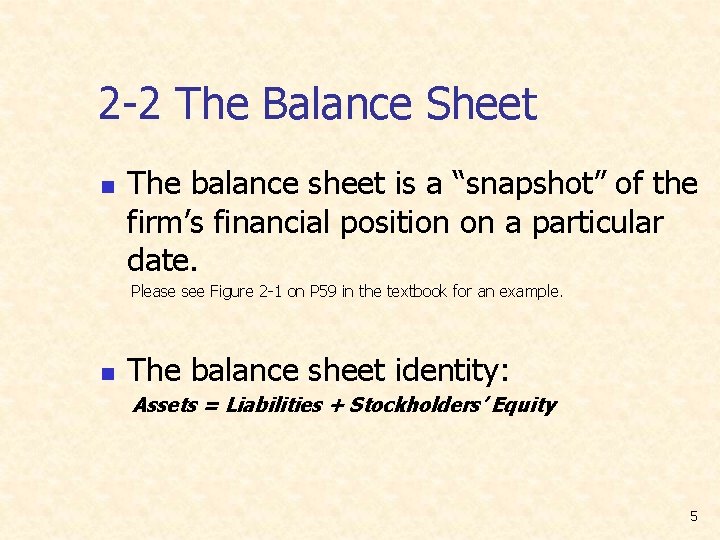
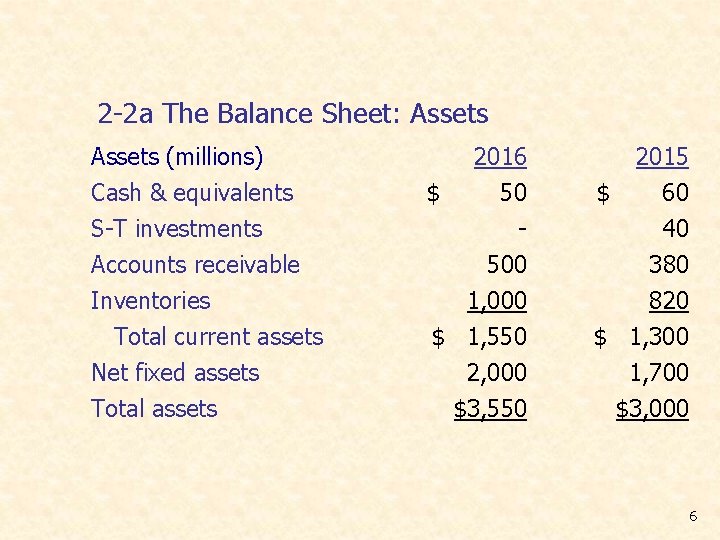
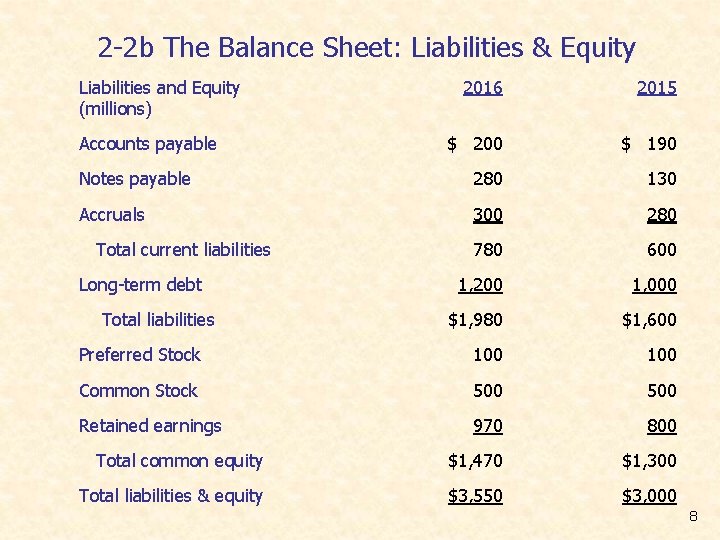
2 -2 The Balance Sheet n The balance sheet is a “snapshot” of the firm’s financial position on a particular date. Please see Figure 2 -1 on P 59 in the textbook for an example. n The balance sheet identity: Assets = Liabilities + Stockholders’ Equity 5
2 -2 a The Balance Sheet: Assets (millions) Cash & equivalents S-T investments Accounts receivable Inventories Total current assets Net fixed assets Total assets $ 2016 50 500 1, 000 $ 1, 550 2, 000 $3, 550 $ 2015 60 40 380 820 $ 1, 300 1, 700 $3, 000 6
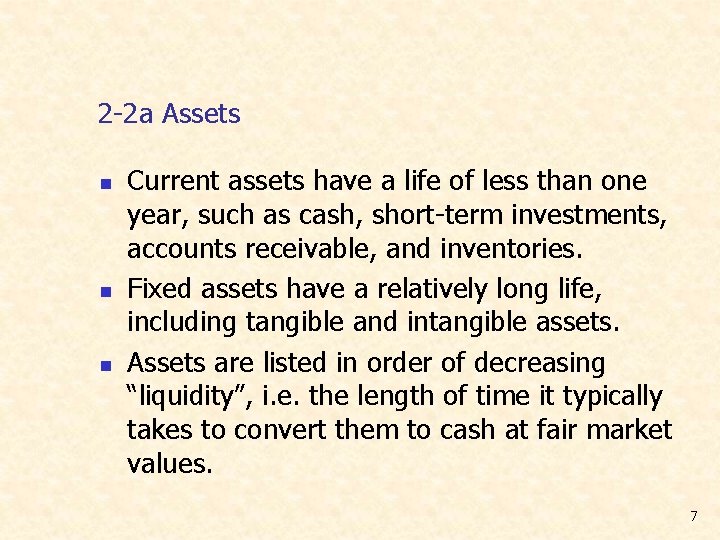
2 -2 a Assets n n n Current assets have a life of less than one year, such as cash, short-term investments, accounts receivable, and inventories. Fixed assets have a relatively long life, including tangible and intangible assets. Assets are listed in order of decreasing “liquidity”, i. e. the length of time it typically takes to convert them to cash at fair market values. 7
2 -2 b The Balance Sheet: Liabilities & Equity Liabilities and Equity (millions) 2016 2015 $ 200 $ 190 Notes payable 280 130 Accruals 300 280 780 600 1, 200 1, 000 $1, 980 $1, 600 Preferred Stock 100 Common Stock 500 Retained earnings 970 800 Total common equity $1, 470 $1, 300 Total liabilities & equity $3, 550 $3, 000 Accounts payable Total current liabilities Long-term debt Total liabilities 8
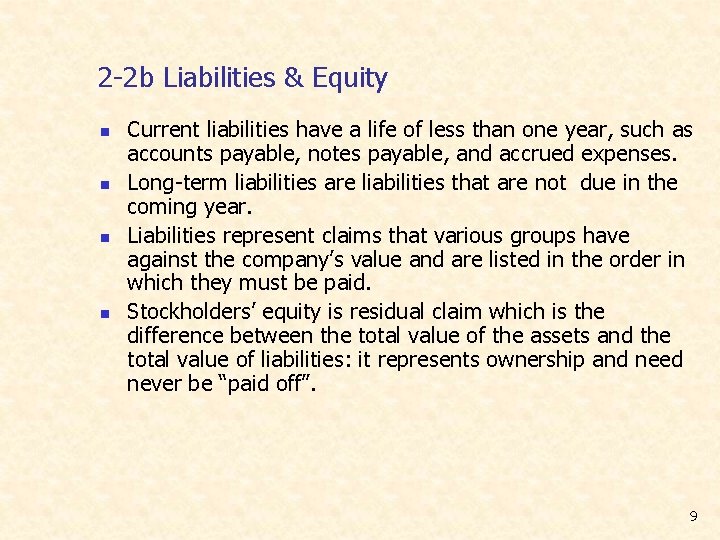
2 -2 b Liabilities & Equity n n Current liabilities have a life of less than one year, such as accounts payable, notes payable, and accrued expenses. Long-term liabilities are liabilities that are not due in the coming year. Liabilities represent claims that various groups have against the company’s value and are listed in the order in which they must be paid. Stockholders’ equity is residual claim which is the difference between the total value of the assets and the total value of liabilities: it represents ownership and need never be “paid off”. 9
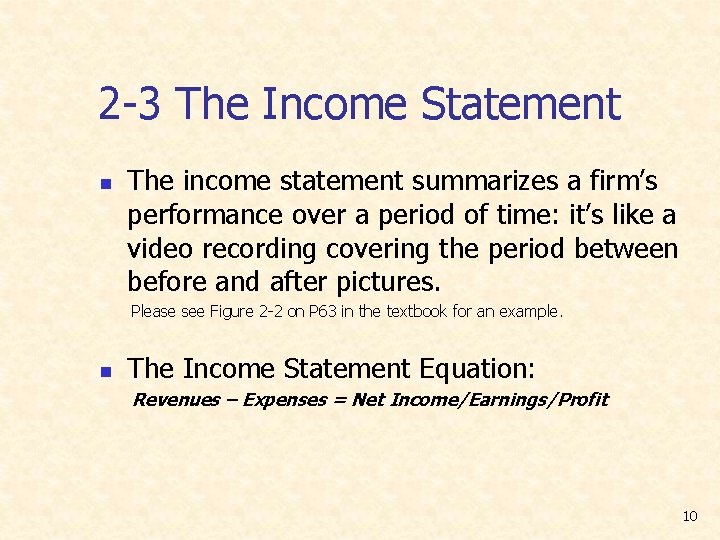
2 -3 The Income Statement n The income statement summarizes a firm’s performance over a period of time: it’s like a video recording covering the period between before and after pictures. Please see Figure 2 -2 on P 63 in the textbook for an example. n The Income Statement Equation: Revenues – Expenses = Net Income/Earnings/Profit 10
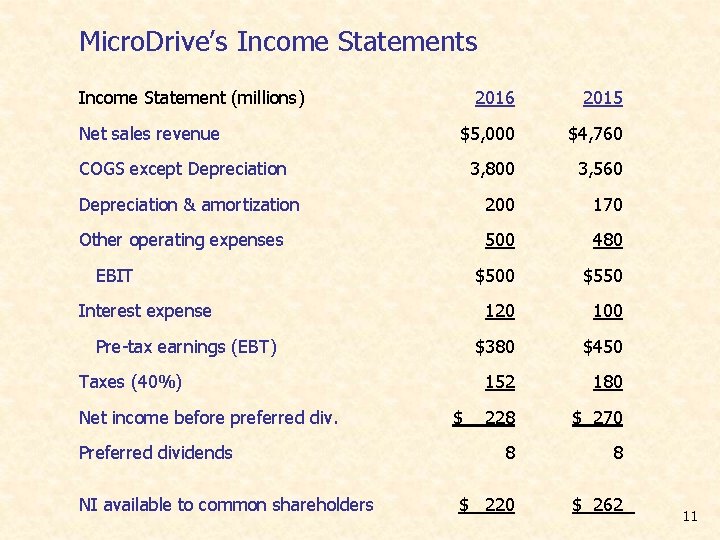
Micro. Drive’s Income Statement (millions) 2016 2015 $5, 000 $4, 760 3, 800 3, 560 Depreciation & amortization 200 170 Other operating expenses 500 480 $500 $550 120 100 $380 $450 152 180 228 $ 270 8 8 $ 220 $ 262 Net sales revenue COGS except Depreciation EBIT Interest expense Pre-tax earnings (EBT) Taxes (40%) Net income before preferred div. Preferred dividends NI available to common shareholders $ 11
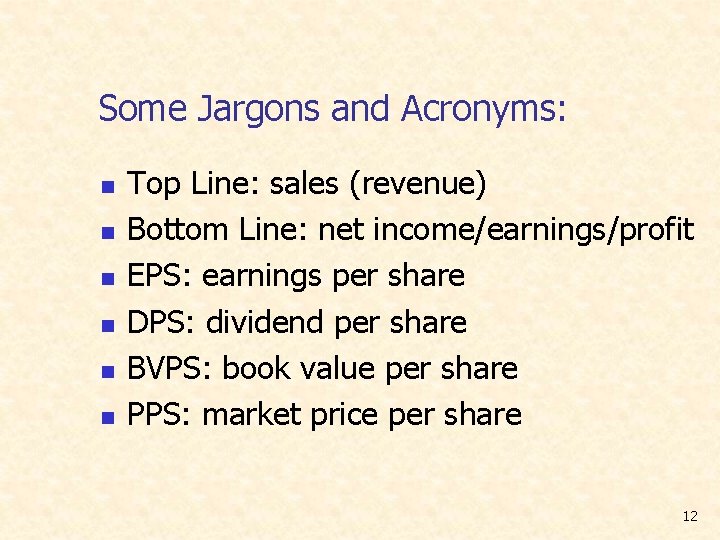
Some Jargons and Acronyms: n n n Top Line: sales (revenue) Bottom Line: net income/earnings/profit EPS: earnings per share DPS: dividend per share BVPS: book value per share PPS: market price per share 12