Cardiovascular Disease CVD in Texas Philip Huang MD







- Slides: 61
Cardiovascular Disease (CVD) in Texas Philip Huang, MD, MPH Texas Department of State Health Services
Overview n Burden of CVD n n n Risk Factors Quality/Performance n n n Mortality Morbidity Economic Cost HEDIS EMS Strategies to Address
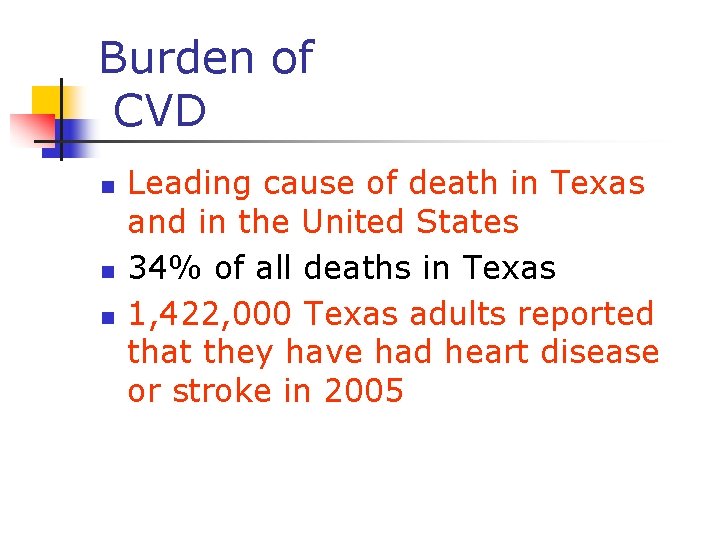
Burden of CVD n n n Leading cause of death in Texas and in the United States 34% of all deaths in Texas 1, 422, 000 Texas adults reported that they have had heart disease or stroke in 2005
MORTALITY DATA
Mortality Data n n Death certificate data were compiled and tabulated by the Statistical Services Division of the Texas Vital Statistical Unit (VSU) All death rates are age-adjusted using the 2000 US standard population
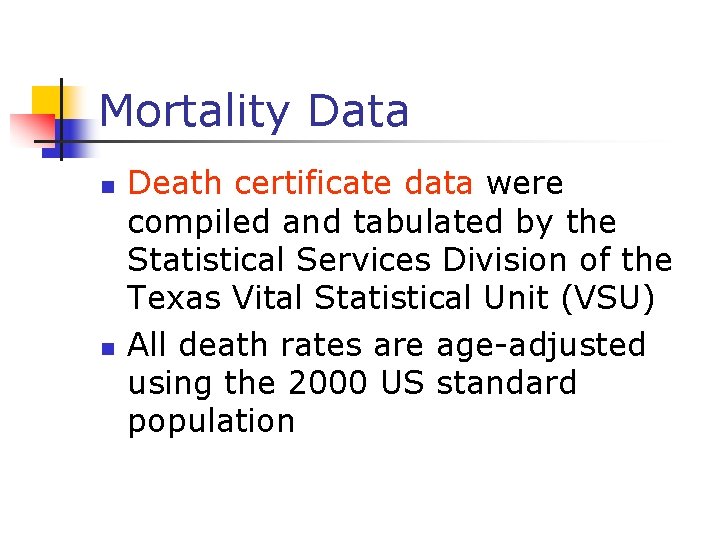
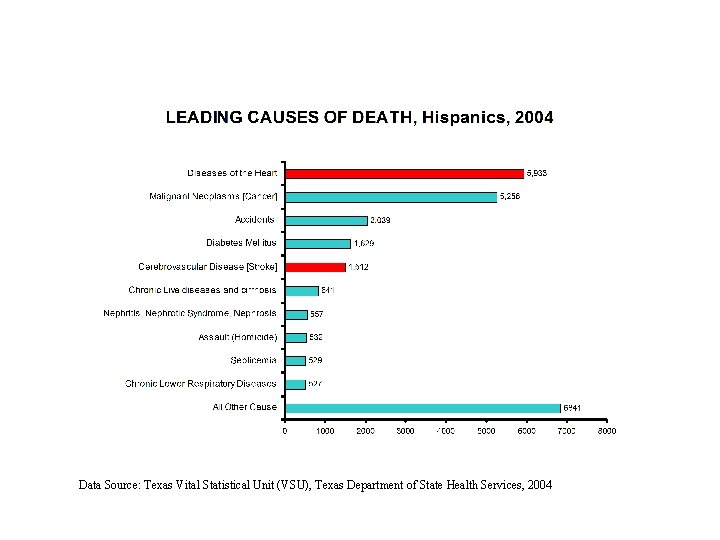
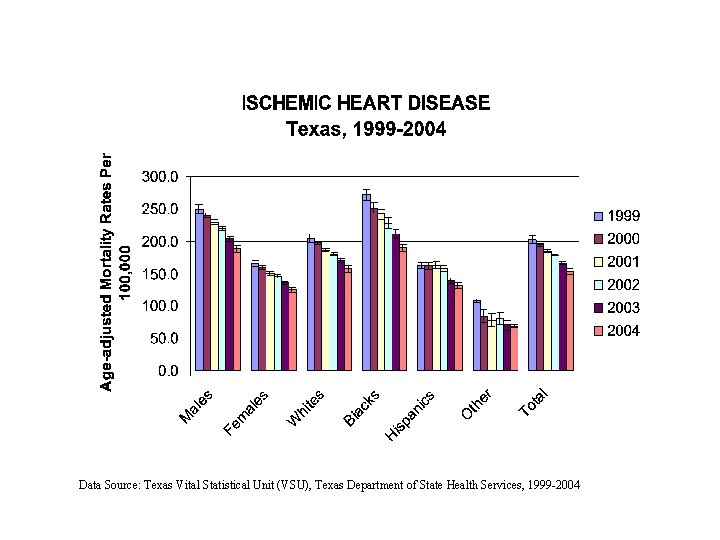
Data Source: Texas Vital Statistical Unit (VSU), Texas Department of State Health Services, 2004
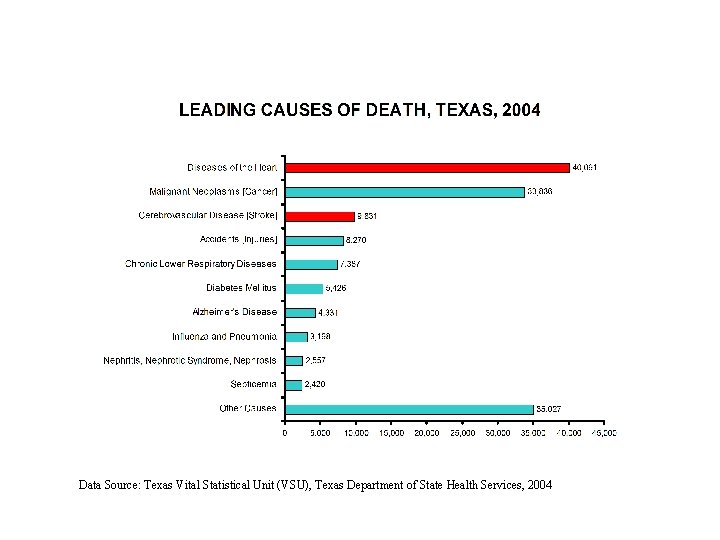
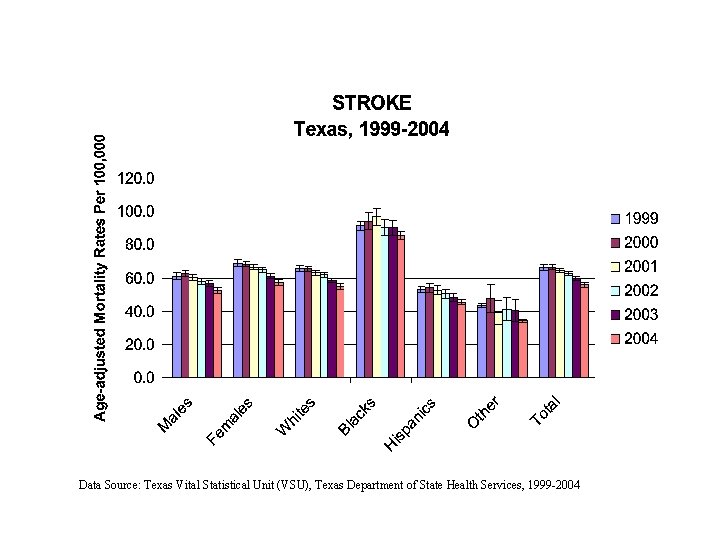
Data Source: Texas Vital Statistical Unit (VSU), Texas Department of State Health Services, 2004
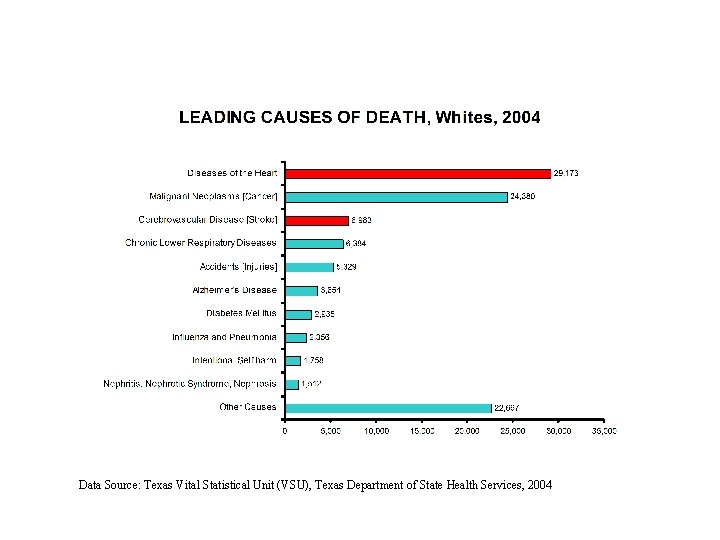
Data Source: Texas Vital Statistical Unit (VSU), Texas Department of State Health Services, 2004
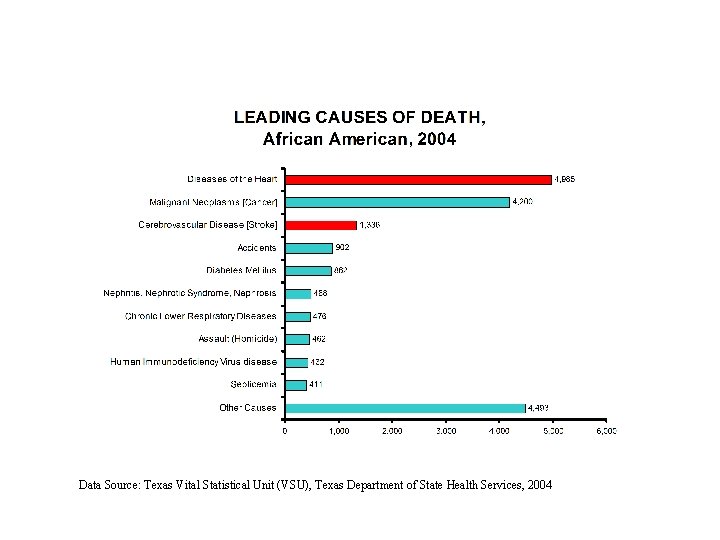
Data Source: Texas Vital Statistical Unit (VSU), Texas Department of State Health Services, 2004
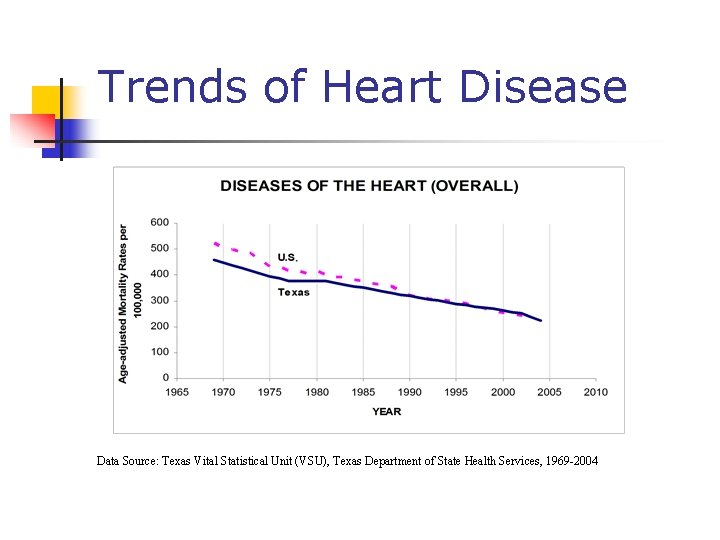
Trends of Heart Disease Data Source: Texas Vital Statistical Unit (VSU), Texas Department of State Health Services, 1969 -2004
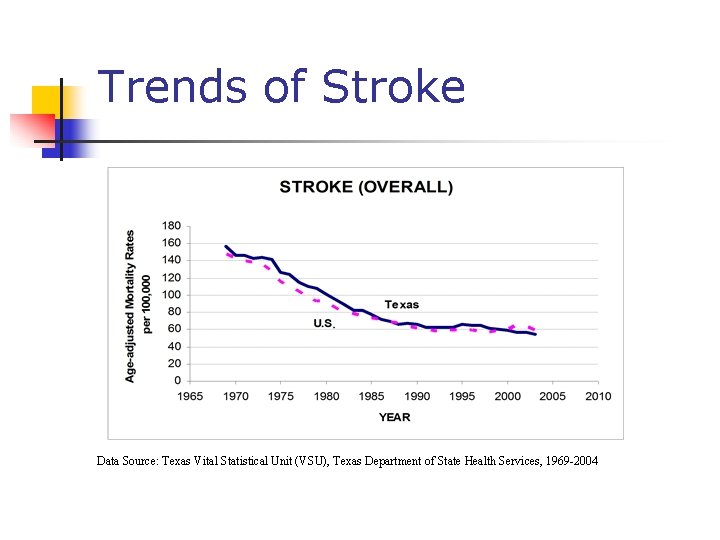
Trends of Stroke Data Source: Texas Vital Statistical Unit (VSU), Texas Department of State Health Services, 1969 -2004
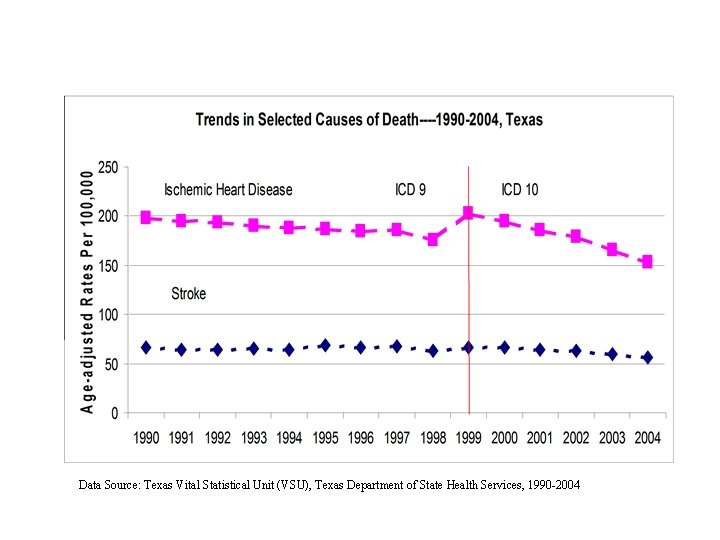
Data Source: Texas Vital Statistical Unit (VSU), Texas Department of State Health Services, 1990 -2004
Data Source: Texas Vital Statistical Unit (VSU), Texas Department of State Health Services, 1999 -2004
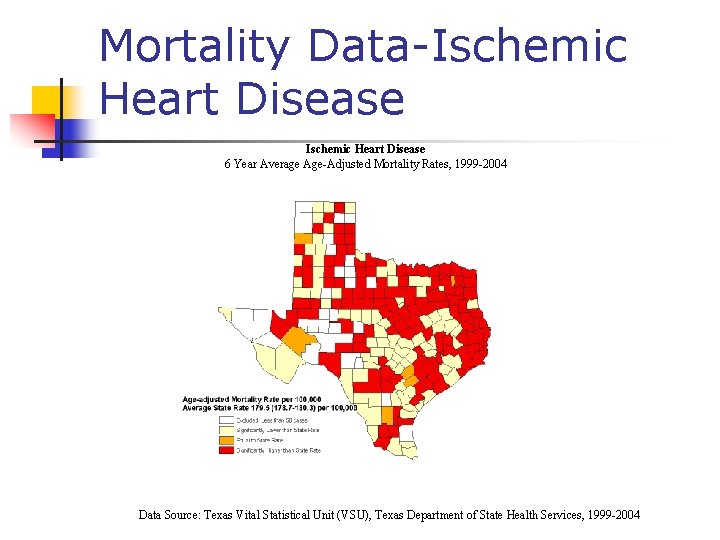
Mortality Data-Ischemic Heart Disease 6 Year Average Age-Adjusted Mortality Rates, 1999 -2004 Data Source: Texas Vital Statistical Unit (VSU), Texas Department of State Health Services, 1999 -2004
Data Source: Texas Vital Statistical Unit (VSU), Texas Department of State Health Services, 1999 -2004
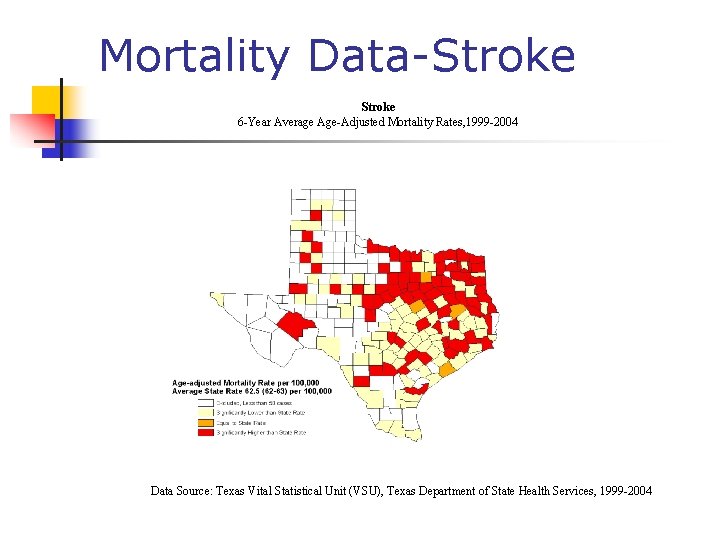
Mortality Data-Stroke 6 -Year Average Age-Adjusted Mortality Rates, 1999 -2004 Data Source: Texas Vital Statistical Unit (VSU), Texas Department of State Health Services, 1999 -2004
Hospital Discharge Data 2000 - 2004
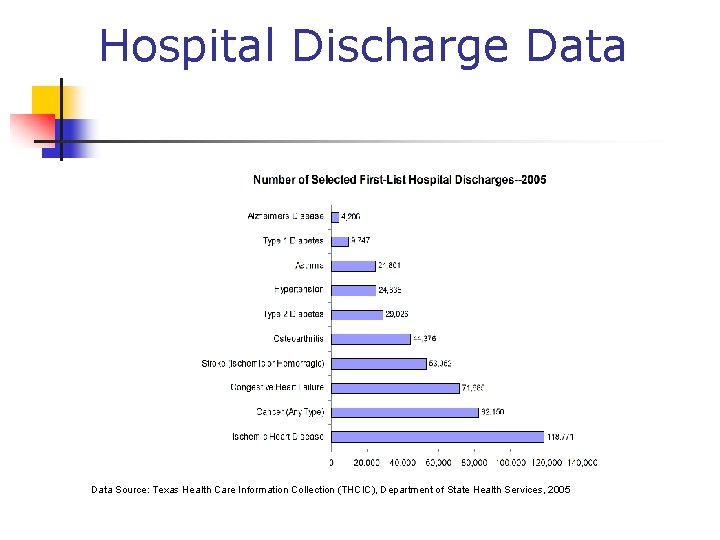
Hospital Discharge Data Source: Texas Health Care Information Collection (THCIC), Department of State Health Services, 2005
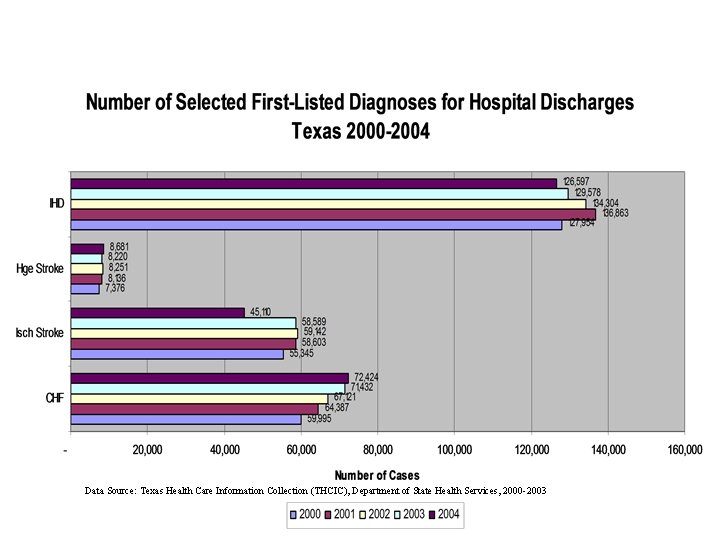
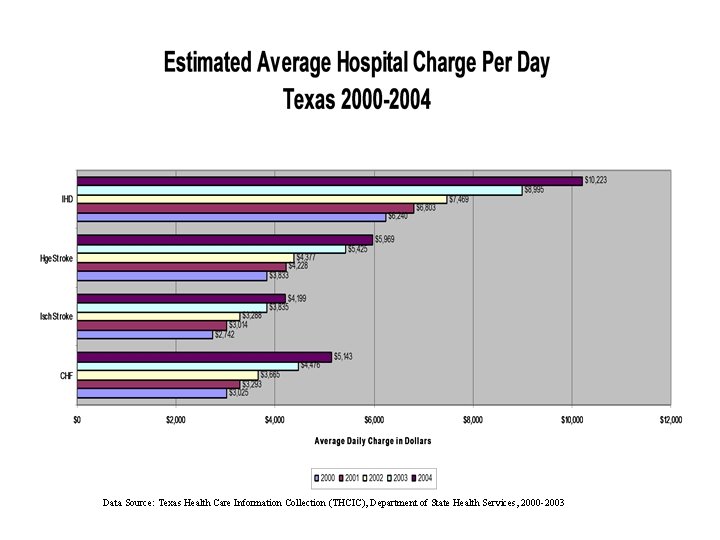
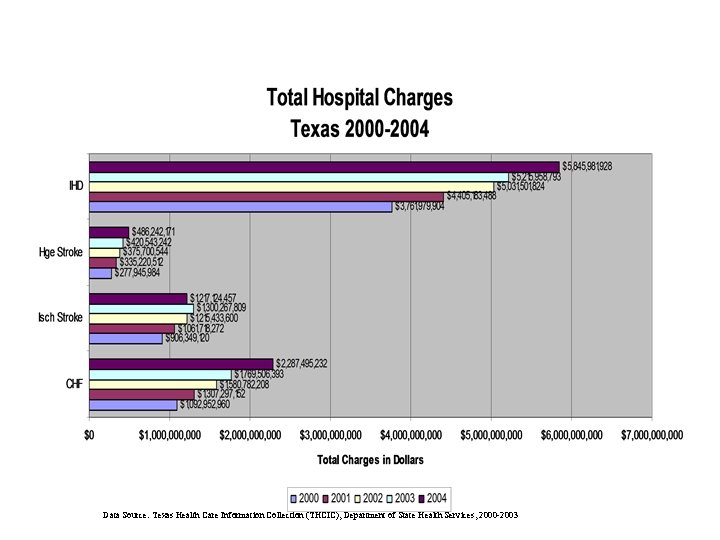
Data Source: Texas Health Care Information Collection (THCIC), Department of State Health Services, 2000 -2003
Estimated Hospital Charges
Data Source: Texas Health Care Information Collection (THCIC), Department of State Health Services, 2000 -2003
Data Source: Texas Health Care Information Collection (THCIC), Department of State Health Services, 2000 -2003
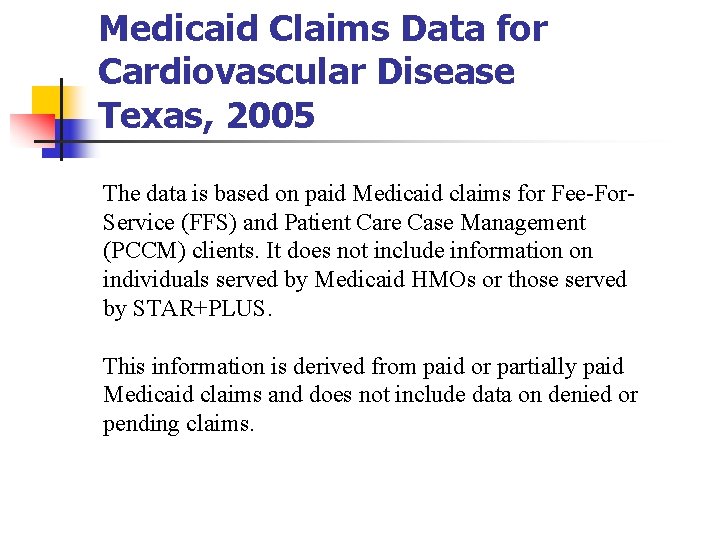
Medicaid Claims Data for Cardiovascular Disease Texas, 2005 The data is based on paid Medicaid claims for Fee-For. Service (FFS) and Patient Care Case Management (PCCM) clients. It does not include information on individuals served by Medicaid HMOs or those served by STAR+PLUS. This information is derived from paid or partially paid Medicaid claims and does not include data on denied or pending claims.
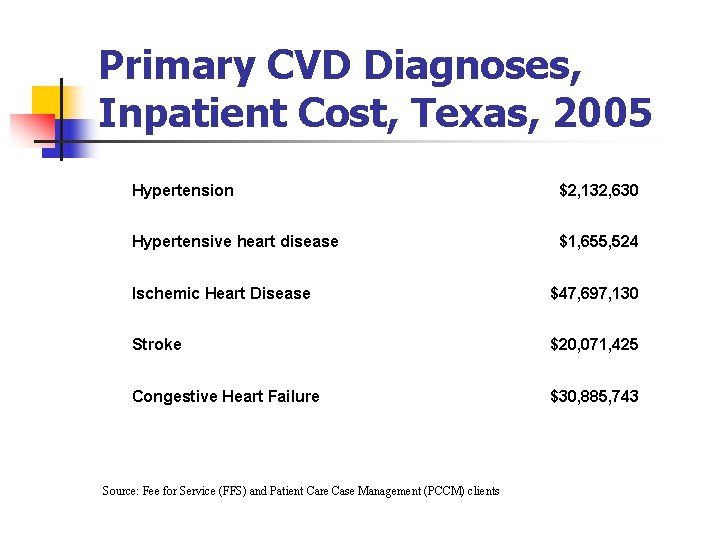
Primary CVD Diagnoses, Inpatient Cost, Texas, 2005 Hypertension $2, 132, 630 Hypertensive heart disease $1, 655, 524 Ischemic Heart Disease $47, 697, 130 Stroke $20, 071, 425 Congestive Heart Failure $30, 885, 743 Source: Fee for Service (FFS) and Patient Care Case Management (PCCM) clients
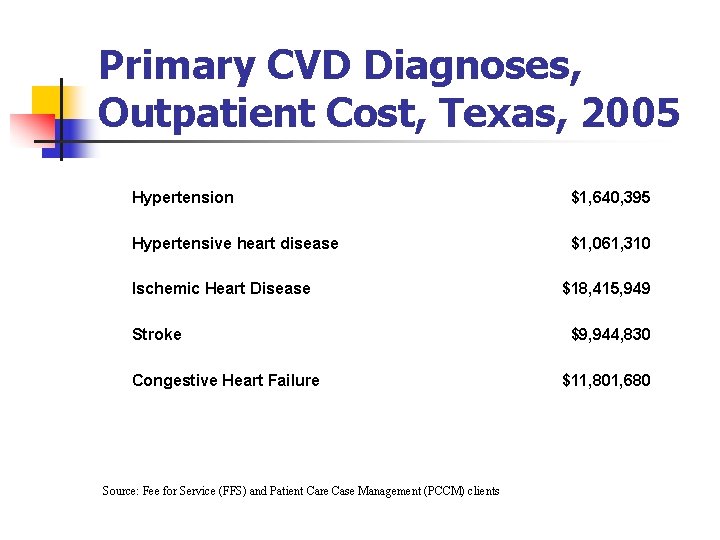
Primary CVD Diagnoses, Outpatient Cost, Texas, 2005 Hypertension $1, 640, 395 Hypertensive heart disease $1, 061, 310 Ischemic Heart Disease Stroke Congestive Heart Failure Source: Fee for Service (FFS) and Patient Care Case Management (PCCM) clients $18, 415, 949 $9, 944, 830 $11, 801, 680
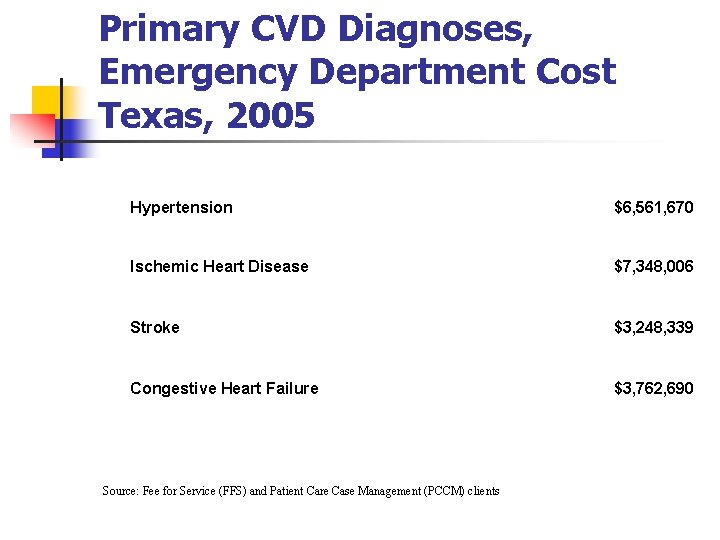
Primary CVD Diagnoses, Emergency Department Cost Texas, 2005 Hypertension $6, 561, 670 Ischemic Heart Disease $7, 348, 006 Stroke $3, 248, 339 Congestive Heart Failure $3, 762, 690 Source: Fee for Service (FFS) and Patient Care Case Management (PCCM) clients
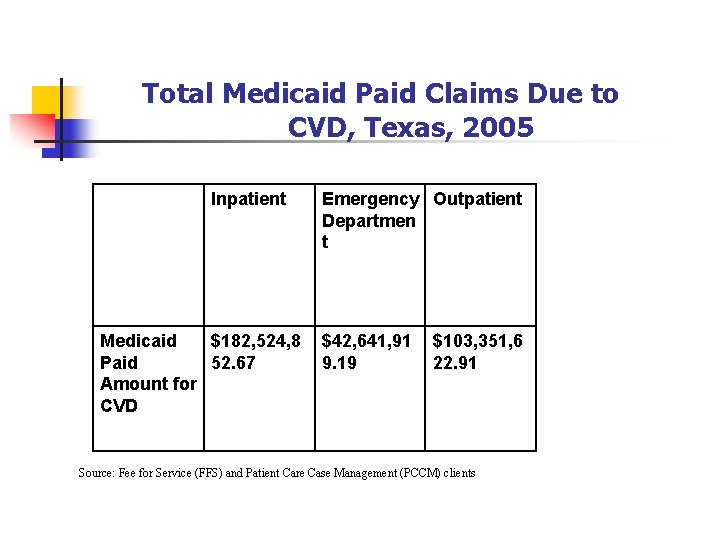
Total Medicaid Paid Claims Due to CVD, Texas, 2005 Inpatient Medicaid $182, 524, 8 Paid 52. 67 Amount for CVD Emergency Outpatient Departmen t $42, 641, 91 9. 19 $103, 351, 6 22. 91 Source: Fee for Service (FFS) and Patient Care Case Management (PCCM) clients
Risk Factor Surveillance
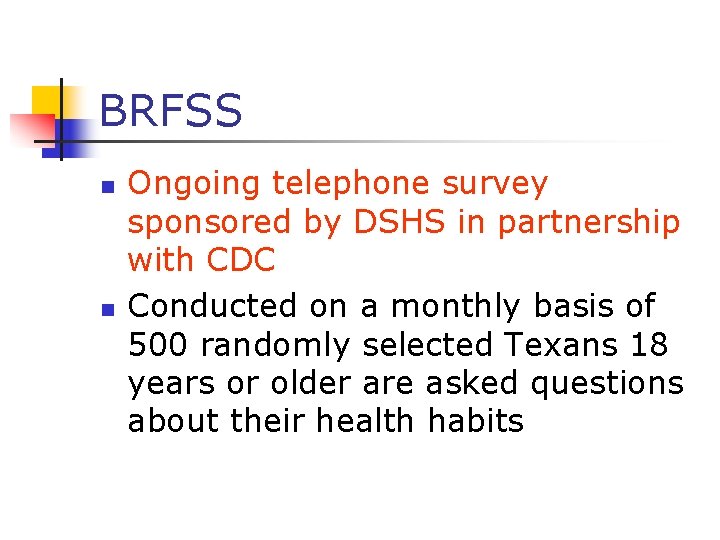
BRFSS n n Ongoing telephone survey sponsored by DSHS in partnership with CDC Conducted on a monthly basis of 500 randomly selected Texans 18 years or older are asked questions about their health habits
BRFSS n n n Behavioral Risk Factors Medical Risk Factors Preventive Health Practices
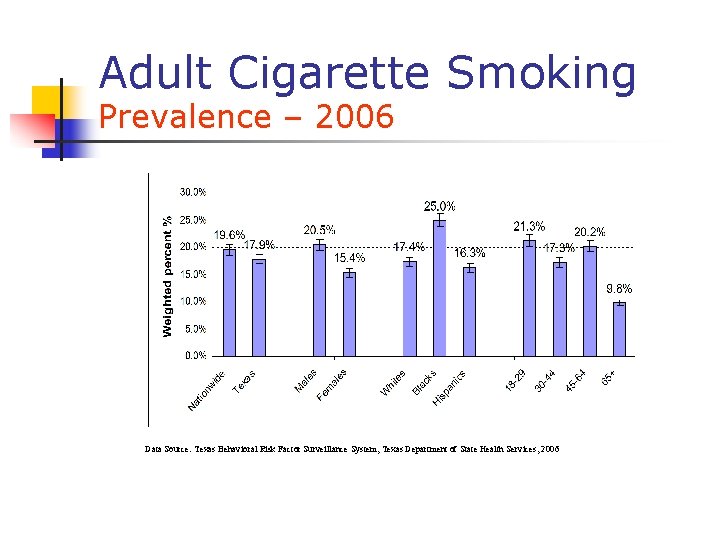
Adult Cigarette Smoking Prevalence – 2006 Data Source: Texas Behavioral Risk Factor Surveillance System, Texas Department of State Health Services, 2006
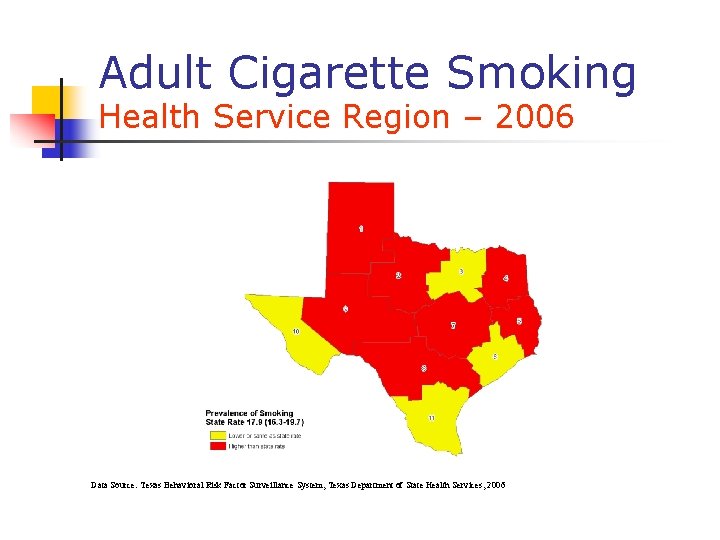
Adult Cigarette Smoking Health Service Region – 2006 Data Source: Texas Behavioral Risk Factor Surveillance System, Texas Department of State Health Services, 2006
Cigarette Smoking Among Youth – 2001 & 2005 Data Source: Texas Youth Risk Behavior Surveys (YRBS), Texas Department of State Health Services, 2001, 2005 (Excluding Houston ISD) High School Survey
Overweight/Obesity
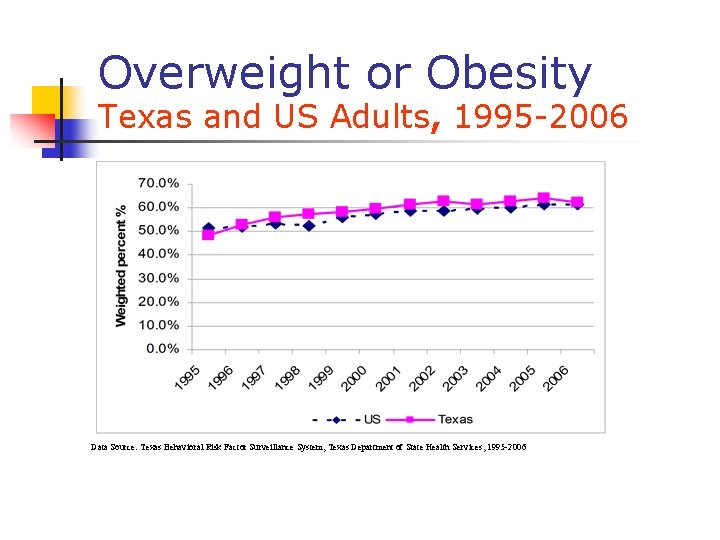
Overweight or Obesity Texas and US Adults, 1995 -2006 Data Source: Texas Behavioral Risk Factor Surveillance System, Texas Department of State Health Services, 1995 -2006
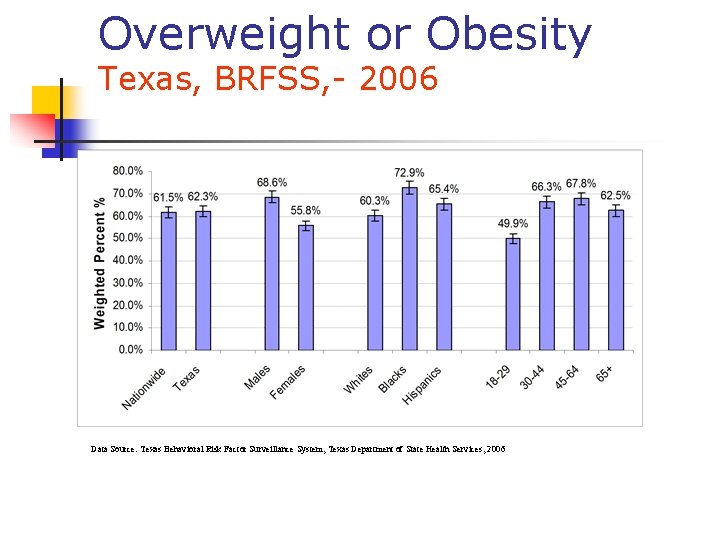
Overweight or Obesity Texas, BRFSS, - 2006 Data Source: Texas Behavioral Risk Factor Surveillance System, Texas Department of State Health Services, 2006
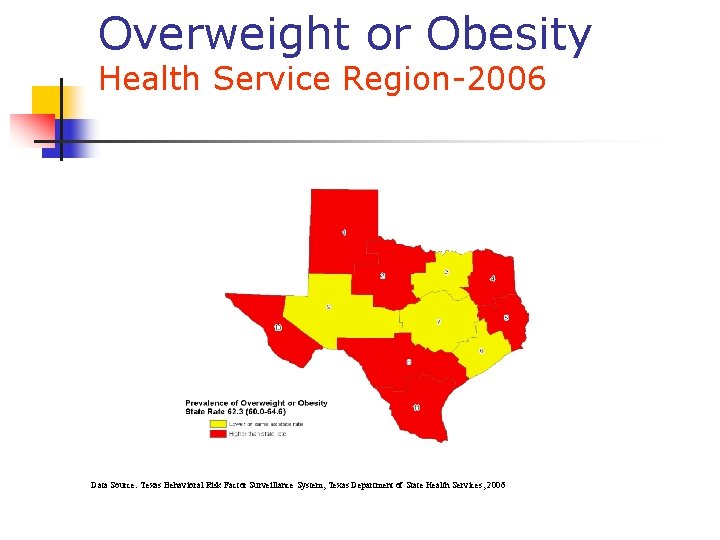
Overweight or Obesity Health Service Region-2006 Data Source: Texas Behavioral Risk Factor Surveillance System, Texas Department of State Health Services, 2006
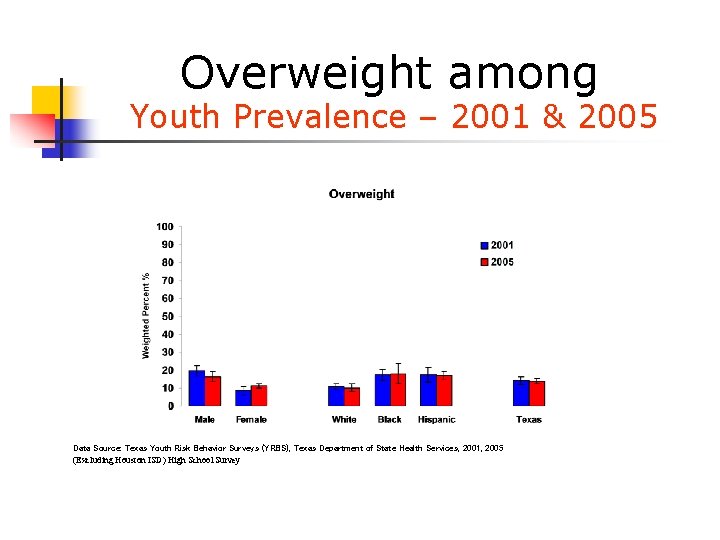
Overweight among Youth Prevalence – 2001 & 2005 Data Source: Texas Youth Risk Behavior Surveys (YRBS), Texas Department of State Health Services, 2001, 2005 (Excluding Houston ISD) High School Survey
Lack of Physical Activity
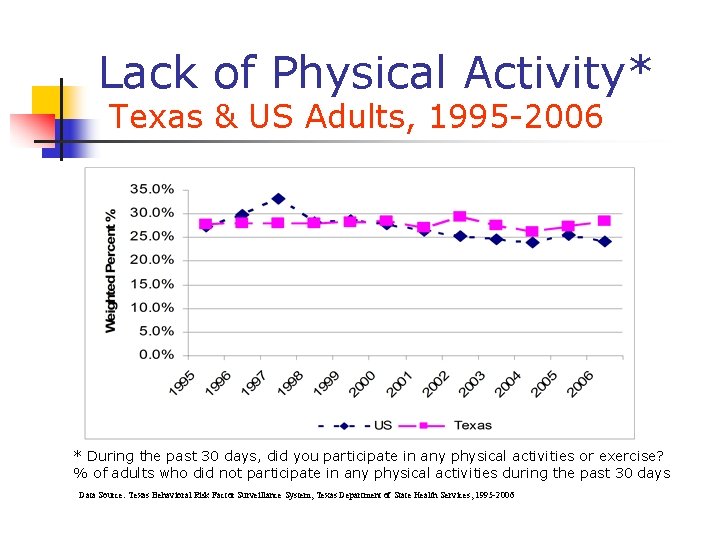
Lack of Physical Activity* Texas & US Adults, 1995 -2006 * During the past 30 days, did you participate in any physical activities or exercise? % of adults who did not participate in any physical activities during the past 30 days Data Source: Texas Behavioral Risk Factor Surveillance System, Texas Department of State Health Services, 1995 -2006
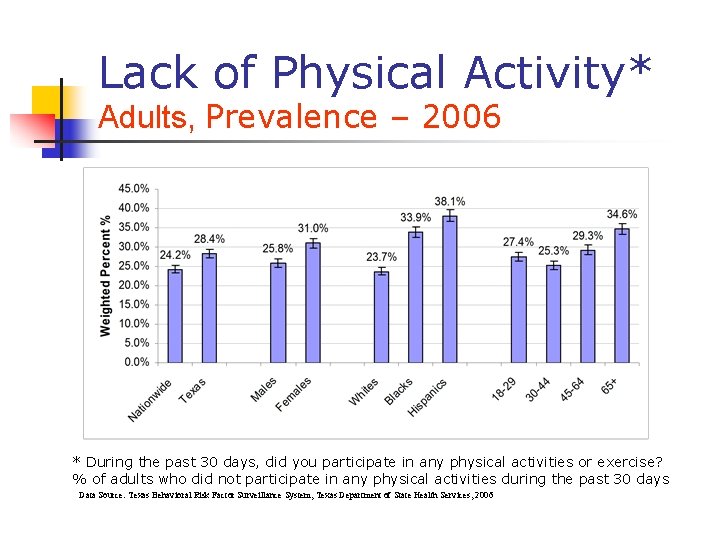
Lack of Physical Activity* Adults, Prevalence – 2006 * During the past 30 days, did you participate in any physical activities or exercise? % of adults who did not participate in any physical activities during the past 30 days Data Source: Texas Behavioral Risk Factor Surveillance System, Texas Department of State Health Services, 2006
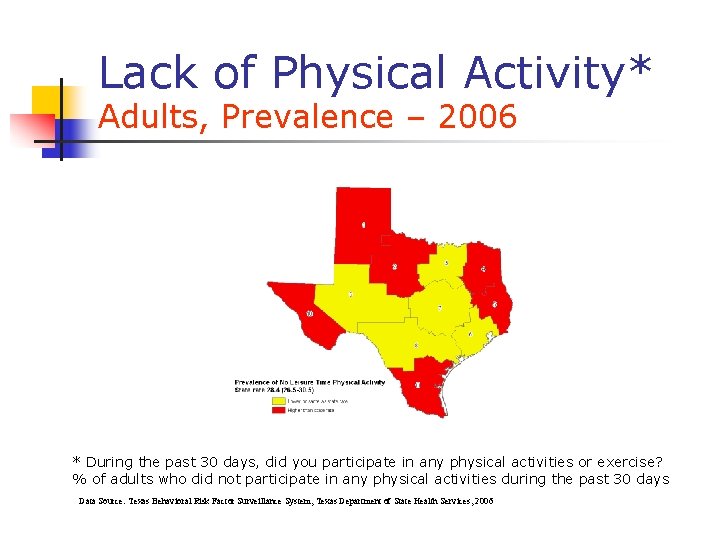
Lack of Physical Activity* Adults, Prevalence – 2006 * During the past 30 days, did you participate in any physical activities or exercise? % of adults who did not participate in any physical activities during the past 30 days Data Source: Texas Behavioral Risk Factor Surveillance System, Texas Department of State Health Services, 2006
Poor Nutrition
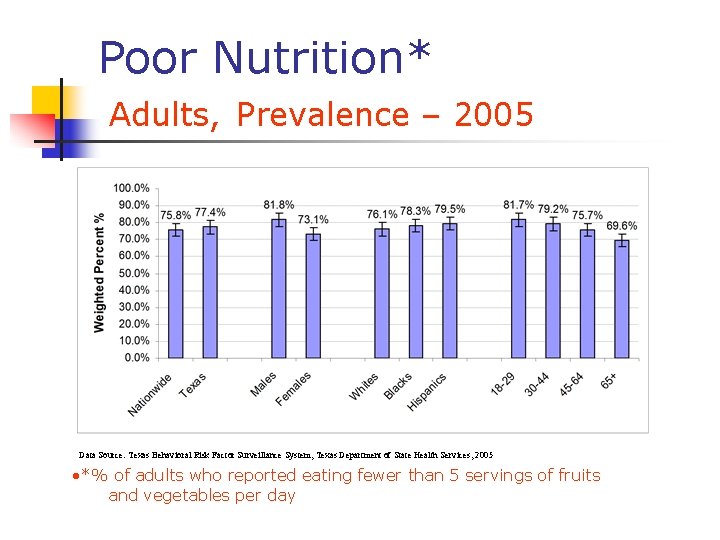
Poor Nutrition* Adults, Prevalence – 2005 Data Source: Texas Behavioral Risk Factor Surveillance System, Texas Department of State Health Services, 2005 • *% of adults who reported eating fewer than 5 servings of fruits and vegetables per day
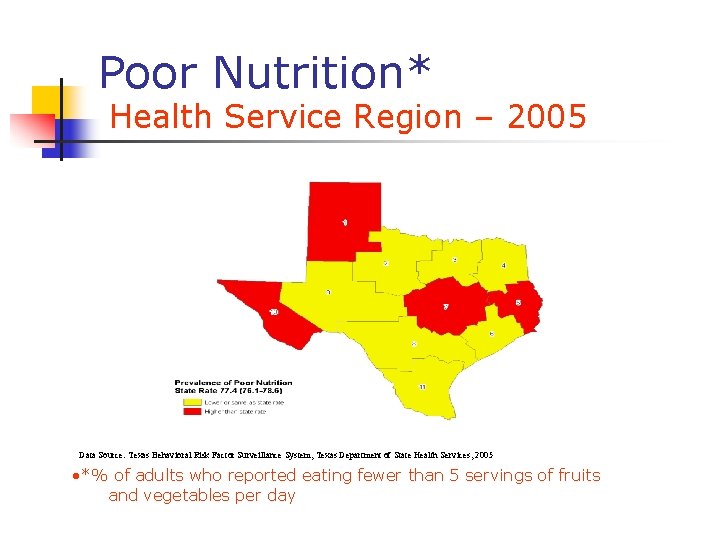
Poor Nutrition* Health Service Region – 2005 Data Source: Texas Behavioral Risk Factor Surveillance System, Texas Department of State Health Services, 2005 • *% of adults who reported eating fewer than 5 servings of fruits and vegetables per day
Nutrition* Public High School Students – 2001, 2005 Data Source: Texas Behavioral Risk Factor Surveillance System, Texas Department of State Health Services, 2005 • *% of students who reported eating 5 or more servings of fruits and vegetables per day
Medical Risk Factors Diabetes High Cholesterol High Blood Pressure
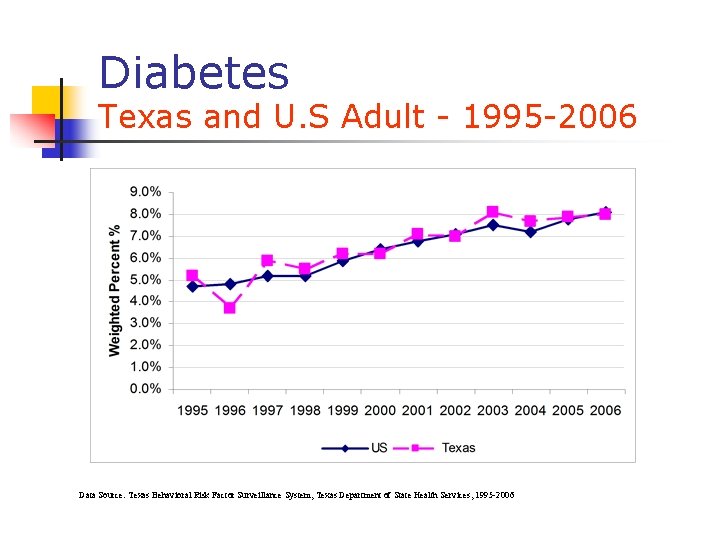
Diabetes Texas and U. S Adult - 1995 -2006 Data Source: Texas Behavioral Risk Factor Surveillance System, Texas Department of State Health Services, 1995 -2006
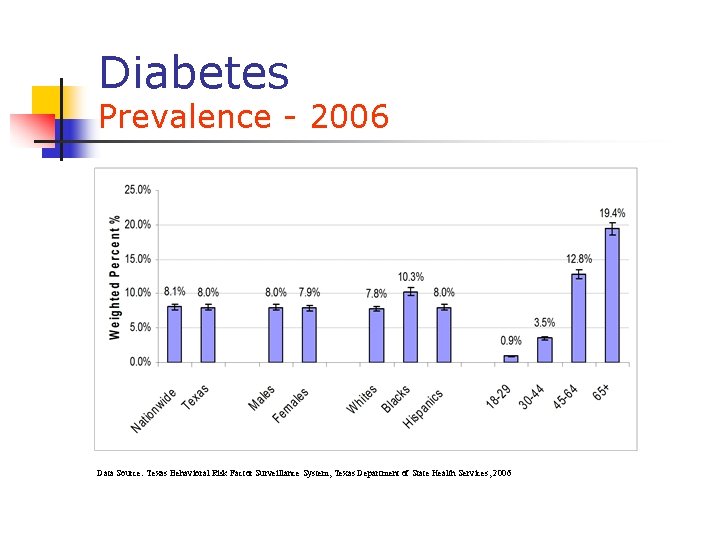
Diabetes Prevalence - 2006 Data Source: Texas Behavioral Risk Factor Surveillance System, Texas Department of State Health Services, 2006
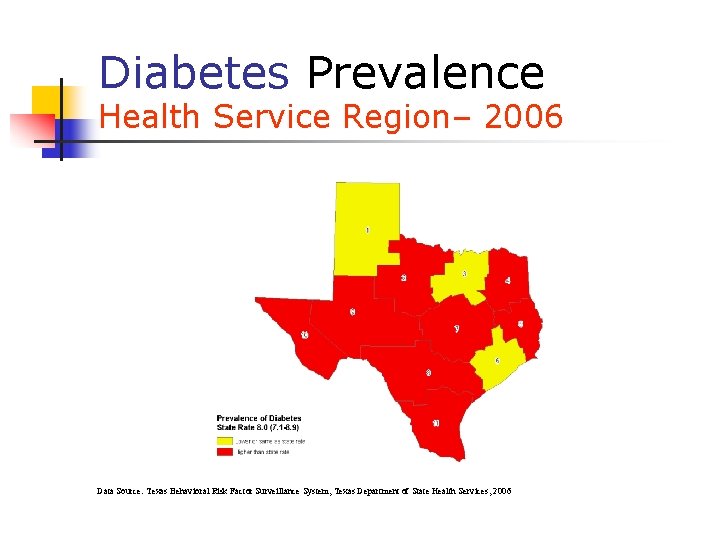
Diabetes Prevalence Health Service Region– 2006 Data Source: Texas Behavioral Risk Factor Surveillance System, Texas Department of State Health Services, 2006
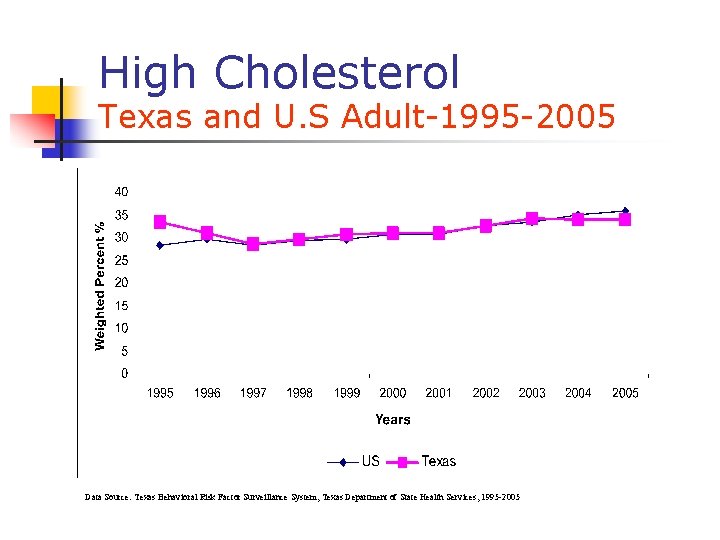
High Cholesterol Texas and U. S Adult-1995 -2005 Data Source: Texas Behavioral Risk Factor Surveillance System, Texas Department of State Health Services, 1995 -2005
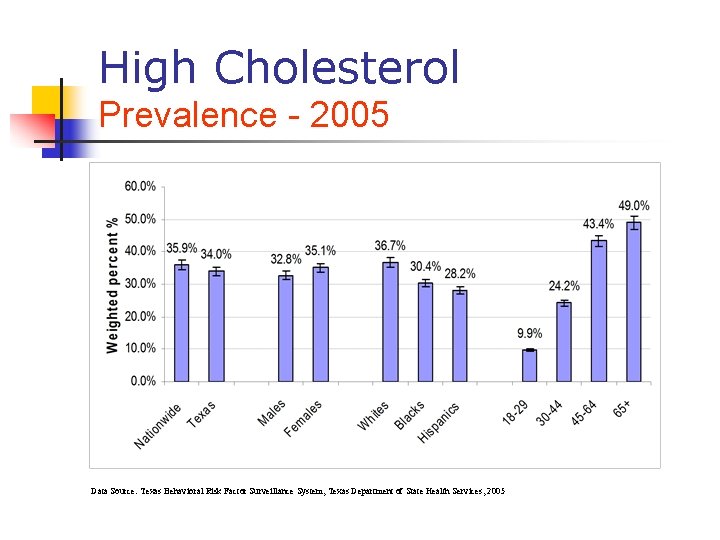
High Cholesterol Prevalence - 2005 Data Source: Texas Behavioral Risk Factor Surveillance System, Texas Department of State Health Services, 2005
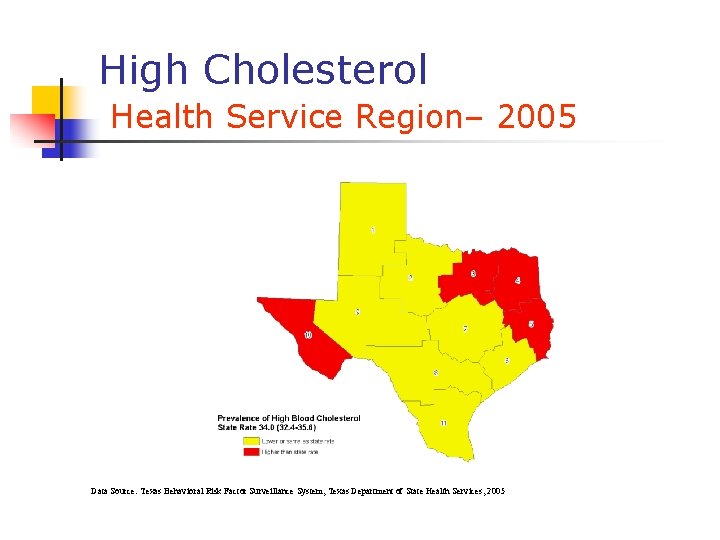
High Cholesterol Health Service Region– 2005 Data Source: Texas Behavioral Risk Factor Surveillance System, Texas Department of State Health Services, 2005
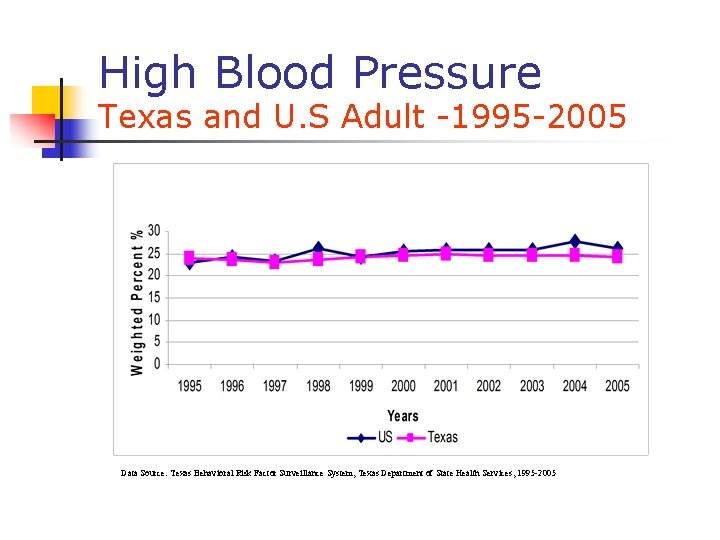
High Blood Pressure Texas and U. S Adult -1995 -2005 Data Source: Texas Behavioral Risk Factor Surveillance System, Texas Department of State Health Services, 1995 -2005
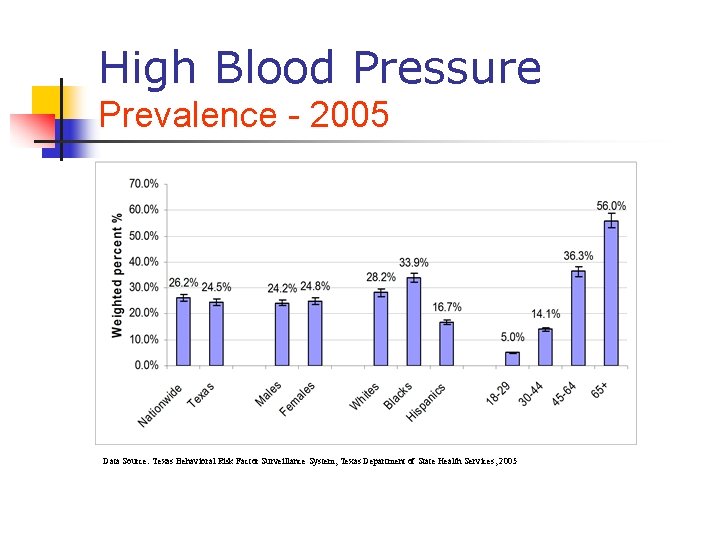
High Blood Pressure Prevalence - 2005 Data Source: Texas Behavioral Risk Factor Surveillance System, Texas Department of State Health Services, 2005
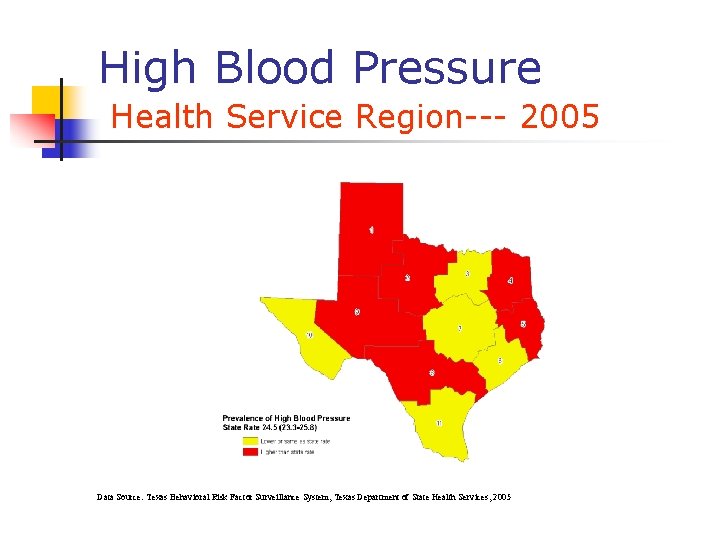
High Blood Pressure Health Service Region--- 2005 Data Source: Texas Behavioral Risk Factor Surveillance System, Texas Department of State Health Services, 2005
Health Plan Employer Data and Information Set
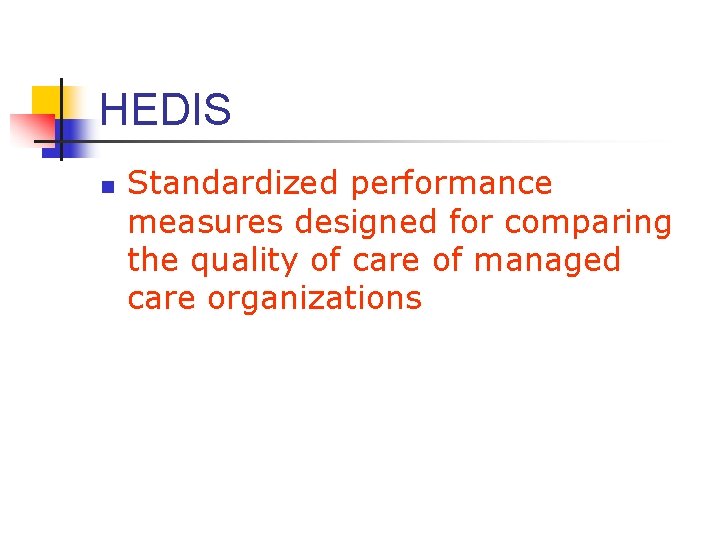
HEDIS n Standardized performance measures designed for comparing the quality of care of managed care organizations
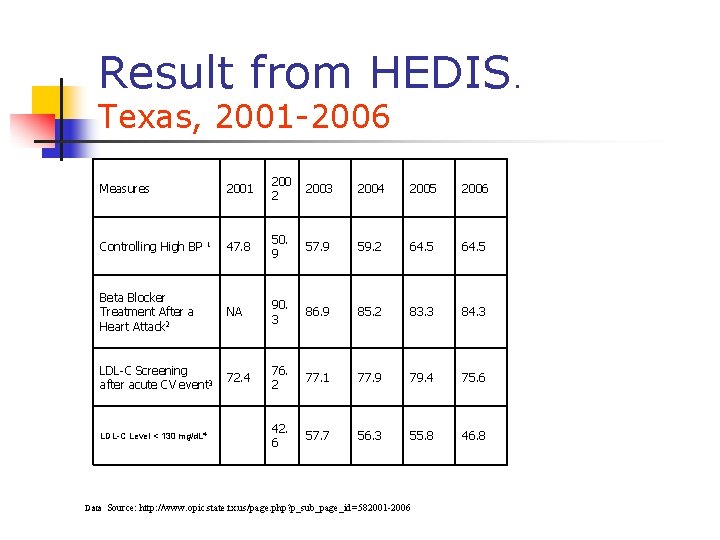
Result from HEDIS. Texas, 2001 -2006 2001 200 2 2003 2004 2005 2006 47. 8 50. 9 57. 9 59. 2 64. 5 Beta Blocker Treatment After a Heart Attack 2 NA 90. 3 86. 9 85. 2 83. 3 84. 3 LDL-C Screening after acute CV event 3 72. 4 76. 2 77. 1 77. 9 79. 4 75. 6 42. 6 57. 7 56. 3 55. 8 46. 8 Measures Controlling High BP LDL-C Level < 130 mg/d. L 4 1 Data Source: http: //www. opic. state. tx. us/page. php? p_sub_page_id=582001 -2006
STRATEGIES n n Surveillance, Data and Outcome Management Health Education and Outreach Clinical Prevention and Treatment Services Community Policy and Environmental Changes