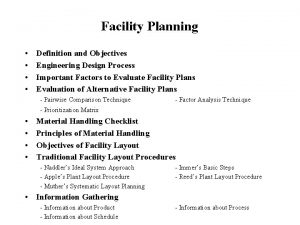
CAPACITY PLANNING FOR PRODUCTS AND SERVICES FACILITY PLANNING



- Slides: 68
CAPACITY PLANNING FOR PRODUCTS AND SERVICES
FACILITY PLANNING Facility planning answers: Ø What kind of capacity is needed? Ø How much capacity is needed to match demand? Ø When more capacity is needed? Ø Where facilities should be located (location) Ø How facilities should be arranged (layout)
CAPACITY (DEFINITION OF) ØThe number of units a facility can hold, receive, store or produce in a period of time ØIt is the upper limit or ceiling on the load that an operating unit can handle. It includes Ø equipment, Ø space, Ø employee skills
STRATEGIC CAPACITY PLANNING Ø Goal ØTo achieve a match between the long-term supply capabilities of an organization and the predicted level of long-run demand ØOvercapacity operating costs that are too high ØUndercapacity strained resources and possible loss of customers
CAPACITY PLANNING QUESTIONS ØKey Questions: ØWhat kind of capacity is needed? ØHow much capacity is needed to match demand? ØWhen is it needed? ØRelated Questions: ØHow much will it cost? ØWhat are the potential benefits and risks? ØAre there sustainability issues? ØShould capacity be changed all at once, or through several smaller changes ØCan the supply chain handle the necessary changes?
ISSUES TO BE CONSIDERED IN STRATEGY FORMULATION ØCapacity strategy ØDemand patterns ØGrowth rate and variability ØFacilities Ø (Cost of the building and operating) ØTechnological changes Ø (Rate and direction of technology changes) ØBehavior of competitors ØAvailability of capital and other inputs.
TYPES OF PLANNING OVER A TIME HORIZON Long Range Planning Intermediate Range Planning Add Facilities Add long lead time equipment * Sub-Contract Add Equipment Add Shifts * Short Range Planning *Limited options exist Add Personnel Build or Use Inventory Modify Capacity Schedule Jobs Schedule Personnel Allocate. Machinery Use Capacity
IMPORTANCE OF CAPACITY DECISIONS 1. impact the ability of the organization to meet future demands 2. affect operating costs 3. affect lead time responsiveness 4. are a major determinant of initial costs 5. involve long-term commitment of resources 6. affect competitiveness 7. affect ease of management 8. are more important and complex due to globalization 9. need to be planned for in advance due to their consumption of financial and other resources
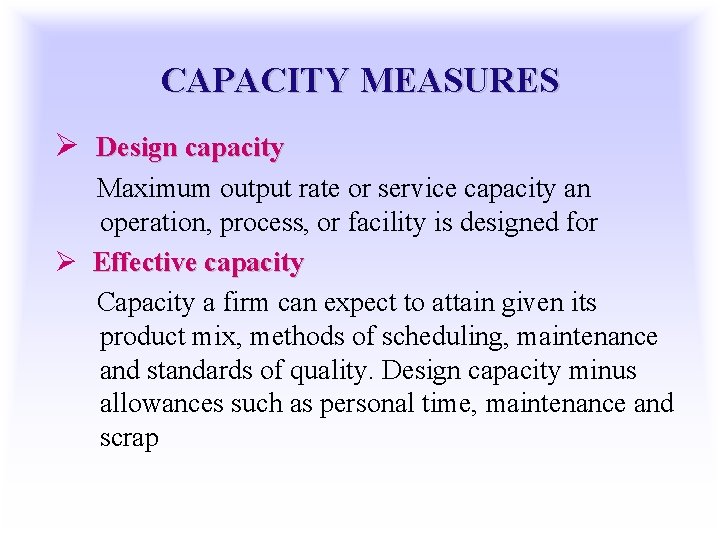
CAPACITY MEASURES Ø Design capacity Maximum output rate or service capacity an operation, process, or facility is designed for Ø Effective capacity Capacity a firm can expect to attain given its product mix, methods of scheduling, maintenance and standards of quality. Design capacity minus allowances such as personal time, maintenance and scrap
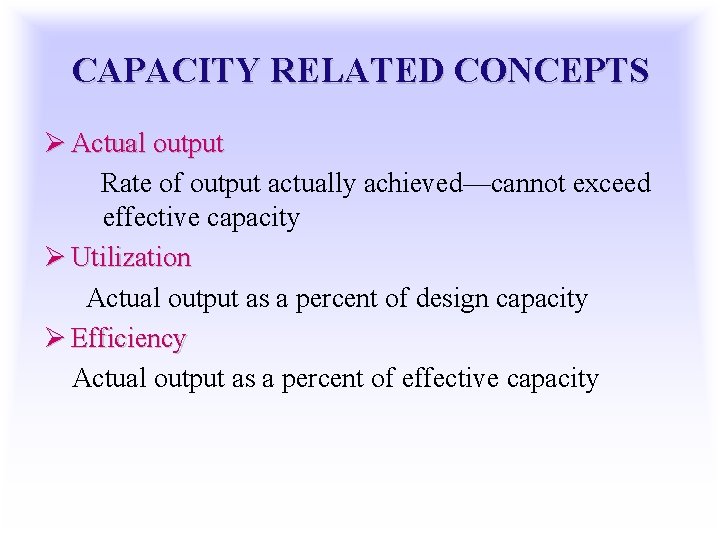
CAPACITY RELATED CONCEPTS Ø Actual output Rate of output actually achieved—cannot exceed effective capacity Ø Utilization Actual output as a percent of design capacity Ø Efficiency Actual output as a percent of effective capacity
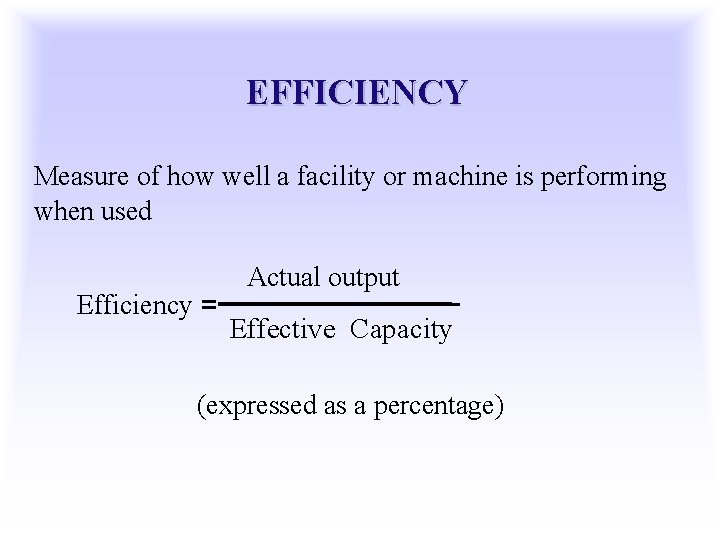
EFFICIENCY Measure of how well a facility or machine is performing when used Efficiency = Actual output Effective Capacity (expressed as a percentage)
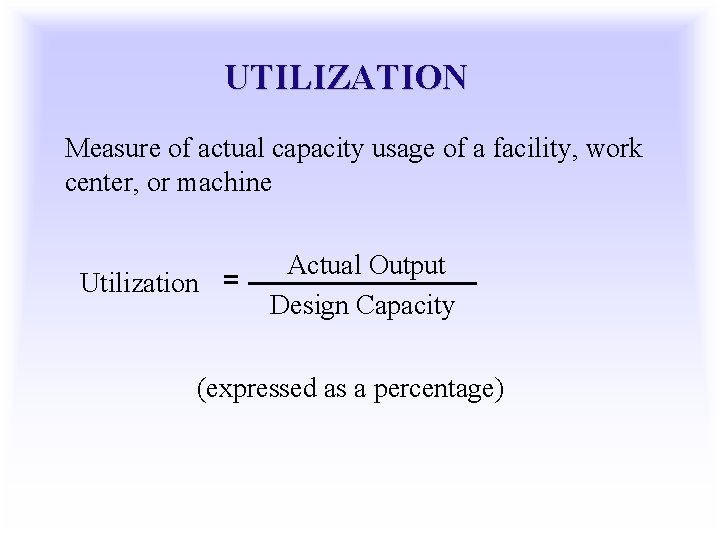
UTILIZATION Measure of actual capacity usage of a facility, work center, or machine Utilization = Actual Output Design Capacity (expressed as a percentage)
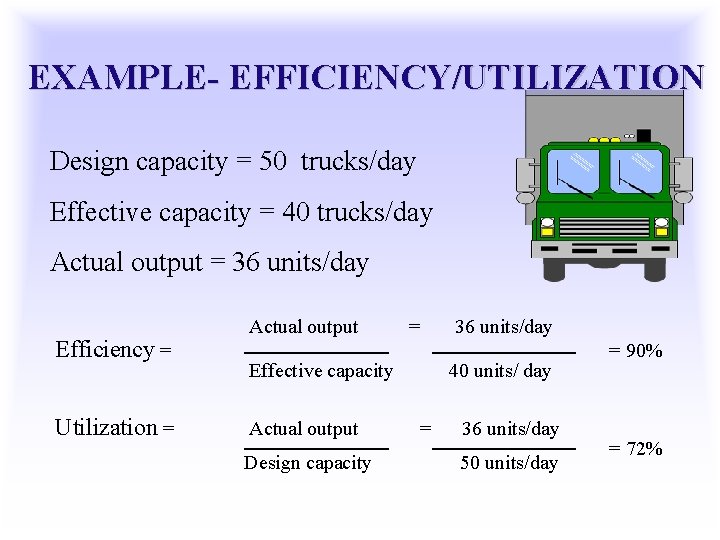
EXAMPLE- EFFICIENCY/UTILIZATION Design capacity = 50 trucks/day Effective capacity = 40 trucks/day Actual output = 36 units/day Efficiency = Utilization = Actual output = 36 units/day Effective capacity Actual output Design capacity 40 units/ day = 36 units/day 50 units/day = 90% = 72%
DETERMINANTS OF EFFECTIVE CAPACITY ØFacilities ØProduct and Service Factors ØProcess Factors ØHuman Factors ØPolicy Factors ØOperational Factors ØSupply Chain Factors ØExternal Factors
STRATEGY FORMULATION Strategies are typically based on assumptions and predictions about: ØLong-term demand patterns ØTechnological change ØCompetitor behavior
SPECIAL REQUIREMENTS FOR MAKING GOOD CAPACITY DECISIONS Ø Forecasting the demand accurately Ø Understanding the technology and capacity increments Ø Finding the optimal operating level (volume) Ø Building for change
KEY DECISIONS IN CAPACITY PLANNING Ø Ø Ø Amount of capacity needed Timing of changes (frequency of capacity additions) Extent of flexibility of facilities External sources of capacity Need to maintain balance
AMOUNT OF CAPACITY NEEDED
STEPS OF CAPACITY PLANNING Ø Estimate future capacity requirements Ø Evaluate existing capacity and facilities and identify gaps Ø Identify alternatives for meeting requirements Ø Conduct financial analysis Ø Assess key qualitative issues Ø Select the best alternative for the long term Ø Implement the alternative chosen Ø Monitor results
FORECASTING CAPACITY REQUIREMENTS ØLong-term considerations relate to overall level of capacity requirements ØShort-term considerations relate to probable variations in capacity requirements
CALCULATING PROCESSING REQUIREMENTS Ø Forecast sales within each individual product line Ø Calculate equipment and labor requirements to meet the forecasts
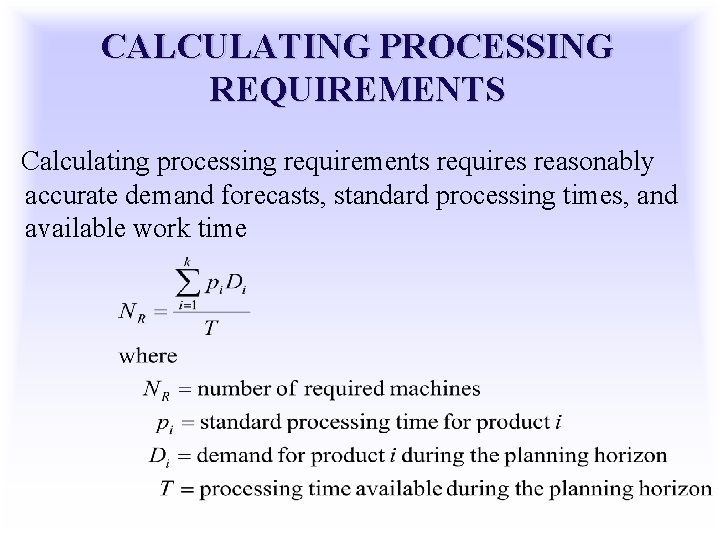
CALCULATING PROCESSING REQUIREMENTS Calculating processing requirements requires reasonably accurate demand forecasts, standard processing times, and available work time
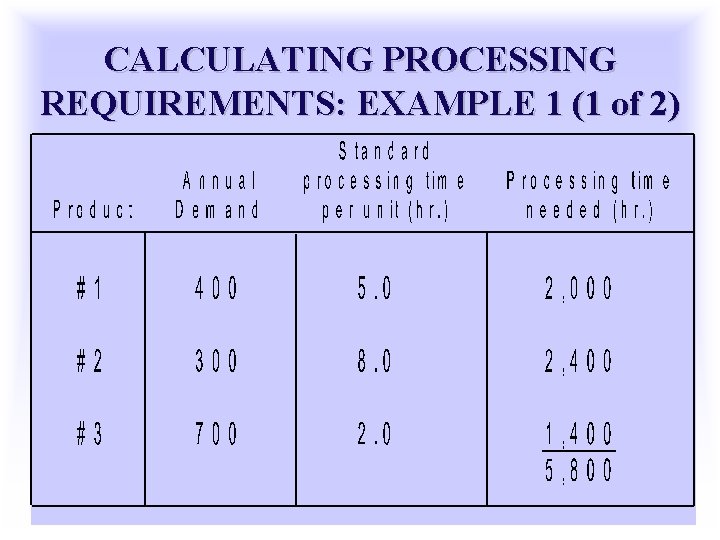
CALCULATING PROCESSING REQUIREMENTS: EXAMPLE 1 (1 of 2)
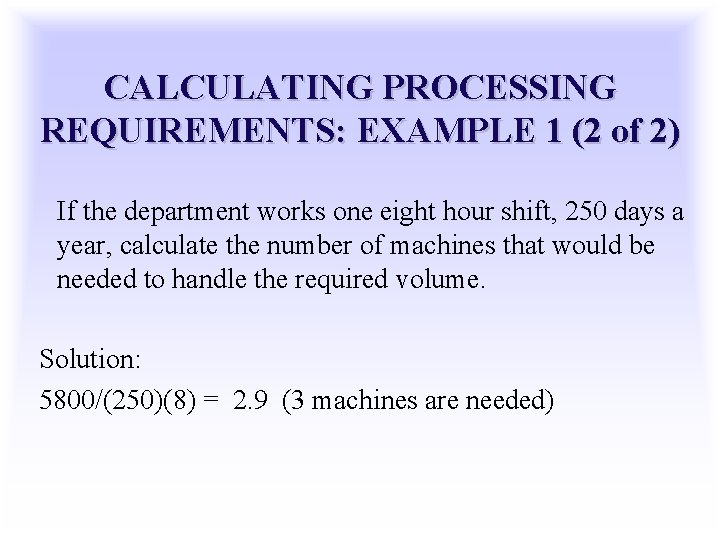
CALCULATING PROCESSING REQUIREMENTS: EXAMPLE 1 (2 of 2) If the department works one eight hour shift, 250 days a year, calculate the number of machines that would be needed to handle the required volume. Solution: 5800/(250)(8) = 2. 9 (3 machines are needed)
CAPACITY CUSHION Ø Capacity Cushion ØExtra capacity used to offset demand uncertainty ØCapacity cushion = 100% - Utilization ØCapacity cushion strategy ØOrganizations that have greater demand uncertainty typically have greater capacity cushion ØOrganizations that have standard products and services generally have greater capacity cushion
SERVICE CAPACITY PLANNING Ø Service capacity planning can present a number of challenges related to: ØThe inability to store services ØThe need to be near customer ØThe degree of demand volatility
SERVICE CAPACITY PLANNING Ø Time: Inability to store services for later consumption. Capacity must be available to provide a service when it is needed (capacity must be matched with the timing of demand) Ø Location: Need to be near customers for convenience. Capacity and location are closely tied. Service goods must be at the customer demand point and capacity must be located near the customer Ø Volatility of Demand: (Much greater than in manufacturing) Ø Volume and timing of demand Ø Time required to service individual customers
CAPACITY UTILIZATION & SERVICE QUALITY · Best operating point is near 70% of capacity · From 70% to 100% of service capacity, what do you think happens to service quality?
TIMING AND SIZE OF CHANGES (FREQUENCY OF CAPACITY ADDITIONS)
CAPACITY EXPANSION Factors to be considered: Ø Volume Ø Ø and certainty of anticipated demand Strategic objectives for growth Costs of expansion and operation Incremental or one-step expansion Frequency of capacity additions
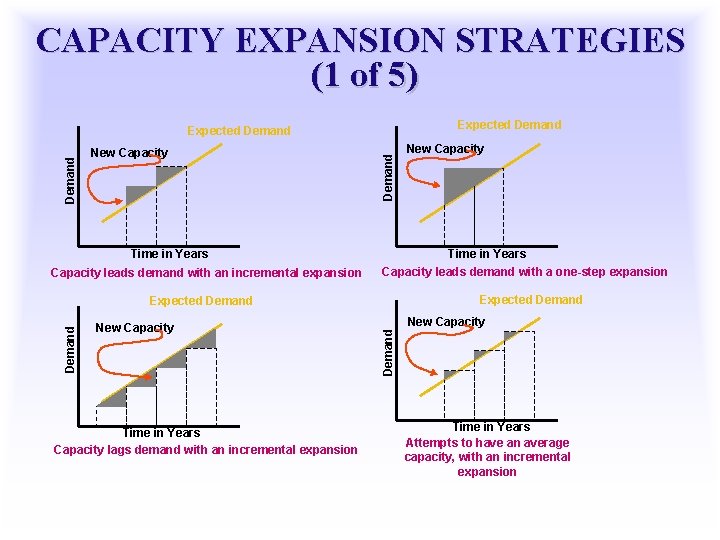
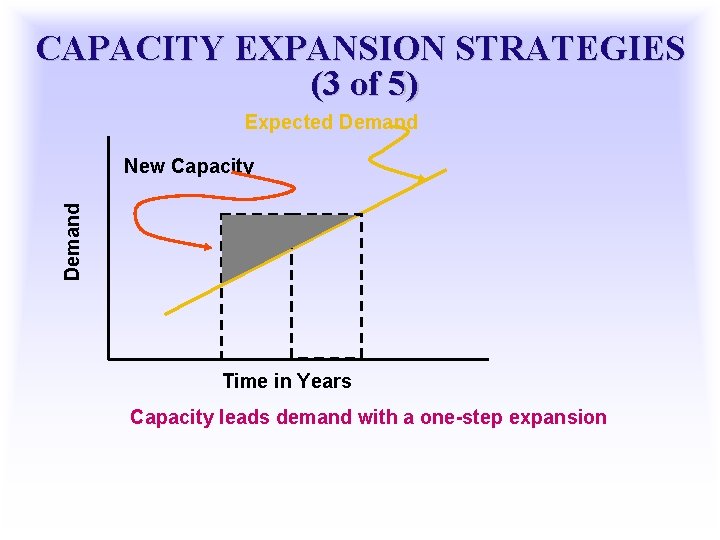
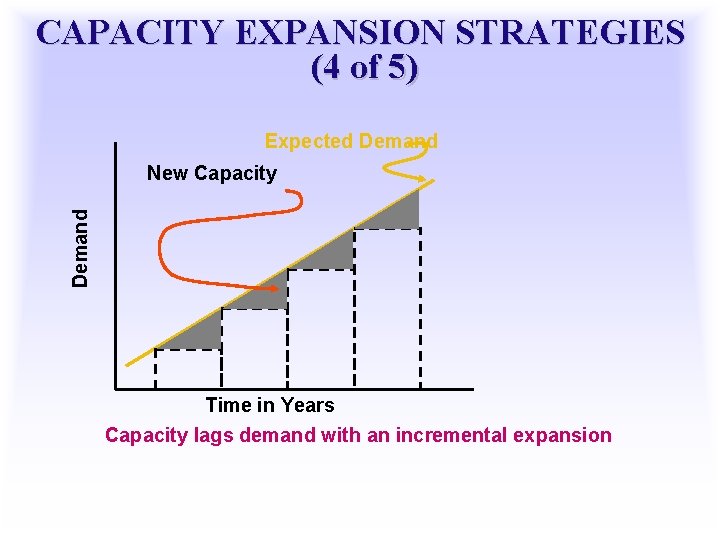
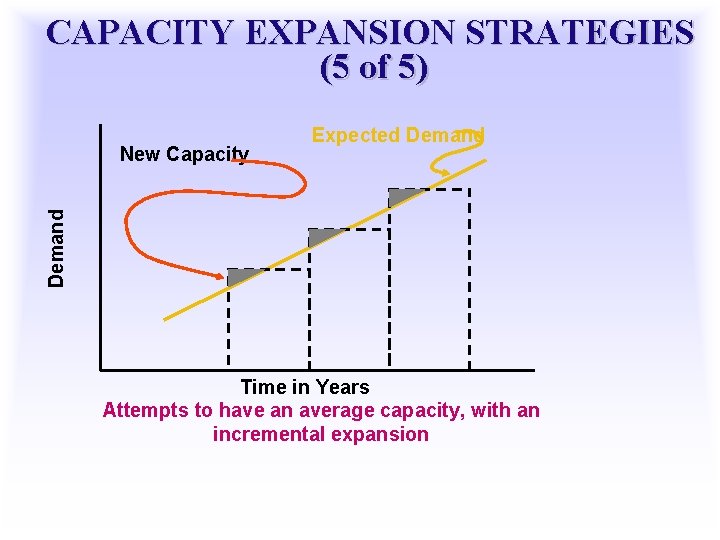
CAPACITY EXPANSION STRATEGIES (1 of 5) Expected Demand New Capacity Time in Years Capacity leads demand with an incremental expansion Demand Expected Demand Time in Years Capacity leads demand with a one-step expansion Expected Demand Time in Years Capacity lags demand with an incremental expansion New Capacity Demand Expected Demand New Capacity Time in Years Attempts to have an average capacity, with an incremental expansion
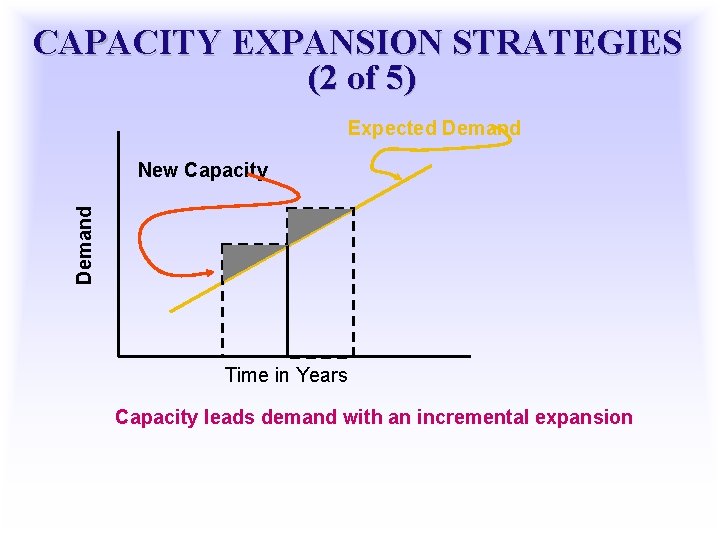
CAPACITY EXPANSION STRATEGIES (2 of 5) Expected Demand New Capacity Time in Years Capacity leads demand with an incremental expansion
CAPACITY EXPANSION STRATEGIES (3 of 5) Expected Demand New Capacity Time in Years Capacity leads demand with a one-step expansion
CAPACITY EXPANSION STRATEGIES (4 of 5) Expected Demand New Capacity Time in Years Capacity lags demand with an incremental expansion
CAPACITY EXPANSION STRATEGIES (5 of 5) Demand New Capacity Expected Demand Time in Years Attempts to have an average capacity, with an incremental expansion
MAKE OR BUY? 1. 2. 3. 4. 5. 6. Available capacity Expertise Quality considerations Nature of demand Cost Risk
OPTIMAL OPERATING LEVEL
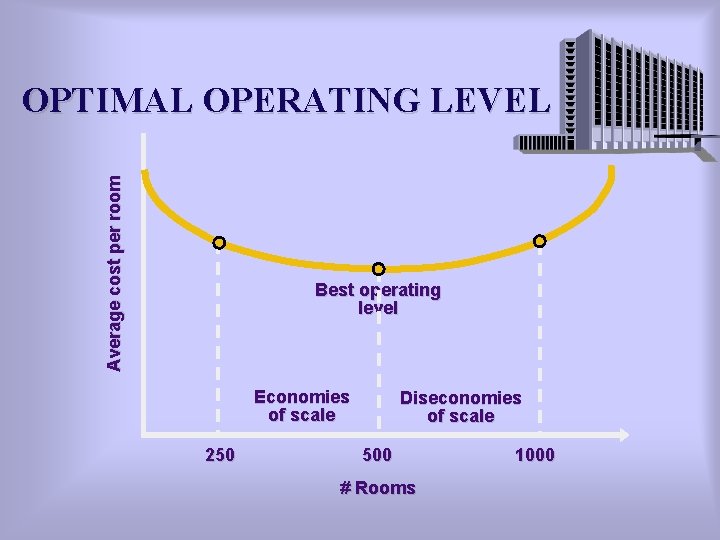
Average cost per room OPTIMAL OPERATING LEVEL Best operating level Economies of scale 250 Diseconomies of scale 500 # Rooms 1000
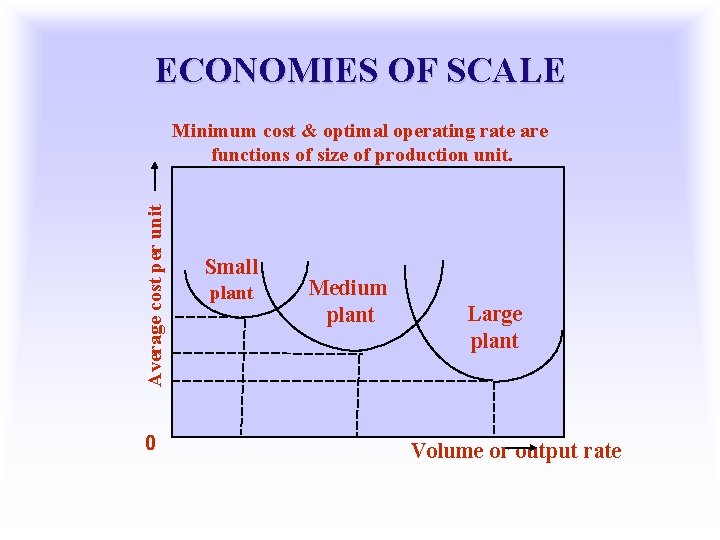
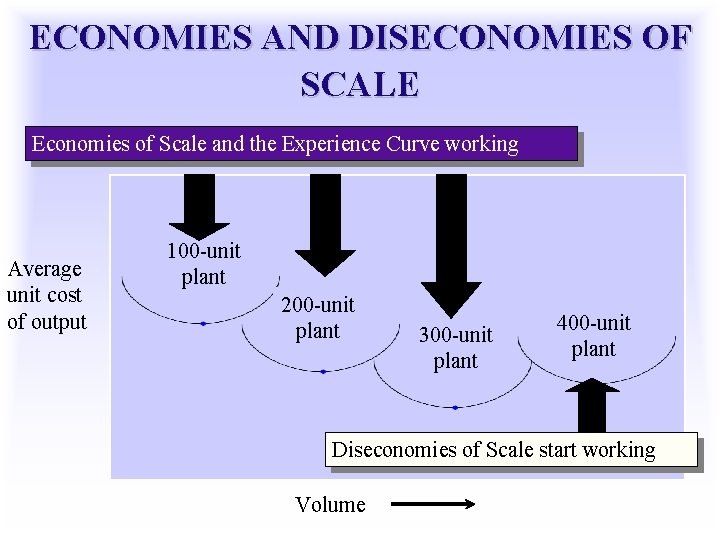
ECONOMIES OF SCALE Ø Economies of scale If the output rate is less than the optimal level, increasing output rate results in decreasing average unit costs Reasons for economies of scale: Ø Fixed costs are spread over a larger number of units Ø Construction costs increase at a decreasing rate as facility size increases Ø Processing costs decrease due to standardization
DISECONOMIES OF SCALE Ø Diseconomies of scale Ø If the output rate is more than the optimal level, increasing the output rate results in increasing average unit costs Reasons for diseconomies of scale Ø Distribution costs increase due to traffic congestion and shipping from a centralized facility rather than multiple smaller facilities Ø Complexity increases costs Ø Inflexibility can be an issue Ø Additional levels of bureaucracy
ECONOMIES OF SCALE Average cost per unit Minimum cost & optimal operating rate are functions of size of production unit. 0 Small plant Medium plant Large plant Volume or output rate
ECONOMIES AND DISECONOMIES OF SCALE Economies of Scale and the Experience Curve working Average unit cost of output 100 -unit plant 200 -unit plant 300 -unit plant 400 -unit plant Diseconomies of Scale start working Volume
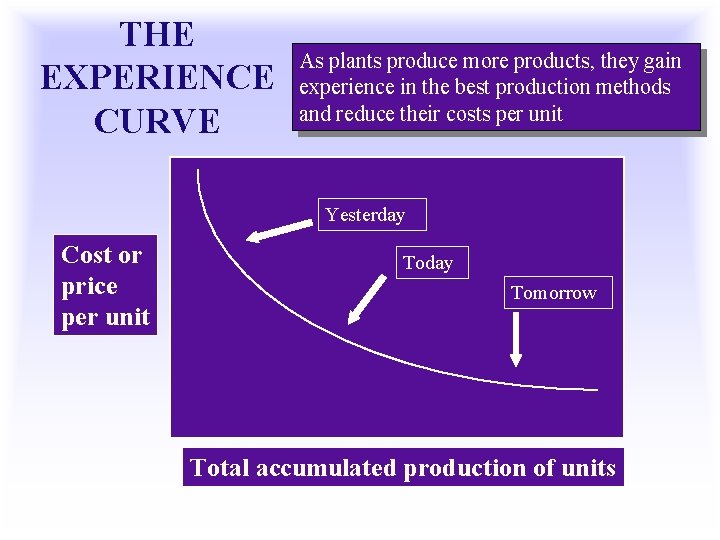
THE EXPERIENCE CURVE As plants produce more products, they gain experience in the best production methods and reduce their costs per unit Yesterday Cost or price per unit Today Tomorrow Total accumulated production of units
EXTERNAL SOURCES OF CAPACITY
IN-HOUSE OR OURSOURCE? ØOnce capacity requirements are determined, the organization must decide whether to produce a good or service itself or outsource ØFactors to consider: ØAvailable capacity ØExpertise ØQuality considerations ØThe nature of demand ØCost ØRisks
NEED TO MAINTAIN BALANCE
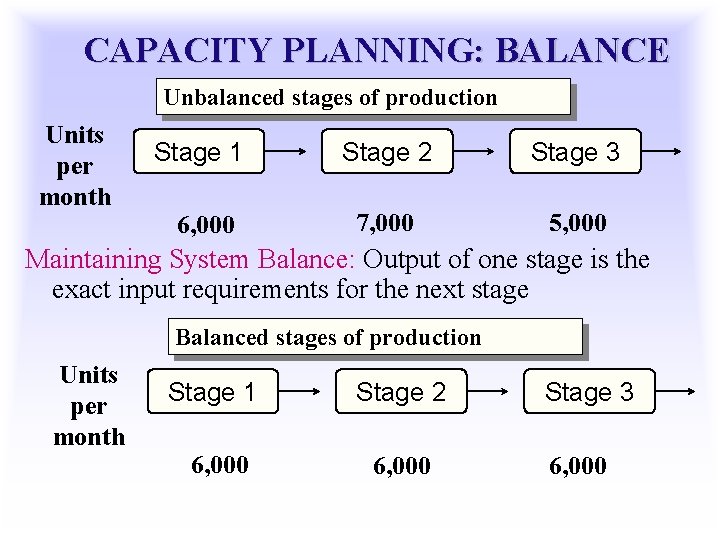
CAPACITY PLANNING: BALANCE Unbalanced stages of production Units per month Stage 1 Stage 2 Stage 3 6, 000 7, 000 5, 000 Maintaining System Balance: Output of one stage is the exact input requirements for the next stage Balanced stages of production Units per month Stage 1 Stage 2 6, 000 Stage 3 6, 000
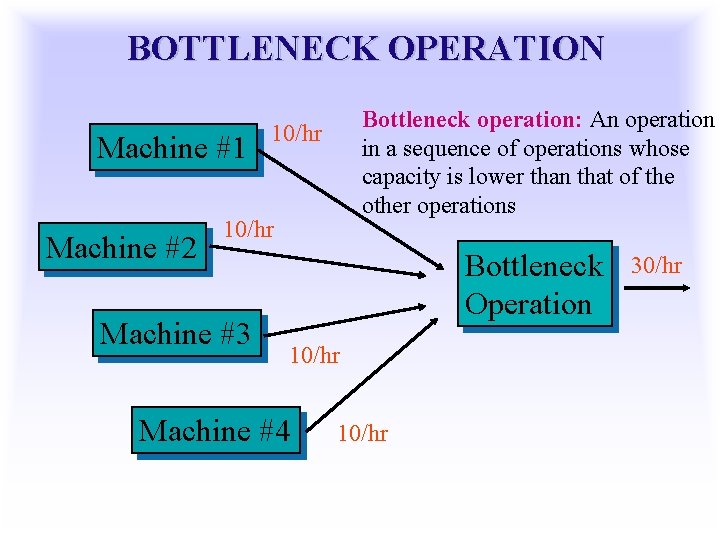
BOTTLENECK OPERATION Machine #1 Machine #2 Bottleneck operation: An operation in a sequence of operations whose capacity is lower than that of the other operations 10/hr Machine #3 Bottleneck Operation 10/hr Machine #4 10/hr 30/hr
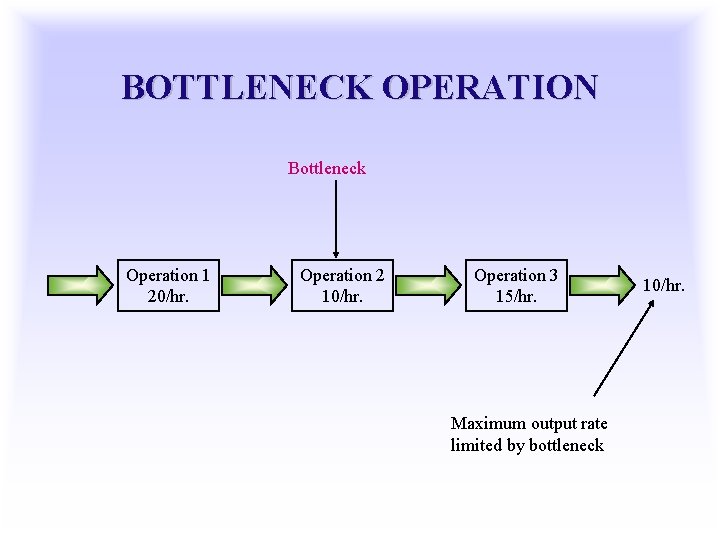
BOTTLENECK OPERATION Bottleneck Operation 1 20/hr. Operation 2 10/hr. Operation 3 15/hr. Maximum output rate limited by bottleneck 10/hr.
CONSTRAINT MANAGEMENT ØConstraint Something that limits the performance of a process or system in achieving its goals ØCategories ØMarket ØResource ØMaterial ØFinancial ØKnowledge or competency ØPolicy
RESOLVING CONSTRAINT ISSUES Ø Identify the most pressing constraint Ø Change the operation to achieve maximum benefit, given the constraint Ø Make sure other portions of the process are supportive of the constraint Ø Explore and evaluate ways to overcome the constraint Ø Repeat the process until the constraint levels are at acceptable levels
STRATEGIES FOR MATCHING CAPACITY TO DEMAND
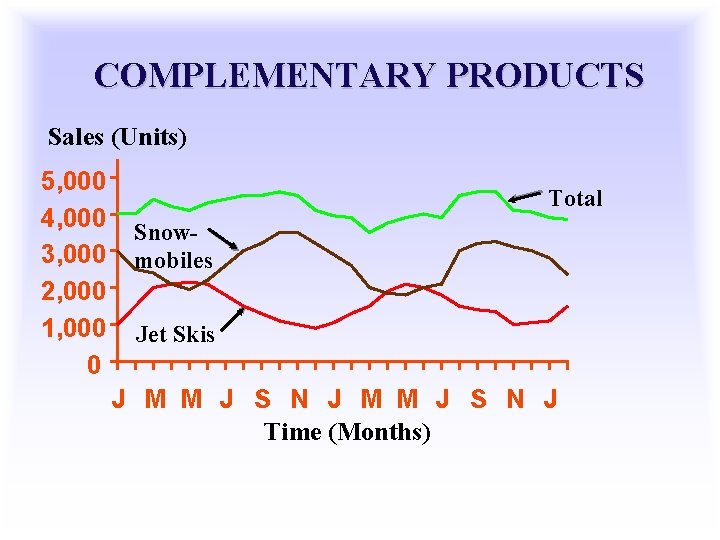
DEMAND MANAGEMENT STRATEGIES ØStrategies used to offset capacity limitations and that are intended to achieve a closer match between supply and demand Ø Pricing Ø Promotions Ø Backorders Ø Offering complementary products Ø Discounts Ø Other tactics to shift demand from peak periods into slow periods
COMPLEMENTARY PRODUCTS Sales (Units) 5, 000 4, 000 3, 000 2, 000 1, 000 0 Total Snowmobiles Jet Skis J M M J S N J Time (Months)
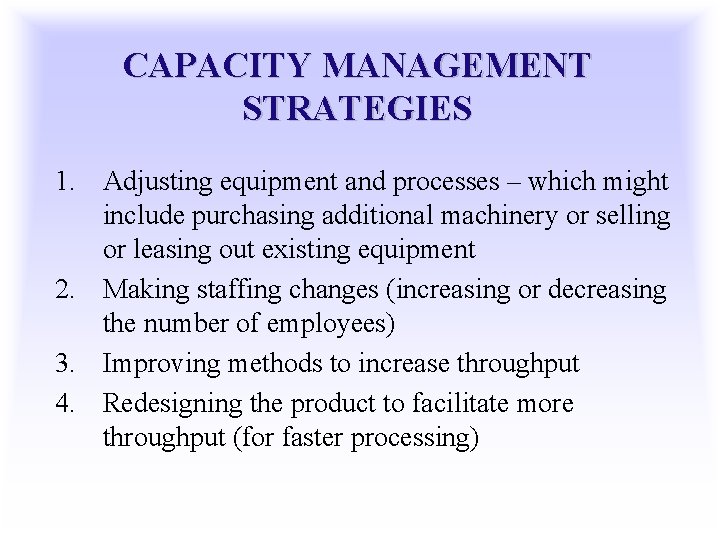
CAPACITY MANAGEMENT STRATEGIES 1. Adjusting equipment and processes – which might include purchasing additional machinery or selling or leasing out existing equipment 2. Making staffing changes (increasing or decreasing the number of employees) 3. Improving methods to increase throughput 4. Redesigning the product to facilitate more throughput (for faster processing)
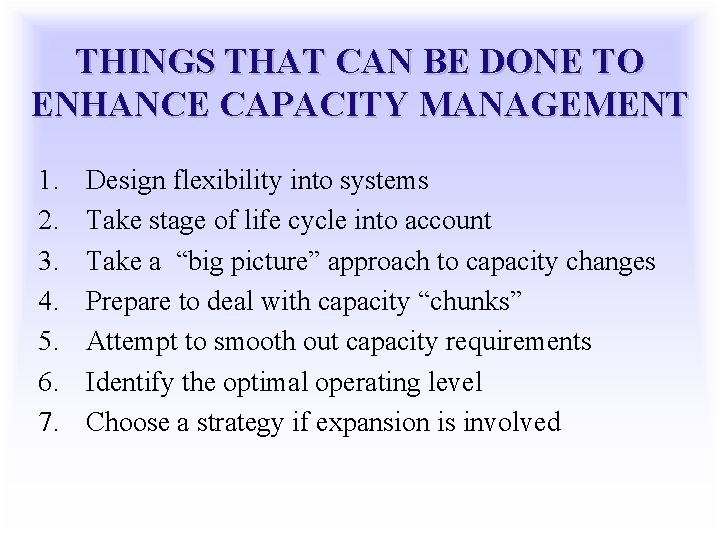
THINGS THAT CAN BE DONE TO ENHANCE CAPACITY MANAGEMENT 1. 2. 3. 4. 5. 6. 7. Design flexibility into systems Take stage of life cycle into account Take a “big picture” approach to capacity changes Prepare to deal with capacity “chunks” Attempt to smooth out capacity requirements Identify the optimal operating level Choose a strategy if expansion is involved
CAPACITY FLEXIBILITY
CAPACITY FLEXIBILITY Ø Flexible plants Ø Flexible processes Ø Flexible workers
EVALUATING ALTERNATIVES Alternatives should be evaluated from varying perspectives ECONOMIC Ø Cost-volume analysis Ø Break-even point Ø Financial analysis Ø Cash flow Ø Present value Ø Decision theory Ø Waiting-line analysis Ø Simulation NON-ECONOMIC Ø Public opinion
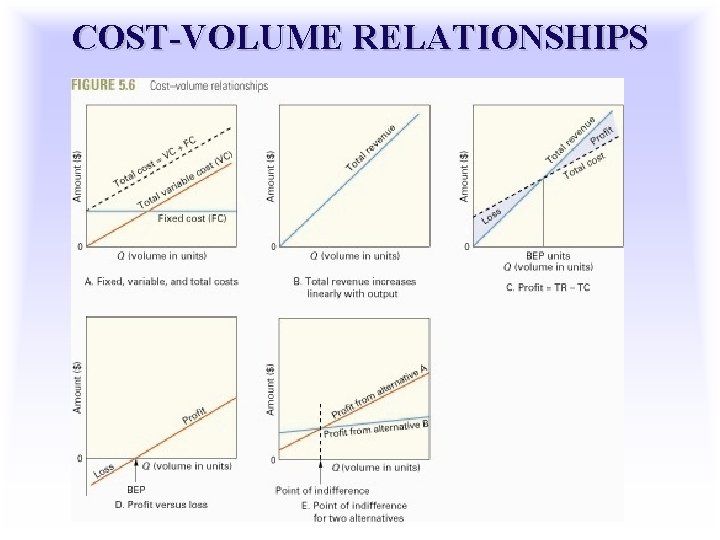
Amount ($) COST-VOLUME RELATIONSHIPS (1 OF 3) t s o lc C V = ta o T C F + le b ia ) C V ( t s co r a lv Fixed cost (FC) 0 Q (volume in units)
Amount ($) COST-VOLUME RELATIONSHIPS (2 OF 3) 0 l a ot e u n e v re T Q (volume in units)
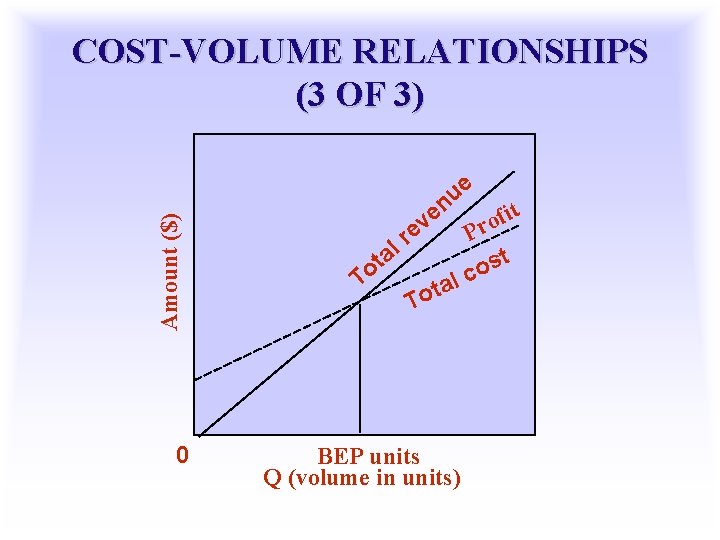
Amount ($) COST-VOLUME RELATIONSHIPS (3 OF 3) 0 e v e e u n r l a t o T t To t fi o r P st o al c BEP units Q (volume in units)
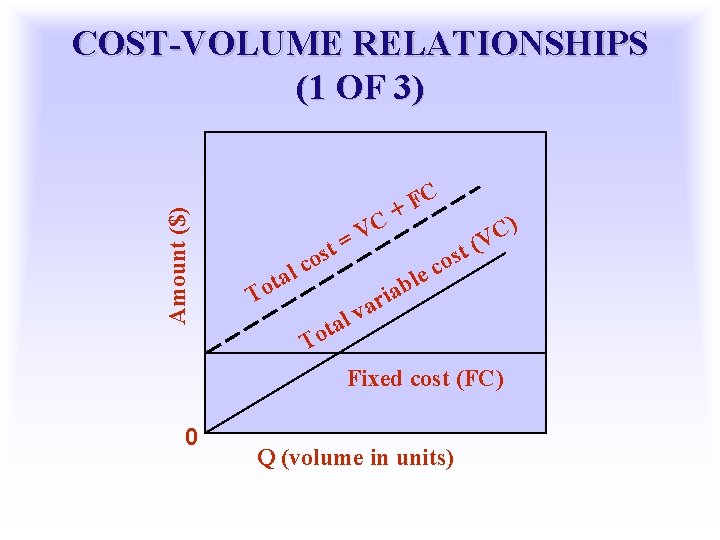
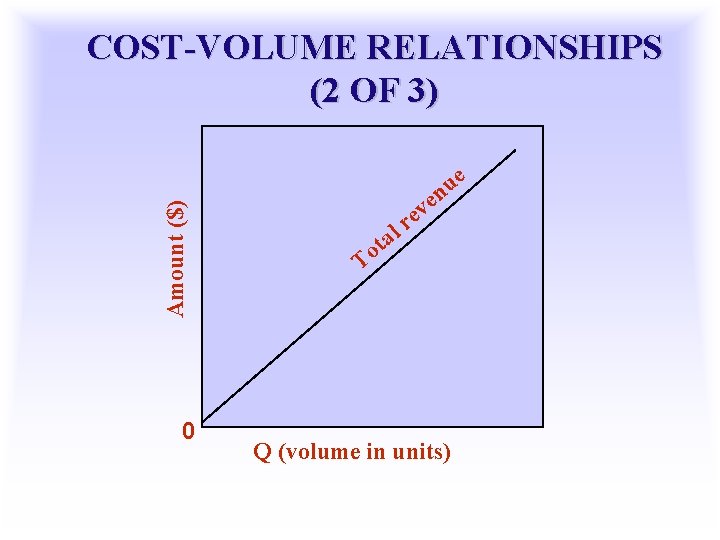
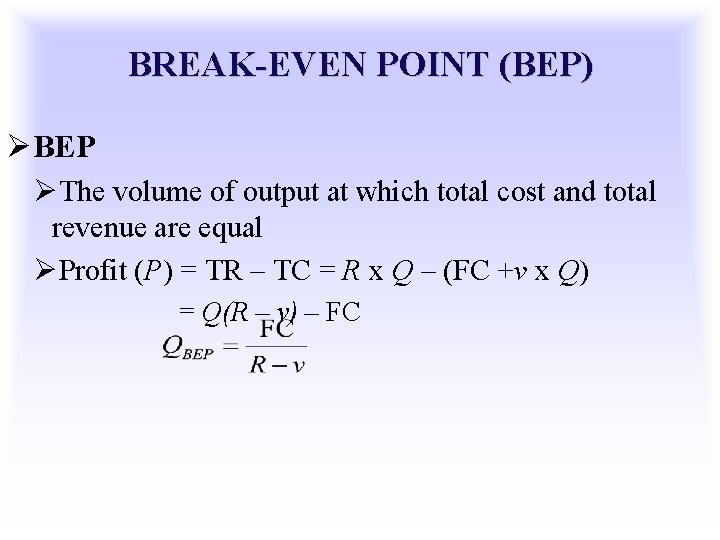
BREAK-EVEN POINT (BEP) ØBEP ØThe volume of output at which total cost and total revenue are equal ØProfit (P) = TR – TC = R x Q – (FC +v x Q) = Q(R – v) – FC
COST-VOLUME RELATIONSHIPS
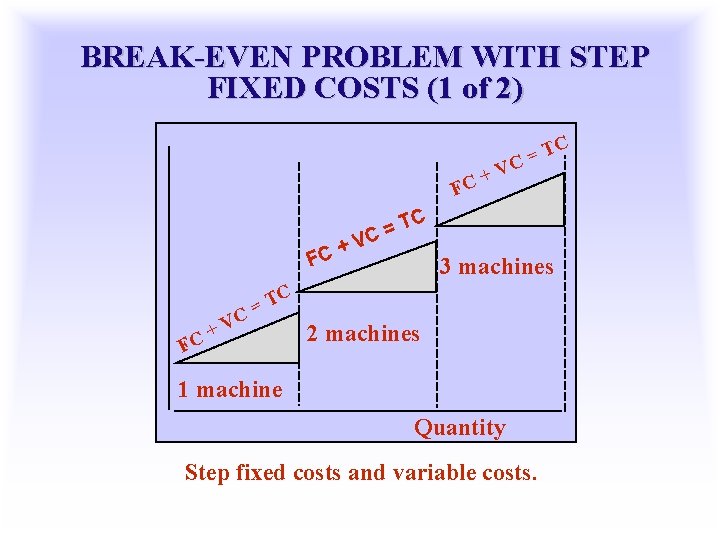
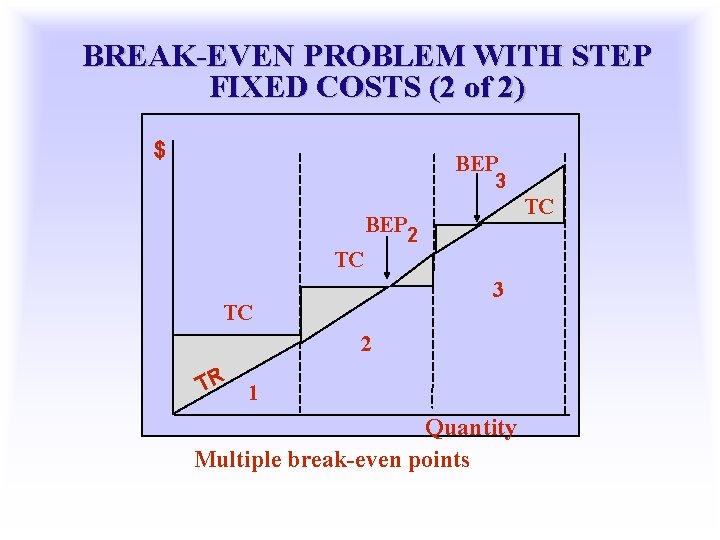
BREAK-EVEN PROBLEM WITH STEP FIXED COSTS (1 of 2) C + FC T C= V C + FC TC = C V + C F T = C V 3 machines 2 machines 1 machine Quantity Step fixed costs and variable costs.
BREAK-EVEN PROBLEM WITH STEP FIXED COSTS (2 of 2) $ BEP 3 TC BEP 2 TC 3 TC 2 TR 1 Quantity Multiple break-even points
ASSUMPTIONS OF COST-VOLUME ANALYSIS 1. One product is involved 2. Everything produced can be sold 3. Variable cost per unit is the same regardless of volume 4. Fixed costs do not change with volume 5. Revenue per unit is the same regardless of volume 6. Revenue per unit exceeds variable cost per unit
FINANCIAL ANALYSIS Ø Cash Flow the difference between cash received from sales and other sources, and cash outflow for labor, material, overhead, and taxes. Ø Present Value the sum, in current value, of all future cash flows of an investment proposal.