ASGARD AVIATION CONCEPTUAL DESIGN REVIEW Logan Waddell Morgan

- Slides: 61
ASGARD AVIATION CONCEPTUAL DESIGN REVIEW Logan Waddell Morgan Buchanan Erik Susemichel Aaron Foster Craig Wikert Adam Ata Li Tan Matt Haas 1
Outline 1. Project mission 2. Selected concept 3. Sizing code results • Modeling assumptions 4. Major Design Tradeoffs • Carpet plots 5. Aircraft description 6. Aerodynamics • • Airfoil selection High-lift devices 7. Performance • 8. Propulsion • Engine description 9. Structures • Configuration layout 10. Weights and Balance • Center of gravity location 11. Stability and Control 12. Noise 13. Cost 14. Summary V-n diagram 2
Mission Statement To design an environmentally responsible aircraft that sufficiently completes the “N+2” requirements for the NASA green aviation challenge. 3
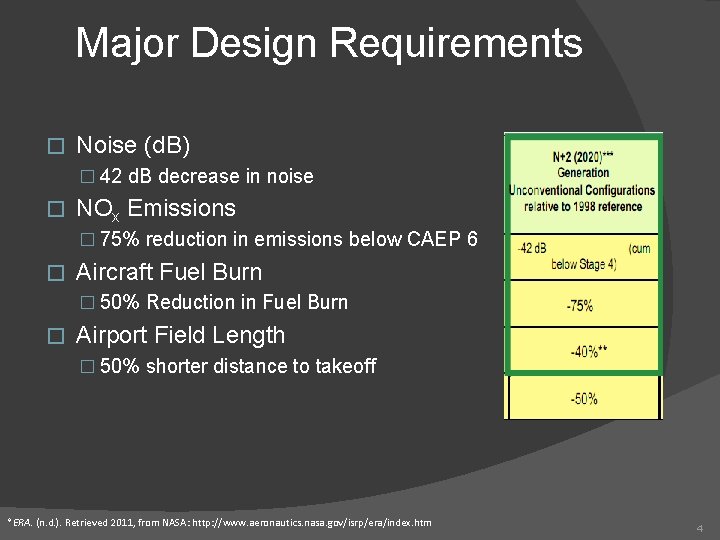
Major Design Requirements � Noise (d. B) � 42 d. B decrease in noise � NOx Emissions � 75% reduction in emissions below CAEP 6 � Aircraft Fuel Burn � 50% Reduction in Fuel Burn � Airport Field Length � 50% shorter distance to takeoff * *ERA. (n. d. ). Retrieved 2011, from NASA: http: //www. aeronautics. nasa. gov/isrp/era/index. htm 4
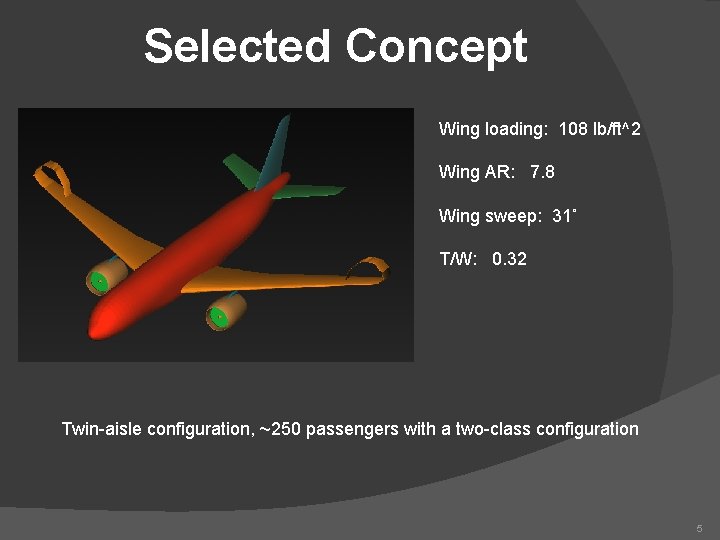
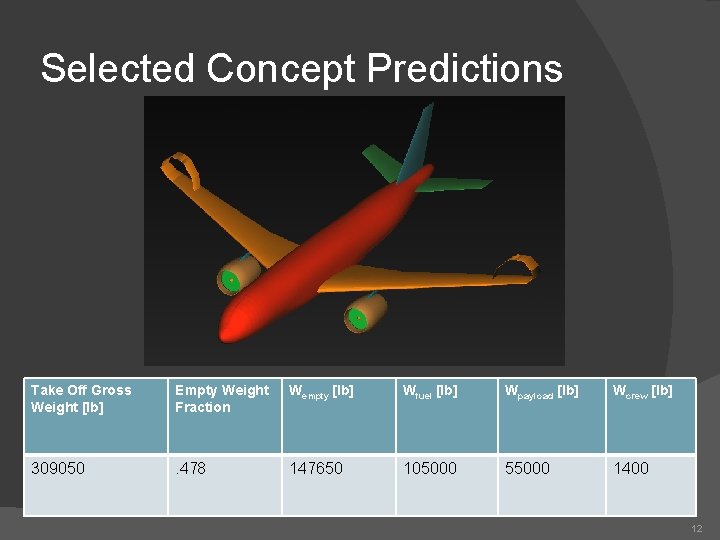
Selected Concept Wing loading: 108 lb/ft^2 Wing AR: 7. 8 Wing sweep: 31˚ T/W: 0. 32 Twin-aisle configuration, ~250 passengers with a two-class configuration 5
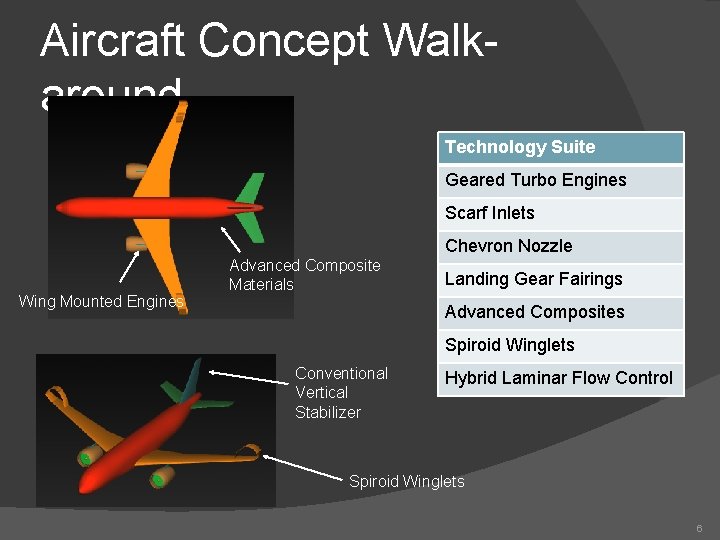
Aircraft Concept Walkaround Technology Suite Geared Turbo Engines Scarf Inlets Chevron Nozzle Wing Mounted Engines Advanced Composite Materials Landing Gear Fairings Advanced Composites Spiroid Winglets Conventional Vertical Stabilizer Hybrid Laminar Flow Control Spiroid Winglets 6
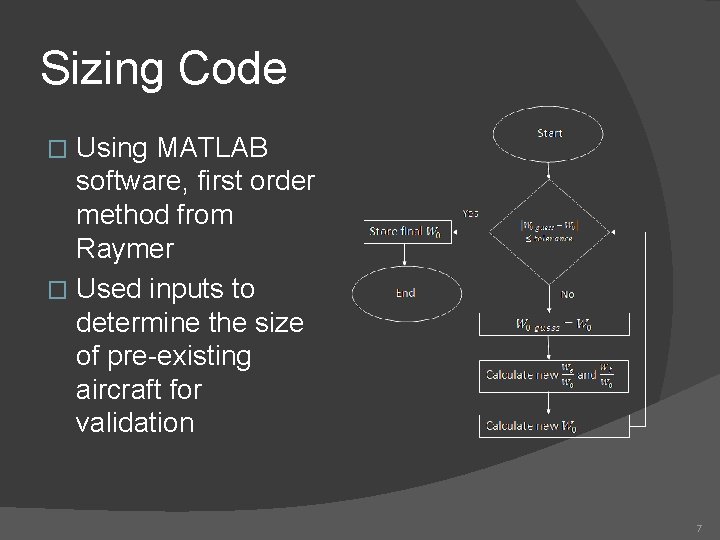
Sizing Code Using MATLAB software, first order method from Raymer � Used inputs to determine the size of pre-existing aircraft for validation � 7
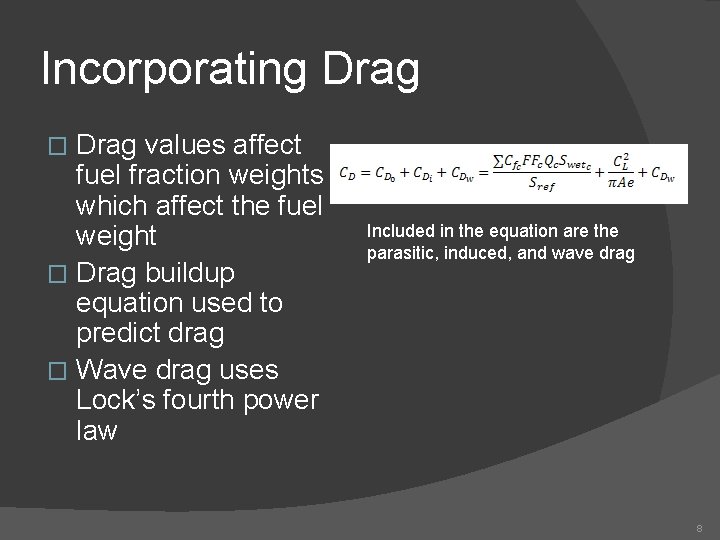
Incorporating Drag values affect fuel fraction weights which affect the fuel weight � Drag buildup equation used to predict drag � Wave drag uses Lock’s fourth power law � Included in the equation are the parasitic, induced, and wave drag 8
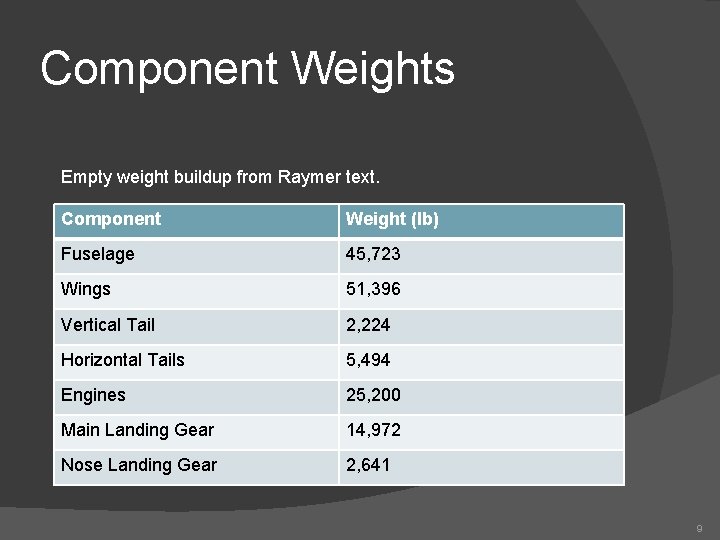
Component Weights Empty weight buildup from Raymer text. Component Weight (lb) Fuselage 45, 723 Wings 51, 396 Vertical Tail 2, 224 Horizontal Tails 5, 494 Engines 25, 200 Main Landing Gear 14, 972 Nose Landing Gear 2, 641 9
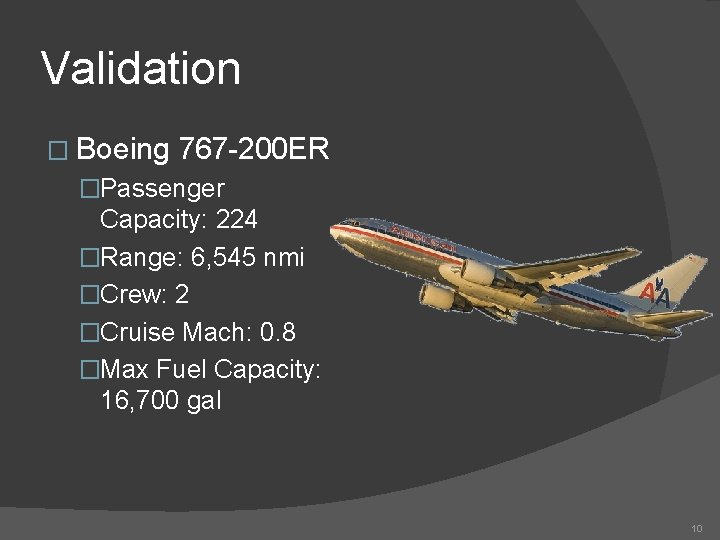
Validation � Boeing 767 -200 ER �Passenger Capacity: 224 �Range: 6, 545 nmi �Crew: 2 �Cruise Mach: 0. 8 �Max Fuel Capacity: 16, 700 gal 10
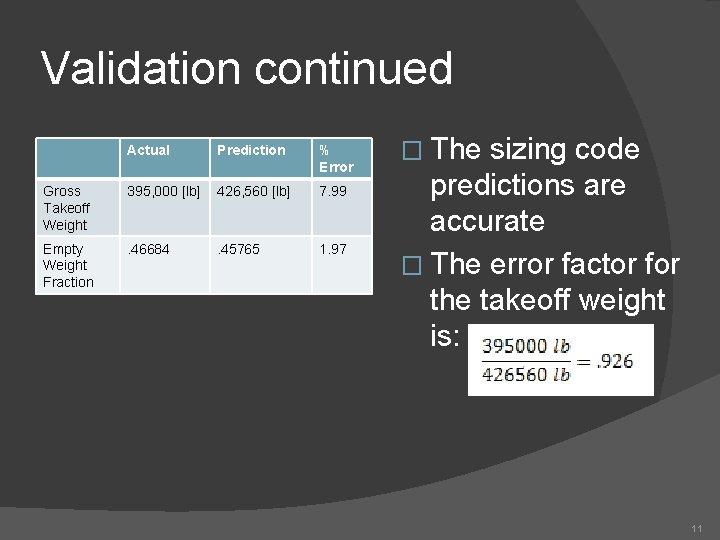
Validation continued Actual Prediction % Error Gross Takeoff Weight 395, 000 [lb] 426, 560 [lb] 7. 99 Empty Weight Fraction . 46684 . 45765 1. 97 � The sizing code predictions are accurate � The error factor for the takeoff weight is: 11
Selected Concept Predictions Take Off Gross Weight [lb] Empty Weight Fraction Wempty [lb] Wfuel [lb] Wpayload [lb] Wcrew [lb] 309050 . 478 147650 105000 55000 1400 12
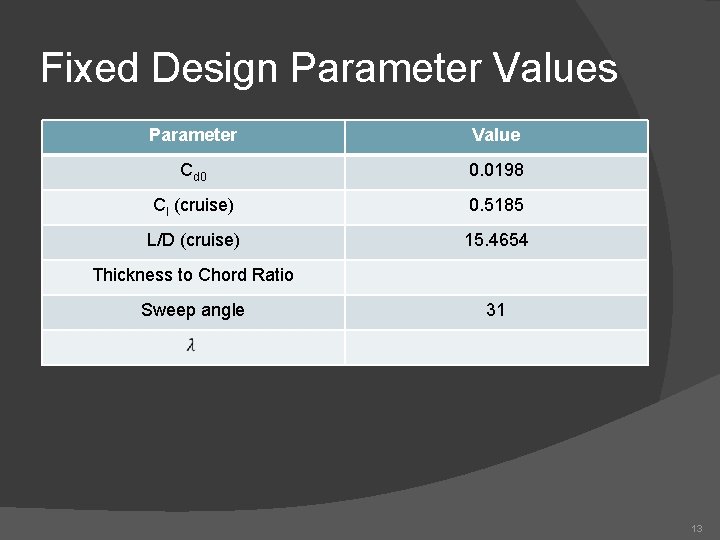
Fixed Design Parameter Values Parameter Value Cd 0 0. 0198 Cl (cruise) 0. 5185 L/D (cruise) 15. 4654 Thickness to Chord Ratio Sweep angle 31 13
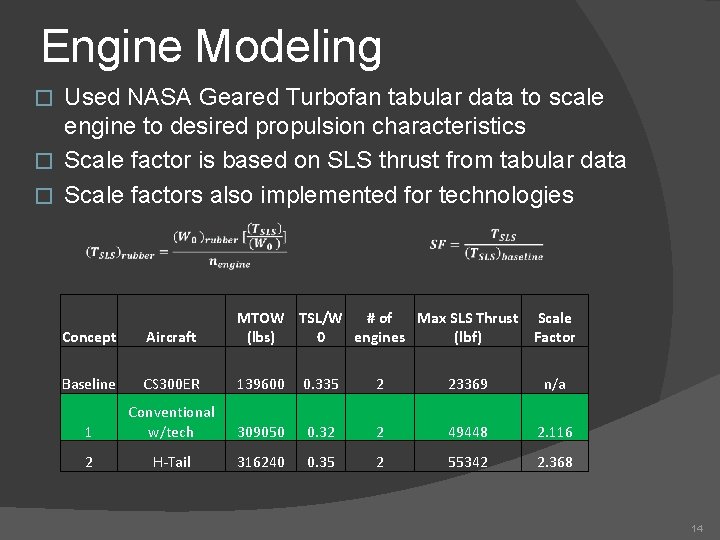
Engine Modeling Used NASA Geared Turbofan tabular data to scale engine to desired propulsion characteristics � Scale factor is based on SLS thrust from tabular data � Scale factors also implemented for technologies � Concept Aircraft MTOW TSL/W # of Max SLS Thrust Scale (lbs) 0 engines (lbf) Factor Baseline CS 300 ER 139600 0. 335 2 23369 n/a 1 Conventional w/tech 309050 0. 32 2 49448 2. 116 2 H-Tail 316240 0. 35 2 55342 2. 368 14
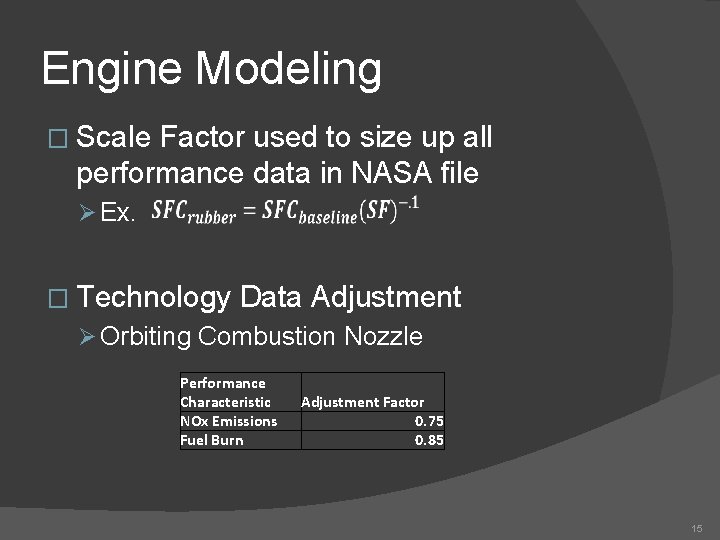
Engine Modeling � Scale Factor used to size up all performance data in NASA file Ø Ex. � Technology Data Adjustment Ø Orbiting Combustion Nozzle Performance Characteristic NOx Emissions Fuel Burn Adjustment Factor 0. 75 0. 85 15
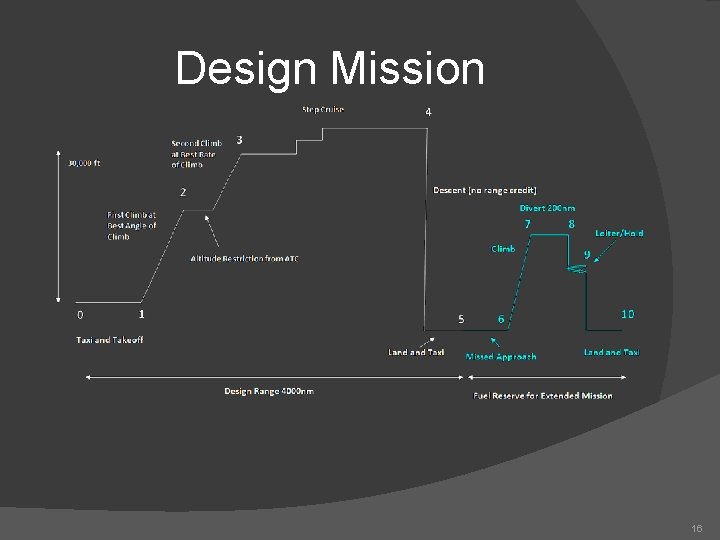
Design Mission 16
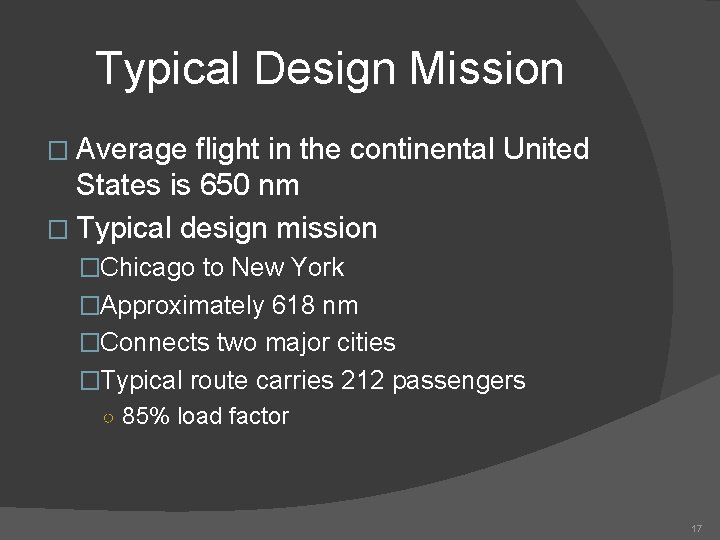
Typical Design Mission � Average flight in the continental United States is 650 nm � Typical design mission �Chicago to New York �Approximately 618 nm �Connects two major cities �Typical route carries 212 passengers ○ 85% load factor 17
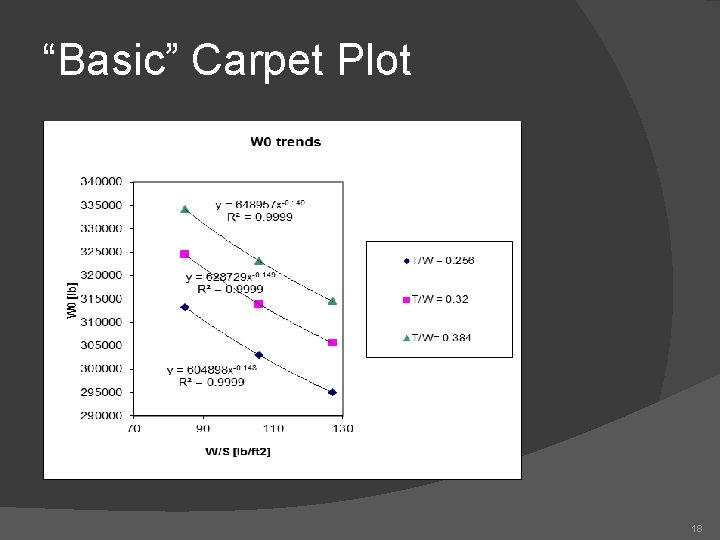
“Basic” Carpet Plot 18
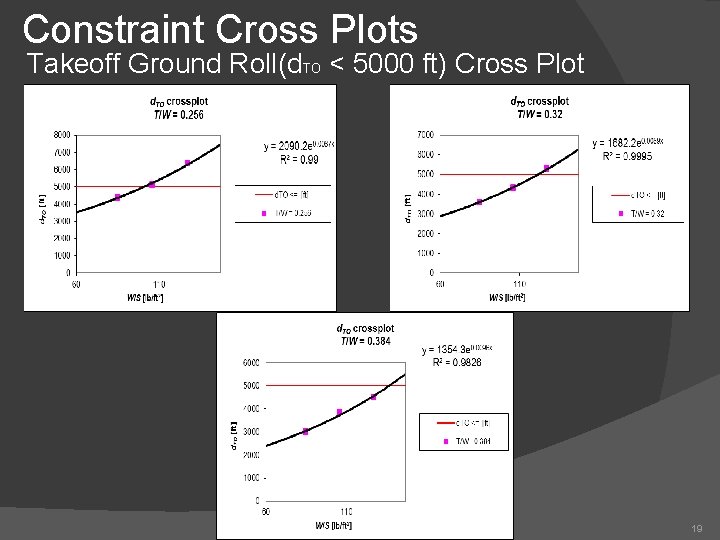
Constraint Cross Plots Takeoff Ground Roll(d. TO < 5000 ft) Cross Plot 19
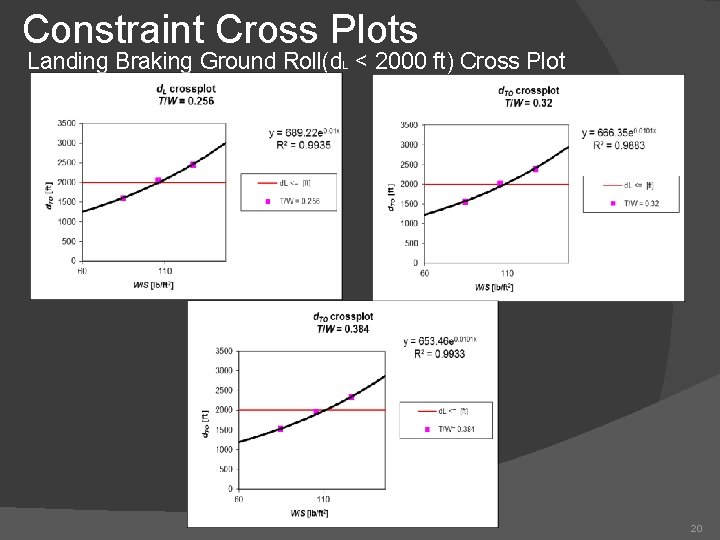
Constraint Cross Plots Landing Braking Ground Roll(d. L < 2000 ft) Cross Plot 20
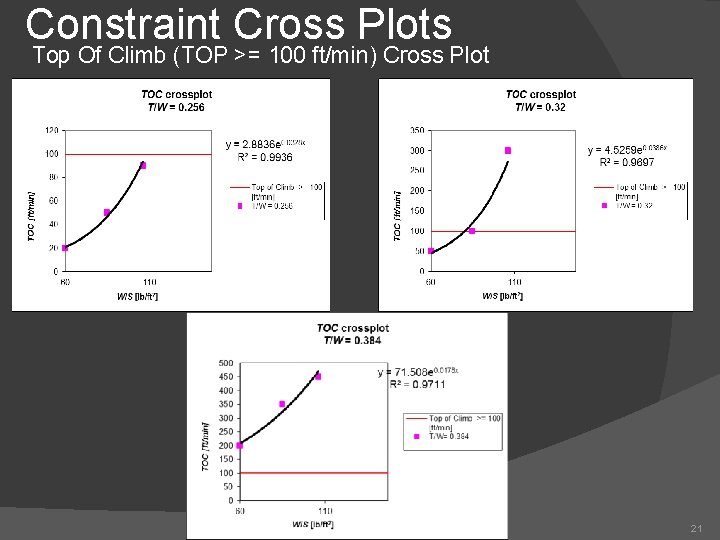
Constraint Cross Plots Top Of Climb (TOP >= 100 ft/min) Cross Plot 21
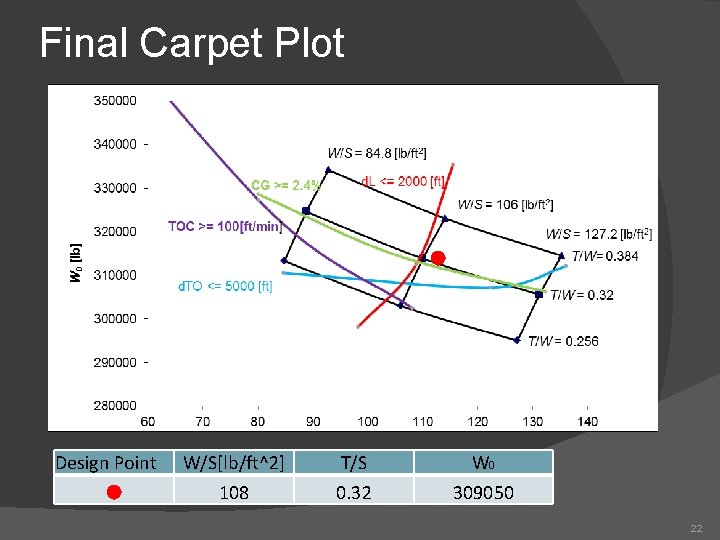
Final Carpet Plot Design Point W/S[lb/ft^2] 108 T/S 0. 32 W 0 309050 22
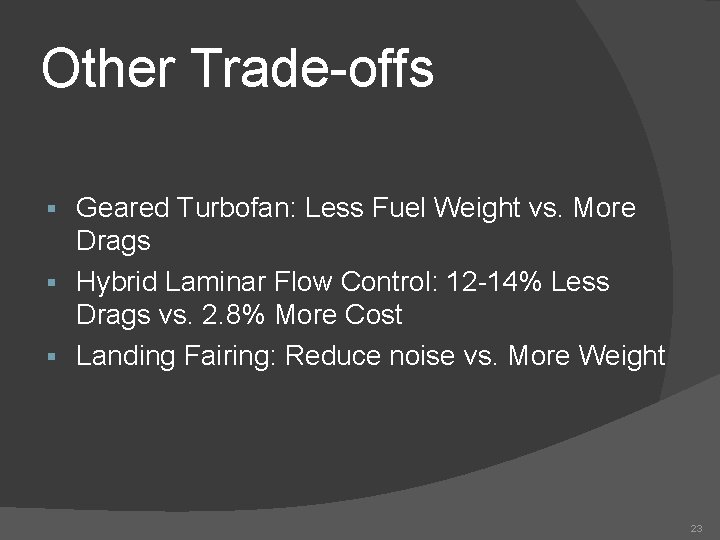
Other Trade-offs Geared Turbofan: Less Fuel Weight vs. More Drags § Hybrid Laminar Flow Control: 12 -14% Less Drags vs. 2. 8% More Cost § Landing Fairing: Reduce noise vs. More Weight § 23
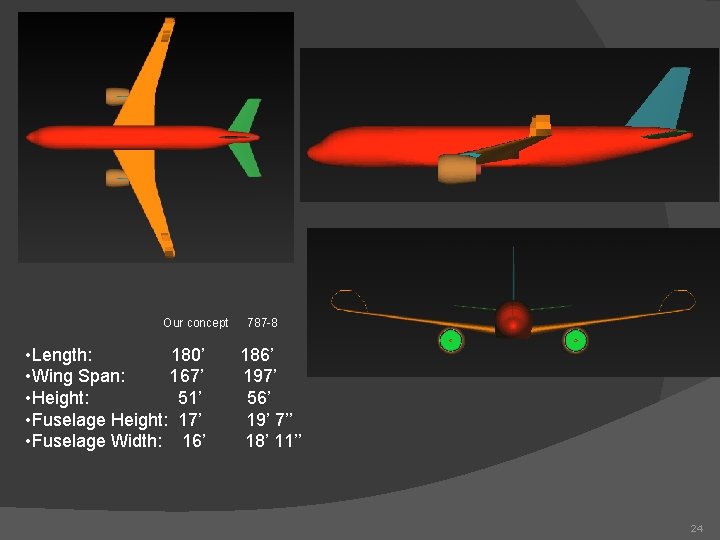
Our concept • Length: 180’ • Wing Span: 167’ • Height: 51’ • Fuselage Height: 17’ • Fuselage Width: 16’ 787 -8 186’ 197’ 56’ 19’ 7’’ 18’ 11’’ 24
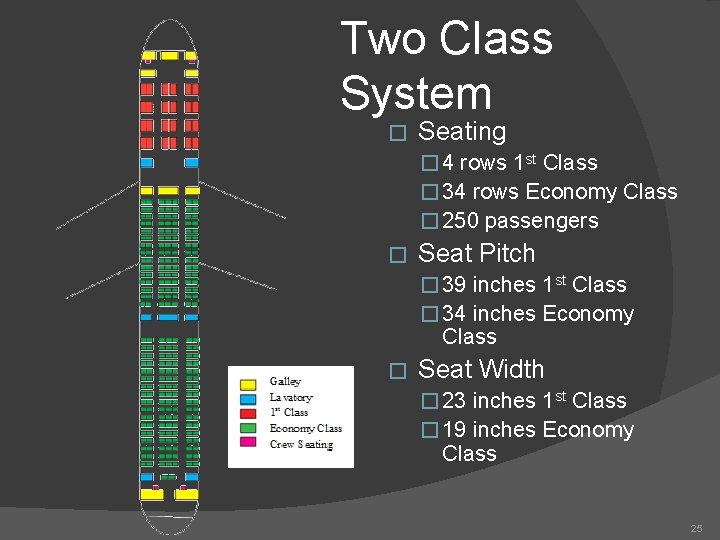
Two Class System � Seating � 4 rows 1 st Class � 34 rows Economy Class � 250 passengers � Seat Pitch � 39 inches 1 st Class � 34 inches Economy Class � Seat Width � 23 inches 1 st Class � 19 inches Economy Class 25
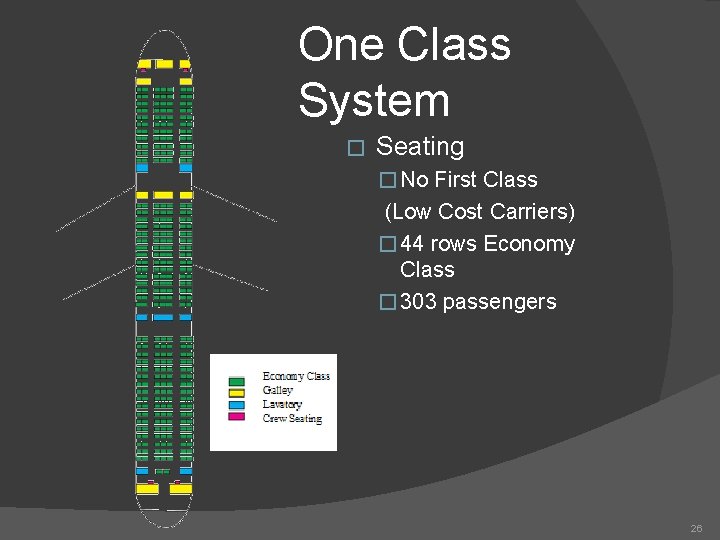
One Class System � Seating � No First Class (Low Cost Carriers) � 44 rows Economy Class � 303 passengers 26
Airfoil Selection � Supercritical airfoils to be used for all wing and stabilizer sections �Still used for transonic aircraft* �Reduce wave drag �Increase fuel storage space � Airfoil would be designed to meet design goals �Cruise CL = 0. 5185, L/D = 15. 4654 *http: //adg. stanford. edu/aa 241/intro/futureac. html 27
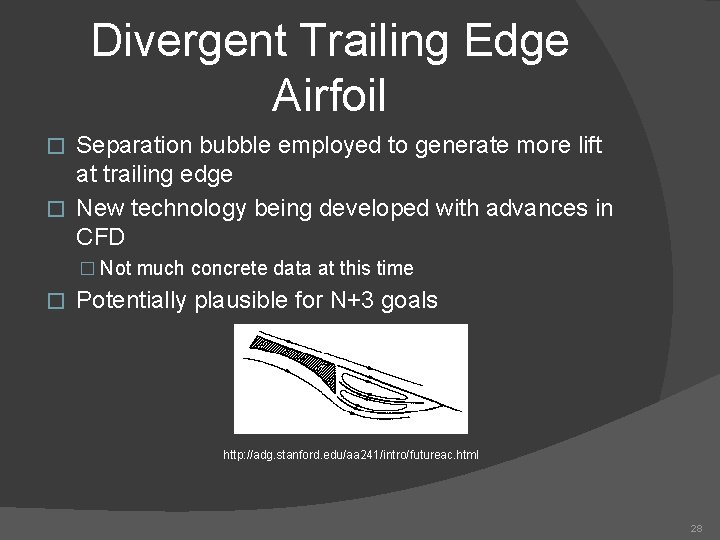
Divergent Trailing Edge Airfoil Separation bubble employed to generate more lift at trailing edge � New technology being developed with advances in CFD � � Not much concrete data at this time � Potentially plausible for N+3 goals http: //adg. stanford. edu/aa 241/intro/futureac. html 28
High-Lift Devices Slats, Triple-slotted flaps �Used for reliability � Lift coefficients for different configurations �Takeoff CL = 1. 3 �Landing CL = 2. 5 � Landing and takeoff speeds set at 175 mph (152 kts), 15% faster than stall � 29
Performance V-n (Loads) Diagram Performance Summary 30
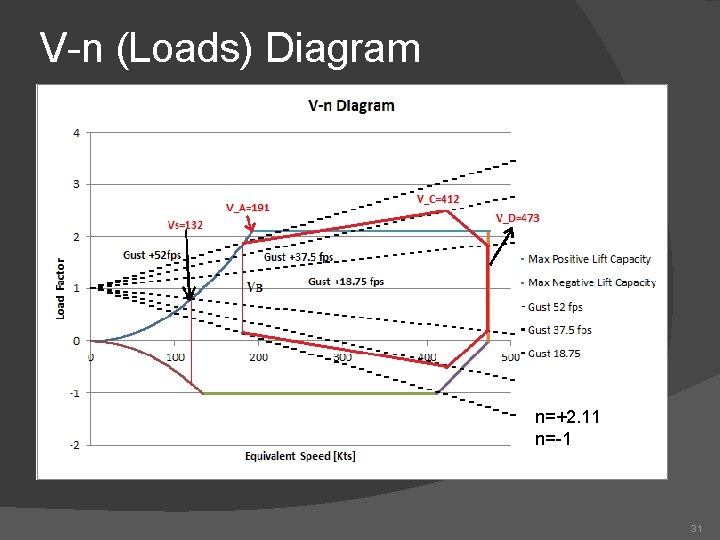
V-n (Loads) Diagram n=+2. 11 n=-1 31
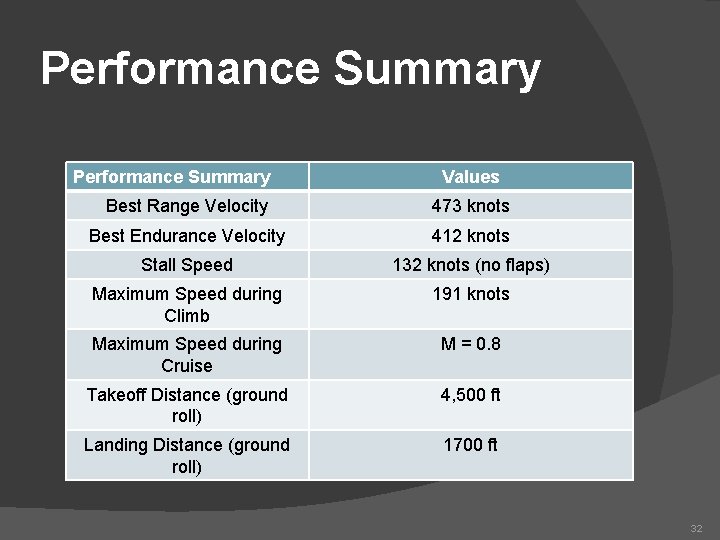
Performance Summary Values Best Range Velocity 473 knots Best Endurance Velocity 412 knots Stall Speed 132 knots (no flaps) Maximum Speed during Climb 191 knots Maximum Speed during Cruise M = 0. 8 Takeoff Distance (ground roll) 4, 500 ft Landing Distance (ground roll) 1700 ft 32
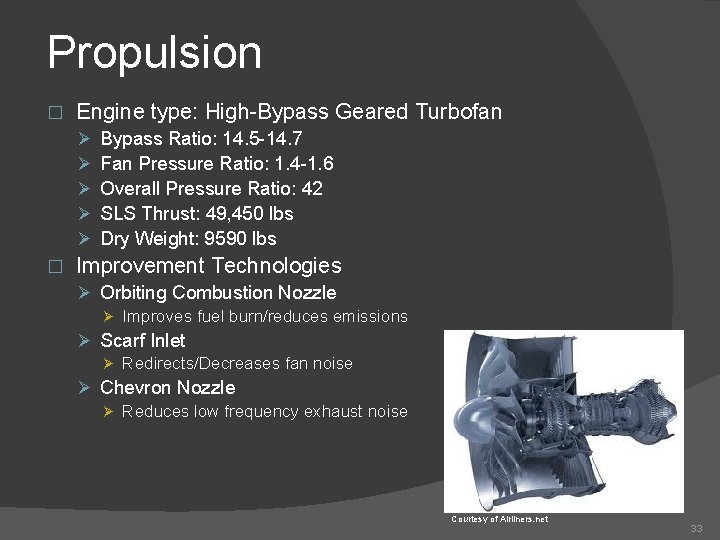
Propulsion � Engine type: High-Bypass Geared Turbofan Ø Ø Ø � Bypass Ratio: 14. 5 -14. 7 Fan Pressure Ratio: 1. 4 -1. 6 Overall Pressure Ratio: 42 SLS Thrust: 49, 450 lbs Dry Weight: 9590 lbs Improvement Technologies Ø Orbiting Combustion Nozzle Ø Improves fuel burn/reduces emissions Ø Scarf Inlet Ø Redirects/Decreases fan noise Ø Chevron Nozzle Ø Reduces low frequency exhaust noise Courtesy of Airliners. net 33
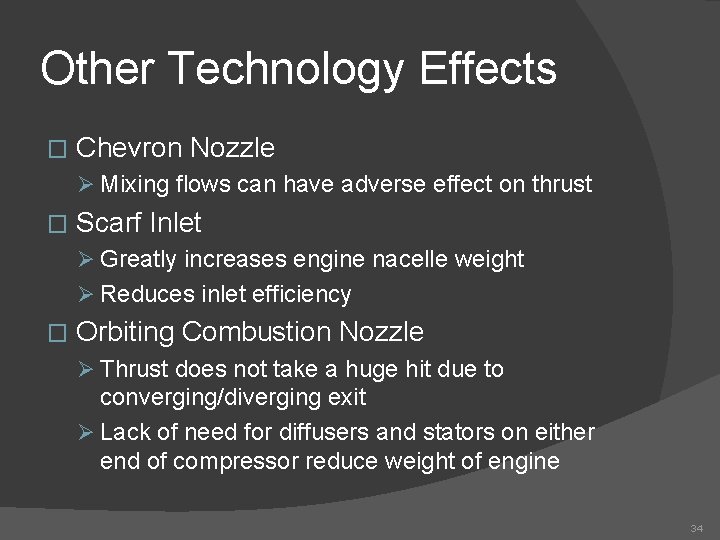
Other Technology Effects � Chevron Nozzle Ø Mixing flows can have adverse effect on thrust � Scarf Inlet Ø Greatly increases engine nacelle weight Ø Reduces inlet efficiency � Orbiting Combustion Nozzle Ø Thrust does not take a huge hit due to converging/diverging exit Ø Lack of need for diffusers and stators on either end of compressor reduce weight of engine 34
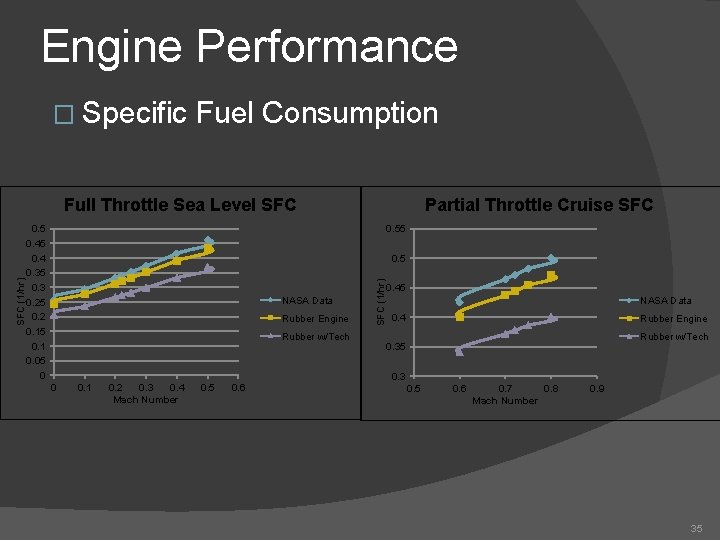
Engine Performance � Specific Fuel Consumption 0. 5 0. 4 0. 35 0. 3 0. 25 0. 2 0. 15 0. 1 0. 05 0 Partial Throttle Cruise SFC 0. 55 0. 5 NASA Data Rubber Engine Rubber w/Tech SFC (1/hr) Full Throttle Sea Level SFC 0. 45 NASA Data 0. 4 Rubber Engine Rubber w/Tech 0. 35 0. 3 0 0. 1 0. 2 0. 3 0. 4 Mach Number 0. 5 0. 6 0. 7 0. 8 Mach Number 0. 9 35
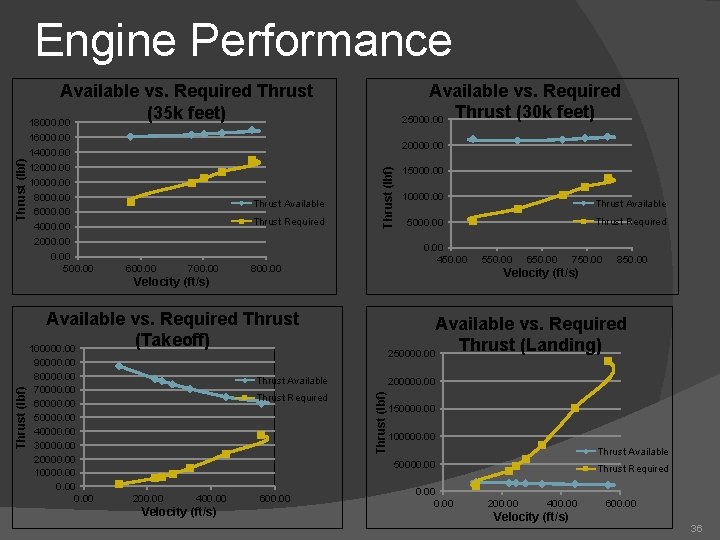
Engine Performance Available vs. Required 25000. 00 Thrust (30 k feet) 16000. 00 14000. 00 12000. 00 10000. 00 8000. 00 6000. 00 4000. 00 2000. 00 500. 00 20000. 00 Thrust Available Thrust Required 600. 00 700. 00 15000. 00 10000. 00 Thrust Available Thrust Required 5000. 00 450. 00 550. 00 650. 00 750. 00 850. 00 Velocity (ft/s) Thrust (lbf) Velocity (ft/s) 800. 00 Thrust (lbf) Available vs. Required Thrust (35 k feet) 18000. 00 Velocity (ft/s) 36
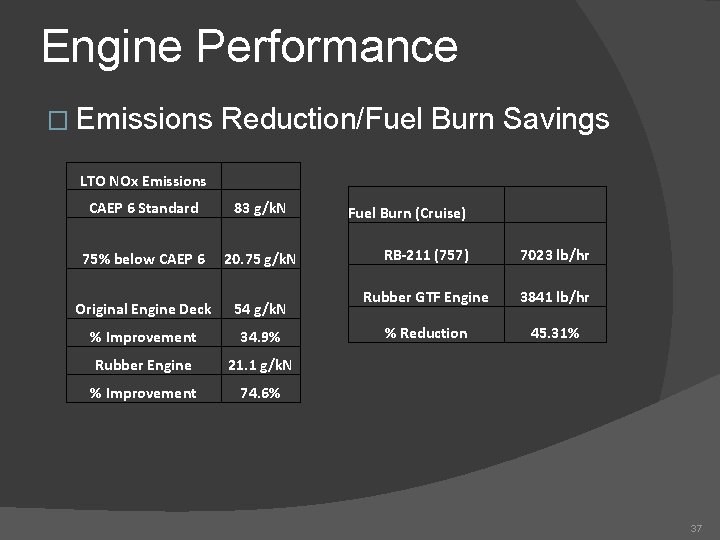
Engine Performance � Emissions Reduction/Fuel Burn Savings LTO NOx Emissions CAEP 6 Standard 83 g/k. N 75% below CAEP 6 20. 75 g/k. N Original Engine Deck 54 g/k. N % Improvement 34. 9% Rubber Engine 21. 1 g/k. N % Improvement 74. 6% Fuel Burn (Cruise) RB-211 (757) 7023 lb/hr Rubber GTF Engine 3841 lb/hr % Reduction 45. 31% 37
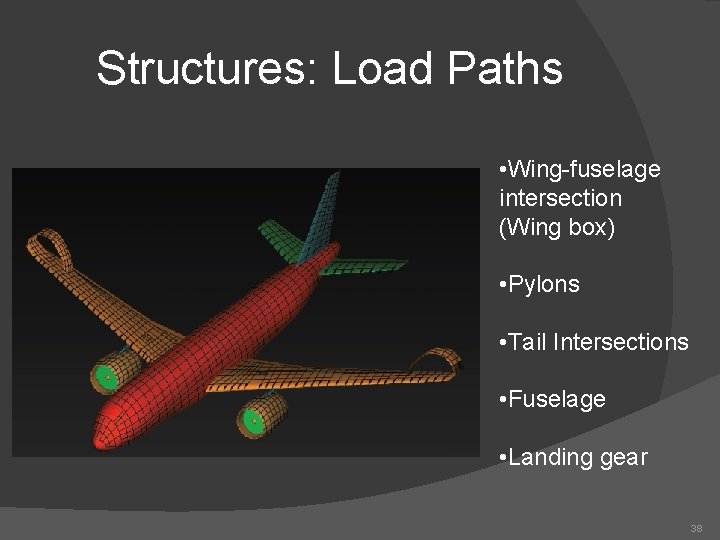
Structures: Load Paths • Wing-fuselage intersection (Wing box) • Pylons • Tail Intersections • Fuselage • Landing gear 38
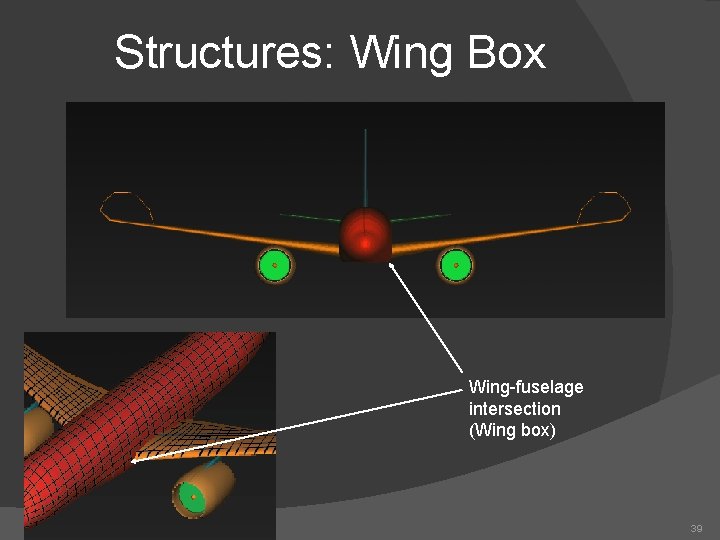
Structures: Wing Box Wing-fuselage intersection (Wing box) 39
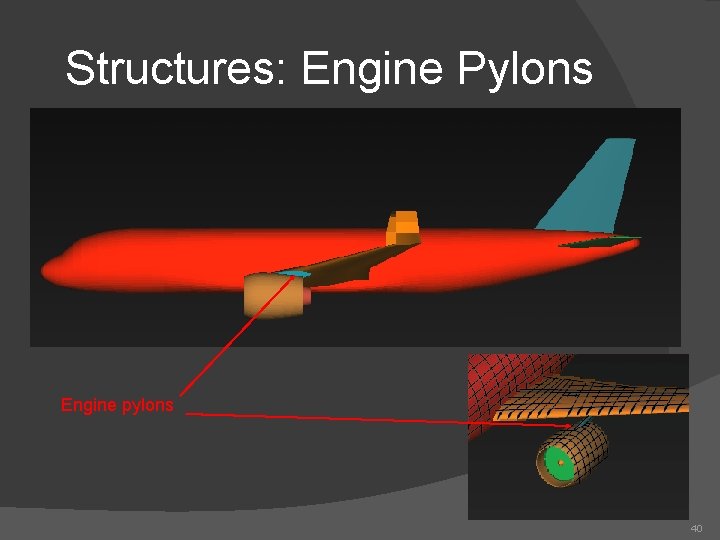
Structures: Engine Pylons Engine pylons 40
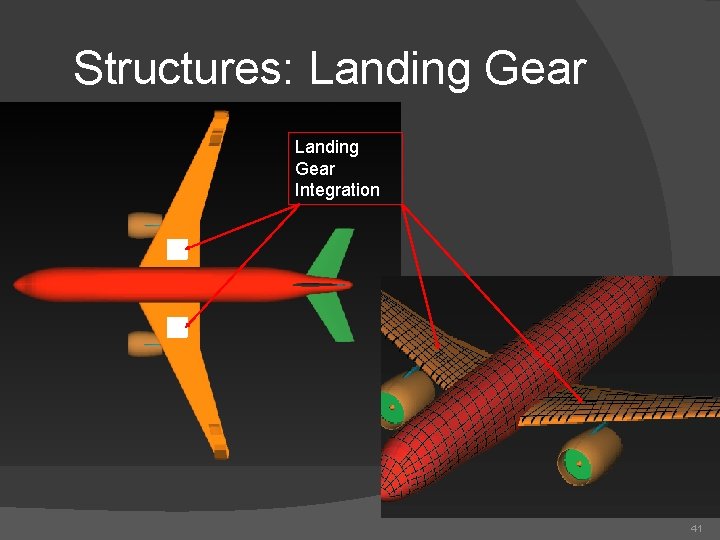
Structures: Landing Gear Integration 41
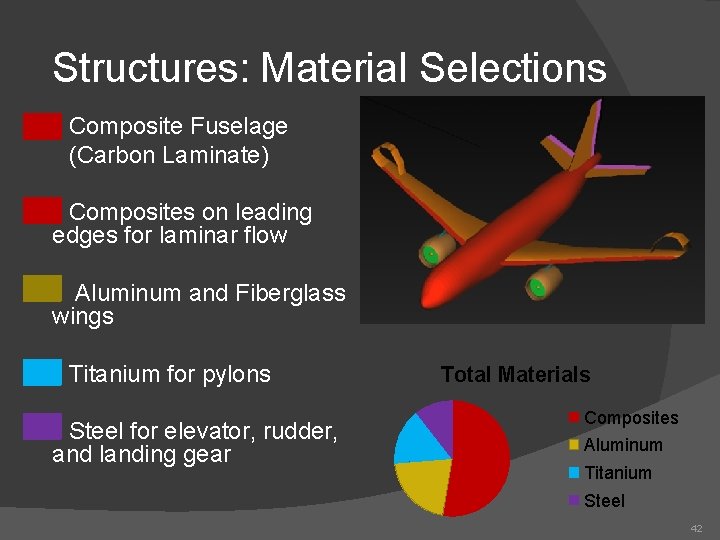
Structures: Material Selections Composite Fuselage (Carbon Laminate) Composites on leading edges for laminar flow Aluminum and Fiberglass wings Titanium for pylons Steel for elevator, rudder, and landing gear Total Materials Composites Aluminum Titanium Steel 42
Weights and Balance Aircraft Group Weights Statement Description of Empty Weight Prediction Location of Center of Gravity 43
Empty Weight Prediction Method � Equations for a/c components from Raymer � Each component function of designed gross weight � Summation of component weights 44
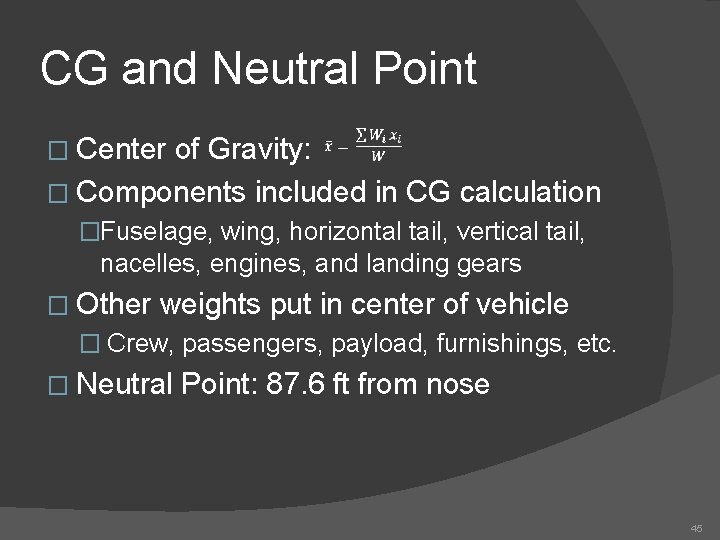
CG and Neutral Point � Center of Gravity: � Components included in CG calculation �Fuselage, wing, horizontal tail, vertical tail, nacelles, engines, and landing gears � Other weights put in center of vehicle � Crew, passengers, payload, furnishings, etc. � Neutral Point: 87. 6 ft from nose 45
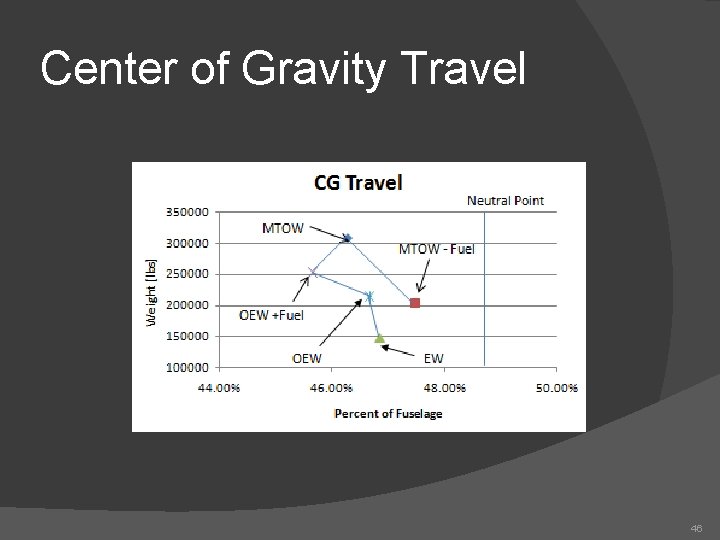
Center of Gravity Travel 46
Stability and Control � Static Longitudinal Stability � Lateral Stability 47
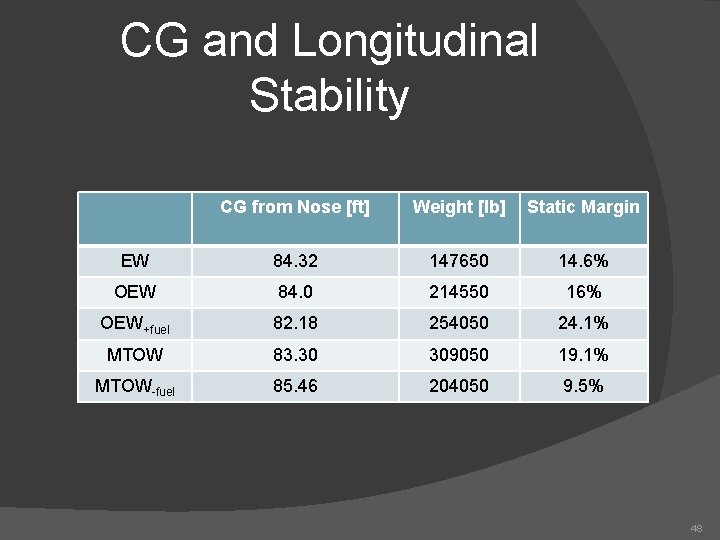
CG and Longitudinal Stability CG from Nose [ft] Weight [lb] Static Margin EW 84. 32 147650 14. 6% OEW 84. 0 214550 16% OEW+fuel 82. 18 254050 24. 1% MTOW 83. 30 309050 19. 1% MTOW-fuel 85. 46 204050 9. 5% 48
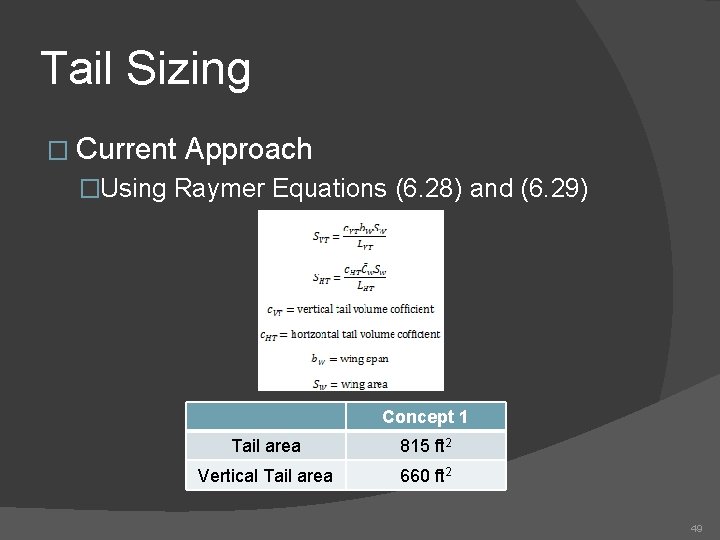
Tail Sizing � Current Approach �Using Raymer Equations (6. 28) and (6. 29) Concept 1 Tail area 815 ft 2 Vertical Tail area 660 ft 2 49
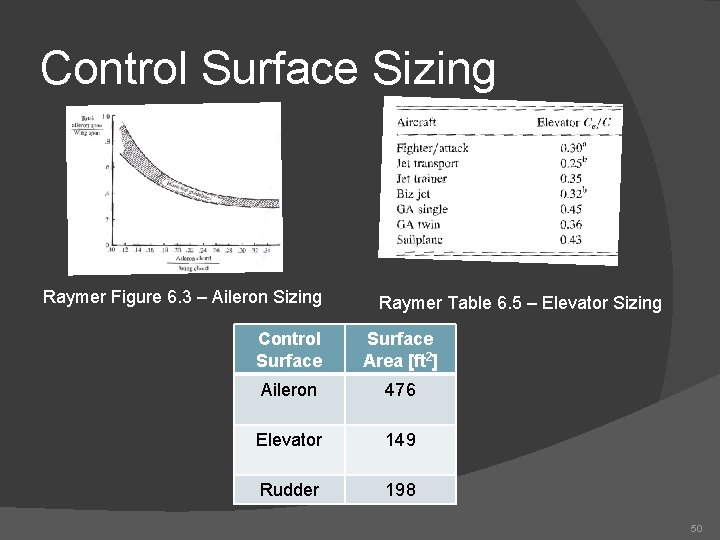
Control Surface Sizing Raymer Figure 6. 3 – Aileron Sizing Raymer Table 6. 5 – Elevator Sizing Control Surface Area [ft 2] Aileron 476 Elevator 149 Rudder 198 50
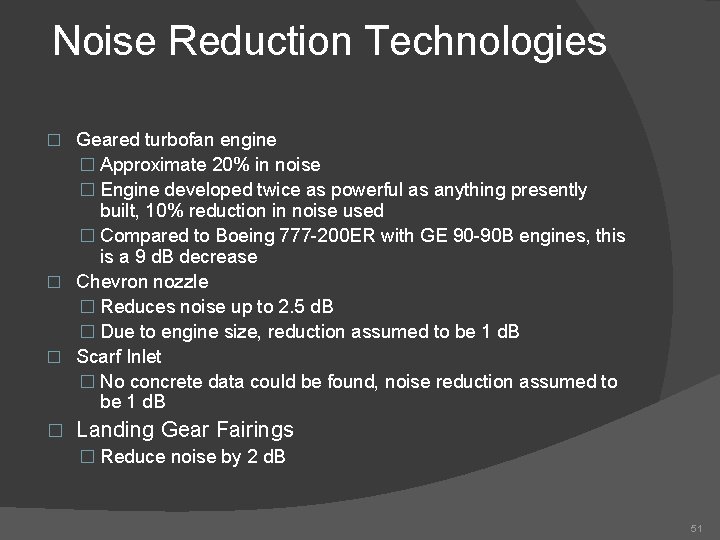
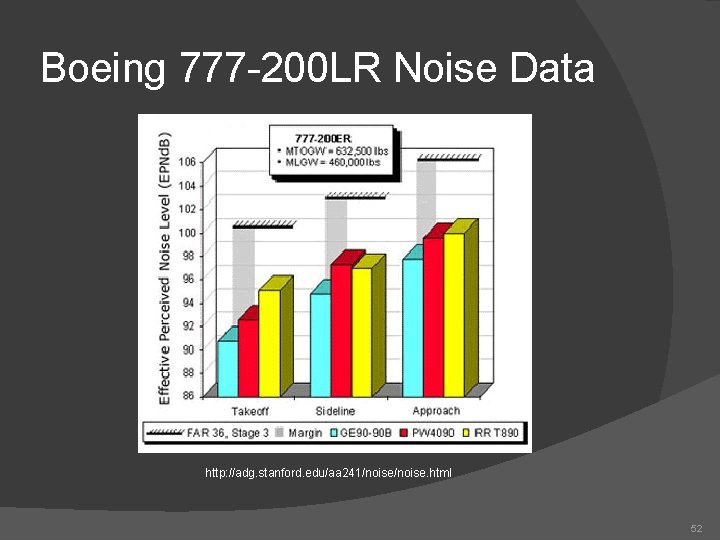
Noise Reduction Technologies Geared turbofan engine � Approximate 20% in noise � Engine developed twice as powerful as anything presently built, 10% reduction in noise used � Compared to Boeing 777 -200 ER with GE 90 -90 B engines, this is a 9 d. B decrease � Chevron nozzle � Reduces noise up to 2. 5 d. B � Due to engine size, reduction assumed to be 1 d. B � Scarf Inlet � No concrete data could be found, noise reduction assumed to be 1 d. B � Landing Gear Fairings � Reduce noise by 2 d. B � 51
Boeing 777 -200 LR Noise Data http: //adg. stanford. edu/aa 241/noise. html 52
Conclusion on Noise For Stage 4 standards, noise generated must be less than 90 d. B in any given test. � To meet N+2 requirements, the cumulative margin between the noise generated and 90 d. B must be at least 42 d. B. � Estimates give a 9 d. B deficit from Stage 4, with a cumulative noise reduction of 27 d. B. Goal is NOT met. � Plenty of noise reduction technology is in development, but none would be ready by 2025. � 53
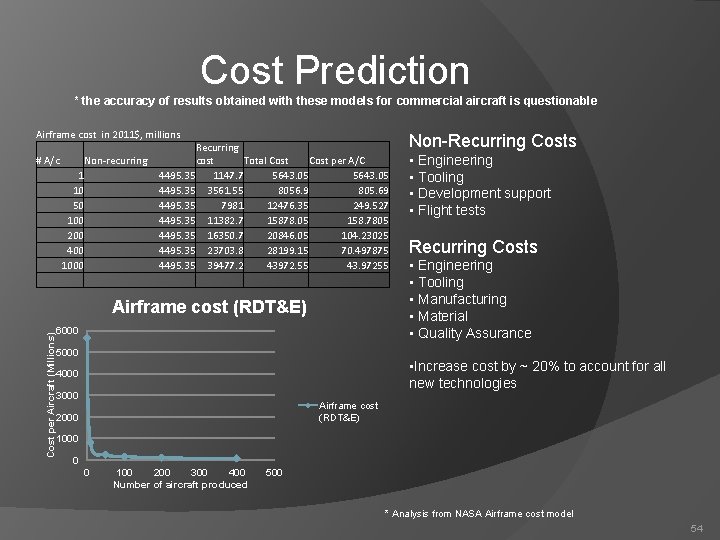
Cost Prediction * the accuracy of results obtained with these models for commercial aircraft is questionable Airframe cost in 2011$, millions Non-Recurring Costs # A/c • Engineering • Tooling • Development support • Flight tests Non-recurring 1 10 50 100 200 400 1000 Recurring cost Total Cost per A/C 4495. 35 1147. 7 5643. 05 4495. 35 3561. 55 8056. 9 805. 69 4495. 35 7981 12476. 35 249. 527 4495. 35 11382. 7 15878. 05 158. 7805 4495. 35 16350. 7 20846. 05 104. 23025 4495. 35 23703. 8 28199. 15 70. 497875 4495. 35 39477. 2 43972. 55 43. 97255 Cost per Aircraft (Millions) Airframe cost (RDT&E) 6000 Recurring Costs • Engineering • Tooling • Manufacturing • Material • Quality Assurance 5000 • Increase cost by ~ 20% to account for all new technologies 4000 3000 Airframe cost (RDT&E) 2000 1000 0 0 100 200 300 400 Number of aircraft produced 500 * Analysis from NASA Airframe cost model 54
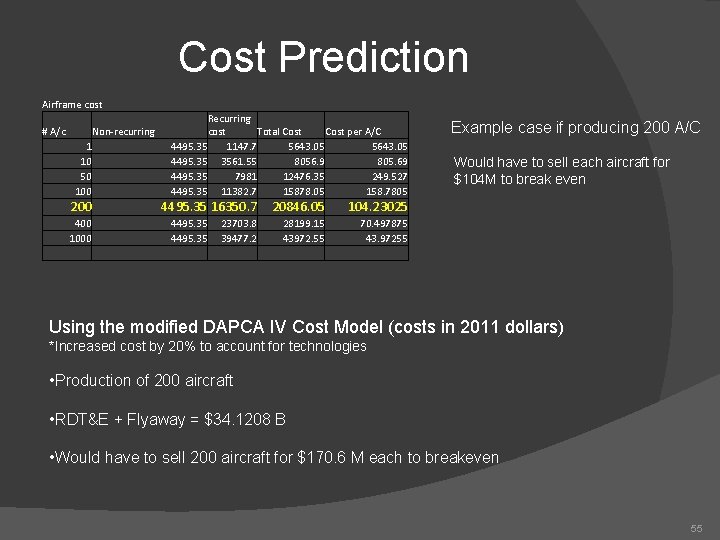
Cost Prediction Airframe cost # A/c Non-recurring 1 10 50 100 200 4495. 35 16350. 7 400 1000 Recurring cost Total Cost per A/C 4495. 35 1147. 7 5643. 05 4495. 35 3561. 55 8056. 9 805. 69 4495. 35 7981 12476. 35 249. 527 4495. 35 11382. 7 15878. 05 158. 7805 4495. 35 23703. 8 39477. 2 20846. 05 104. 23025 28199. 15 43972. 55 70. 497875 43. 97255 Example case if producing 200 A/C Would have to sell each aircraft for $104 M to break even Using the modified DAPCA IV Cost Model (costs in 2011 dollars) *Increased cost by 20% to account for technologies • Production of 200 aircraft • RDT&E + Flyaway = $34. 1208 B • Would have to sell 200 aircraft for $170. 6 M each to breakeven 55
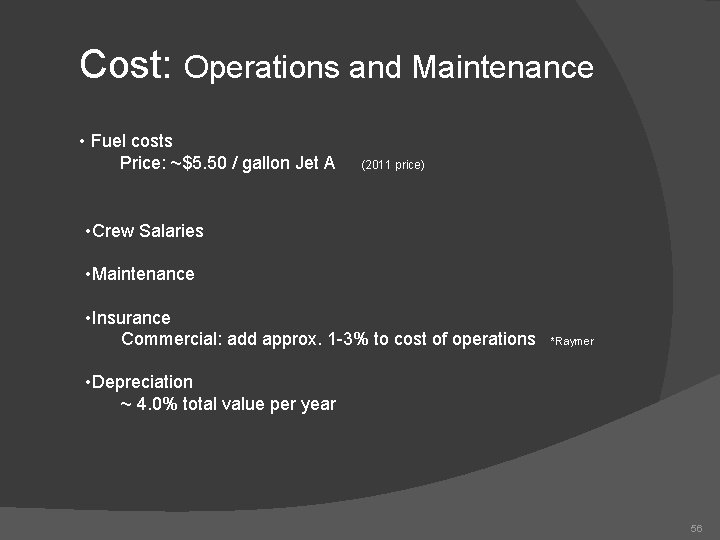
Cost: Operations and Maintenance • Fuel costs Price: ~$5. 50 / gallon Jet A (2011 price) • Crew Salaries • Maintenance • Insurance Commercial: add approx. 1 -3% to cost of operations *Raymer • Depreciation ~ 4. 0% total value per year 56
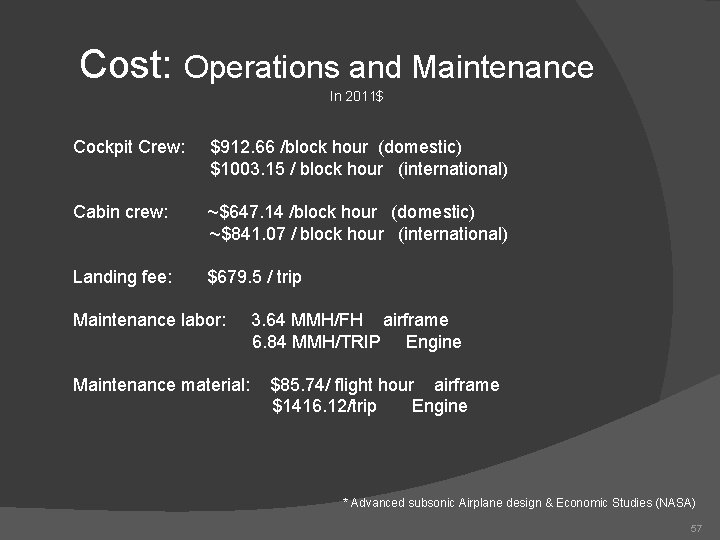
Cost: Operations and Maintenance In 2011$ Cockpit Crew: $912. 66 /block hour (domestic) $1003. 15 / block hour (international) Cabin crew: ~$647. 14 /block hour (domestic) ~$841. 07 / block hour (international) Landing fee: $679. 5 / trip Maintenance labor: Maintenance material: 3. 64 MMH/FH airframe 6. 84 MMH/TRIP Engine $85. 74/ flight hour airframe $1416. 12/trip Engine * Advanced subsonic Airplane design & Economic Studies (NASA) 57
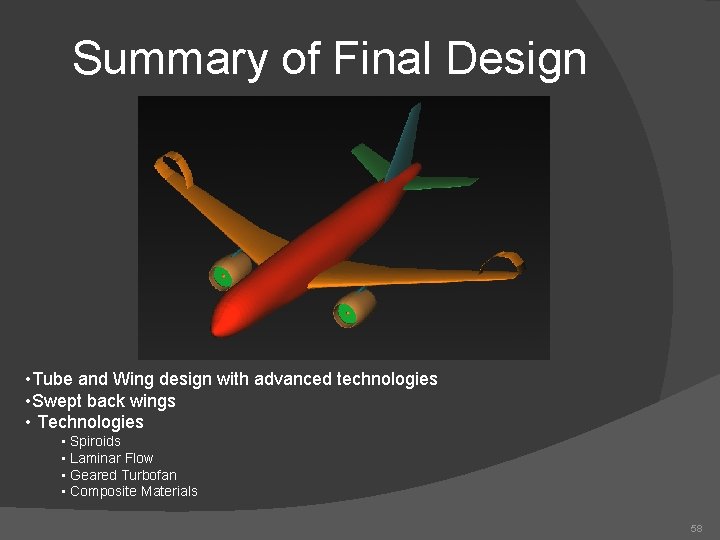
Summary of Final Design • Tube and Wing design with advanced technologies • Swept back wings • Technologies • Spiroids • Laminar Flow • Geared Turbofan • Composite Materials 58
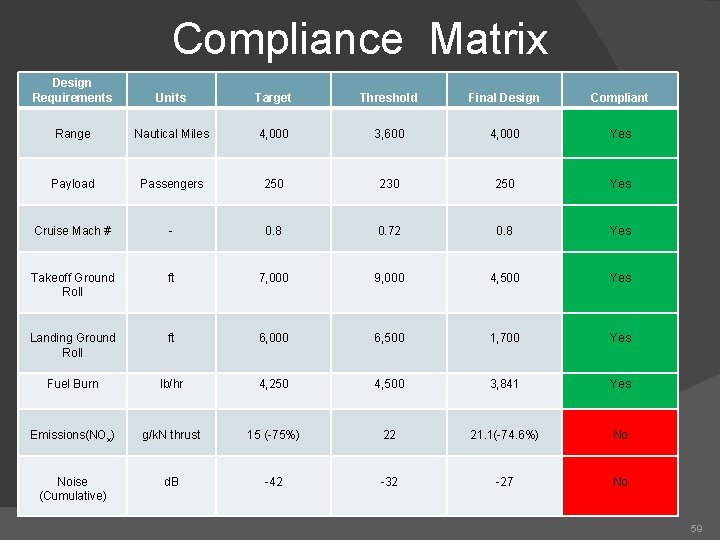
Compliance Matrix Design Requirements Units Target Threshold Final Design Compliant Range Nautical Miles 4, 000 3, 600 4, 000 Yes Payload Passengers 250 230 250 Yes Cruise Mach # - 0. 8 0. 72 0. 8 Yes Takeoff Ground Roll ft 7, 000 9, 000 4, 500 Yes Landing Ground Roll ft 6, 000 6, 500 1, 700 Yes Fuel Burn lb/hr 4, 250 4, 500 3, 841 Yes Emissions(NOx) g/k. N thrust 15 (-75%) 22 21. 1(-74. 6%) No Noise (Cumulative) d. B -42 -32 -27 No 59
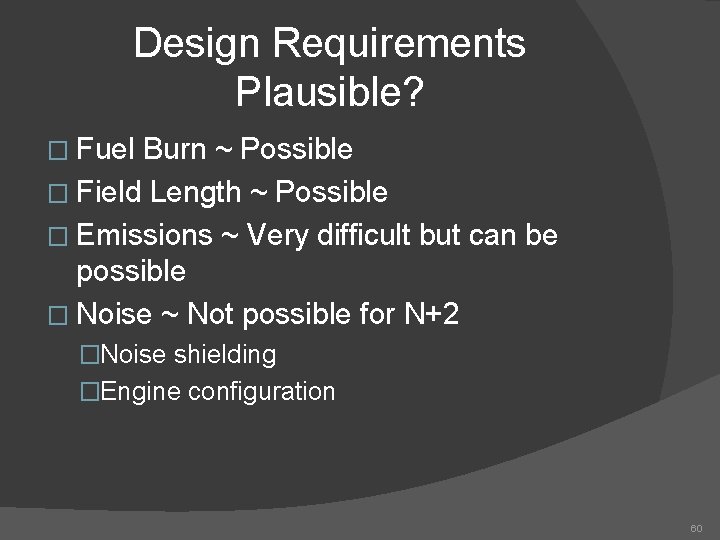
Design Requirements Plausible? � Fuel Burn ~ Possible � Field Length ~ Possible � Emissions ~ Very difficult but can be possible � Noise ~ Not possible for N+2 �Noise shielding �Engine configuration 60
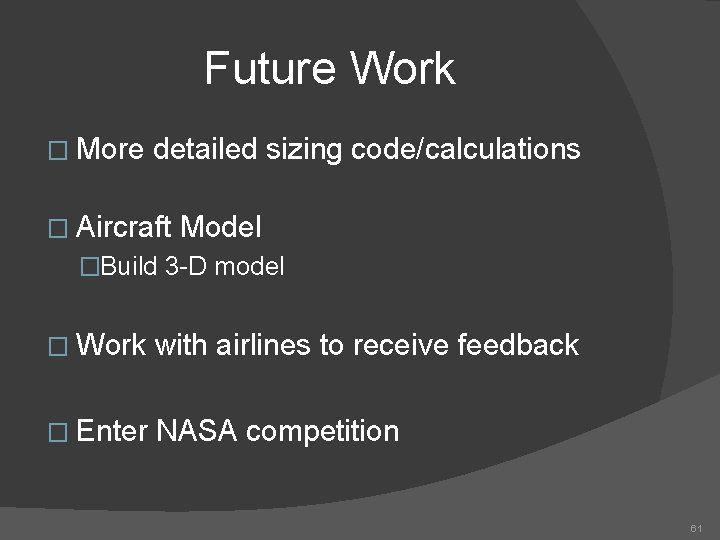
Future Work � More detailed sizing code/calculations � Aircraft Model �Build 3 -D model � Work with airlines to receive feedback � Enter NASA competition 61