Housekeeping Management Inspections Improving Team Outcomes with Asgard


- Slides: 18
Housekeeping Management Inspections Improving Team Outcomes with Asgard Melissa B. Gordon Michelle Taddei Chief Operating Officer Operations Manager Katana Software, Inc. mgordon@katanasoft. com mtaddei@katanasoft. com
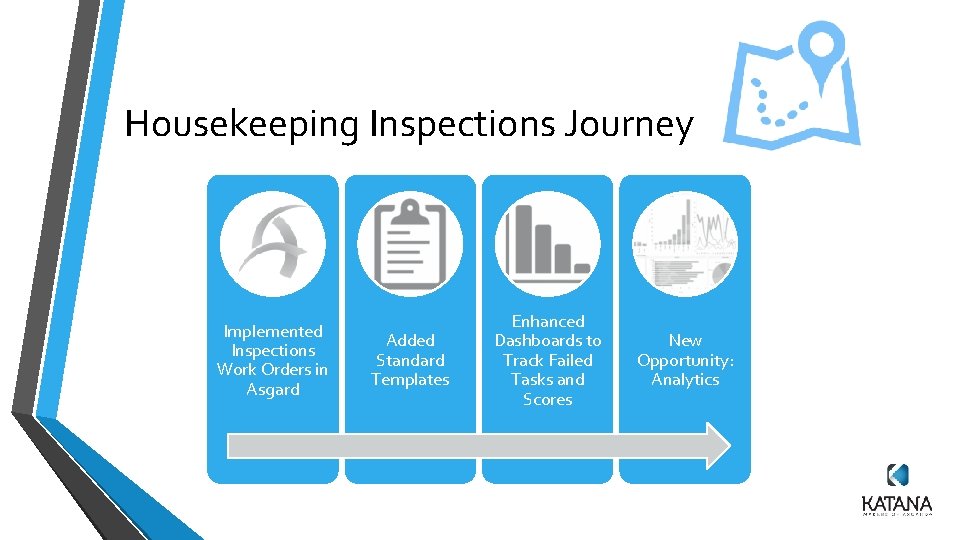
Housekeeping Inspections Journey Implemented Inspections Work Orders in Asgard Added Standard Templates Enhanced Dashboards to Track Failed Tasks and Scores New Opportunity: Analytics
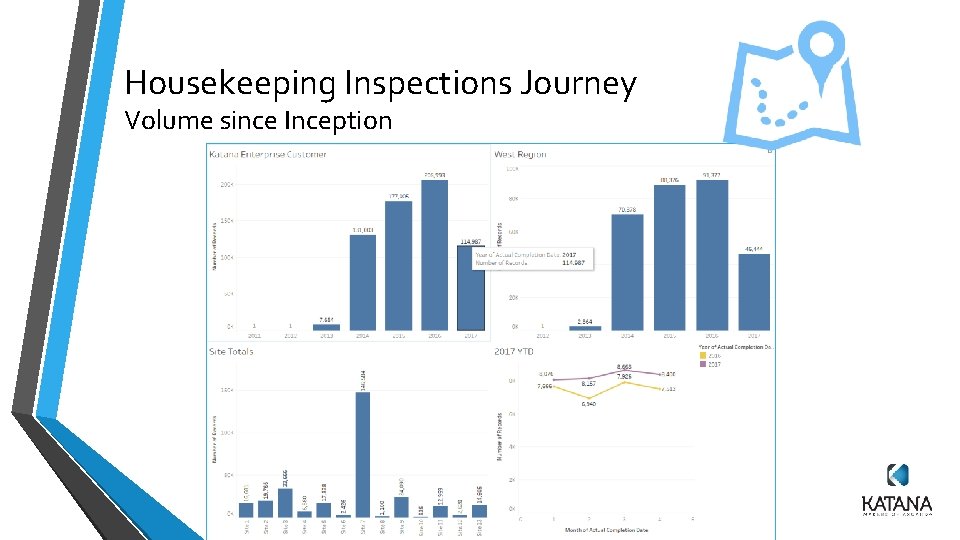
Housekeeping Inspections Journey Volume since Inception
What Opportunities Does the Success of the Program Create? How can we leverage this volume of Inspections data, to derive new insights?
What are the Challenges? • Some sites still have room to grow/fully implement Inspections. • We are using Asgard to gather data we aren’t fully utilizing. • It takes too long to format the data to be actionable and/or report logic not understood • Reports in PDF or Tabular Format • We can’t easily “slice and dice” the formatted data to be actionable without IT • We don’t know what we don’t know… • …And, what we do know, we can’t operationalize.
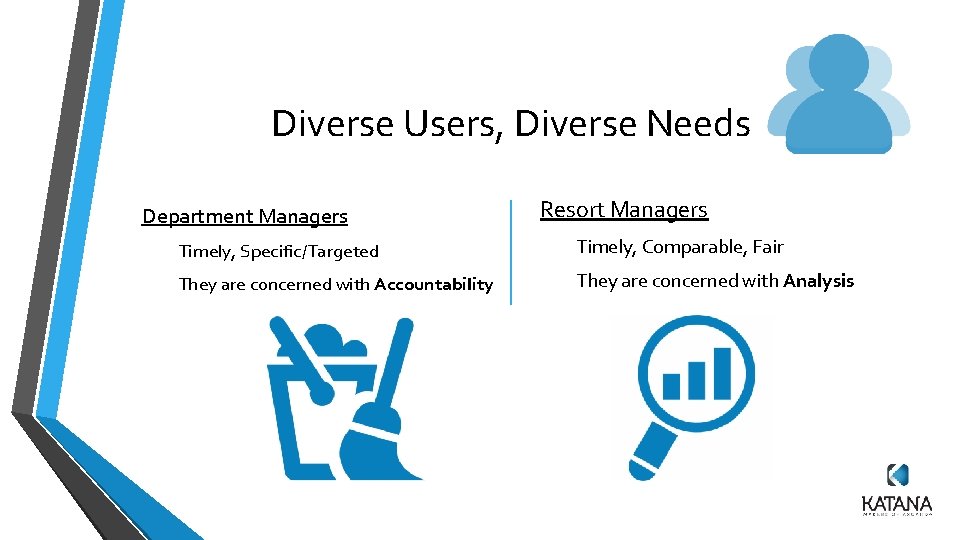
Diverse Users, Diverse Needs Department Managers Resort Managers Timely, Specific/Targeted Timely, Comparable, Fair They are concerned with Accountability They are concerned with Analysis
What’s the solution? • • • “Single Pane of Glass” Dashboard for the most critical areas of business value • • • What is a “Single Pane” solution”? Tool to answer a complex business proposition, simply For example: • • • Are we okay right now? Will we be profitable this period? What do owners want? Requires shared business definition of underlying terms/concepts Doesn’t mean that there is only one dashboard at all, but that there is one place to gather all of the information needed to address a specific business question
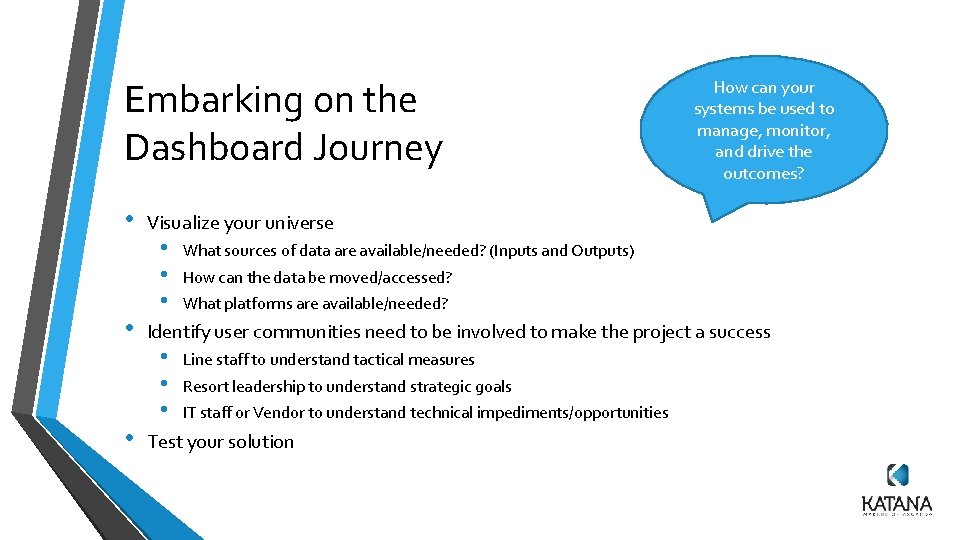
Embarking on the Dashboard Journey • • • How can your systems be used to manage, monitor, and drive the outcomes? Visualize your universe • • • What sources of data are available/needed? (Inputs and Outputs) How can the data be moved/accessed? What platforms are available/needed? Identify user communities need to be involved to make the project a success • • • Line staff to understand tactical measures Resort leadership to understand strategic goals IT staff or Vendor to understand technical impediments/opportunities Test your solution
Key Features of Powerful Dashboards • Combines all needed data in one place • Tells the story (colors, size, etc. ) • Offers one-click “slice and dice” by meaningful segments • • Village / Zone / Building / Team In-Source versus Third-Party Labor Guest Type Day of the week, hour of the day, etc. • Suggests AND supports drill-down capabilities
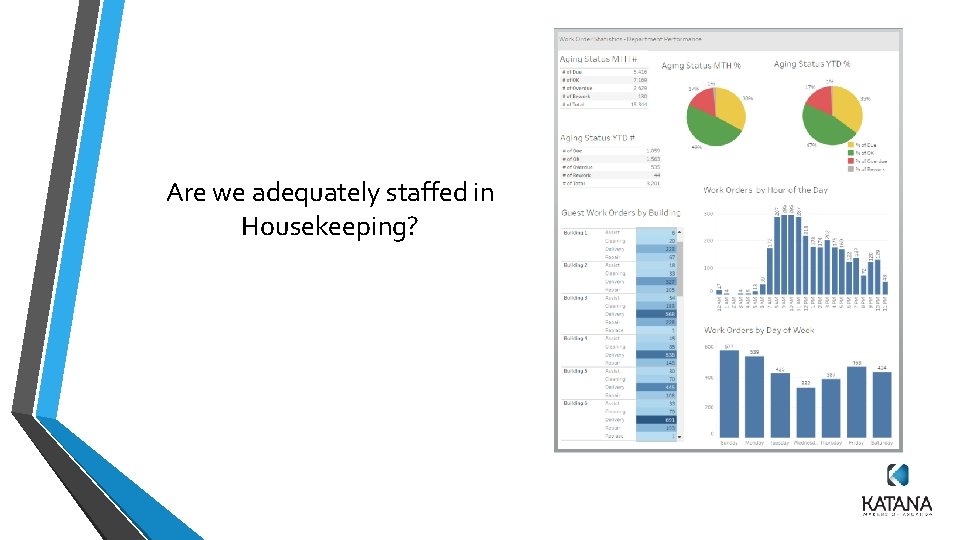
Are we adequately staffed in Housekeeping?
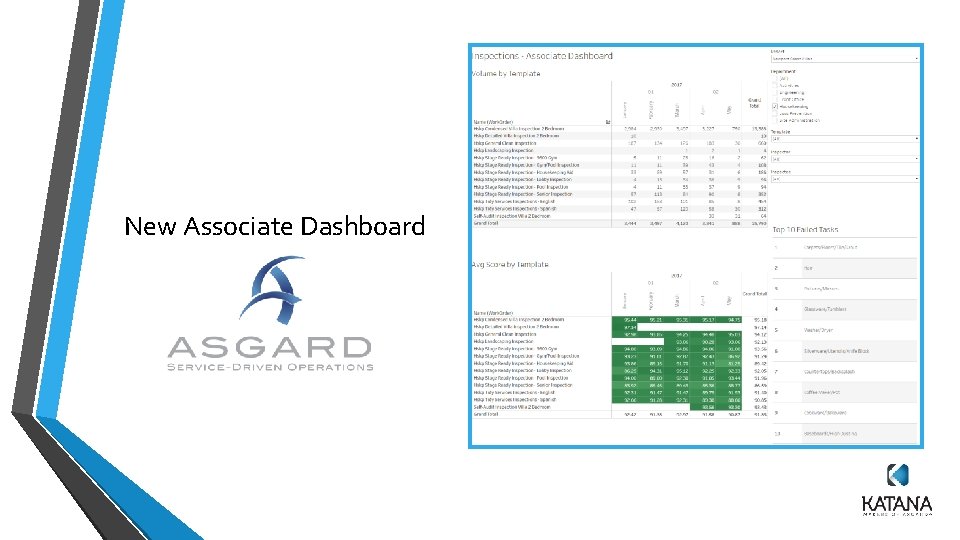
New Associate Dashboard
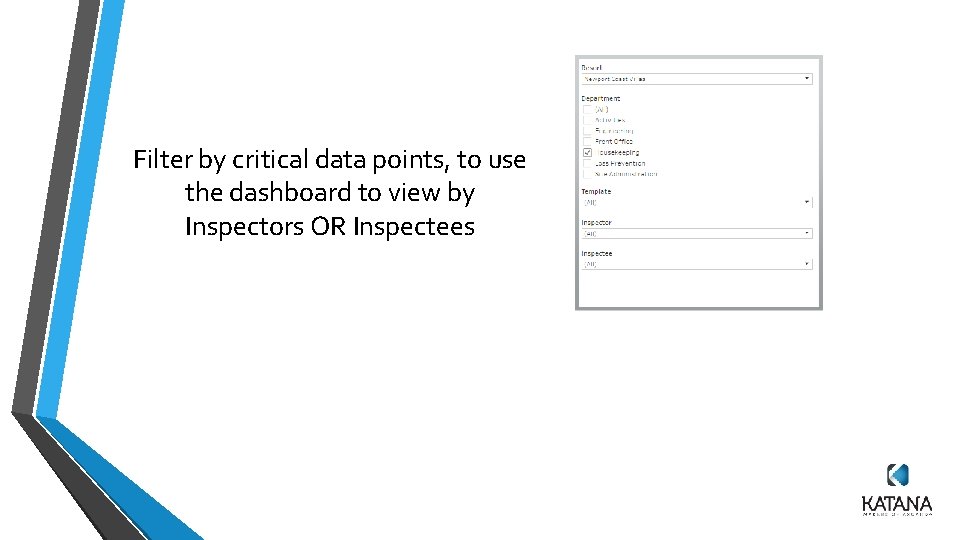
Filter by critical data points, to use the dashboard to view by Inspectors OR Inspectees
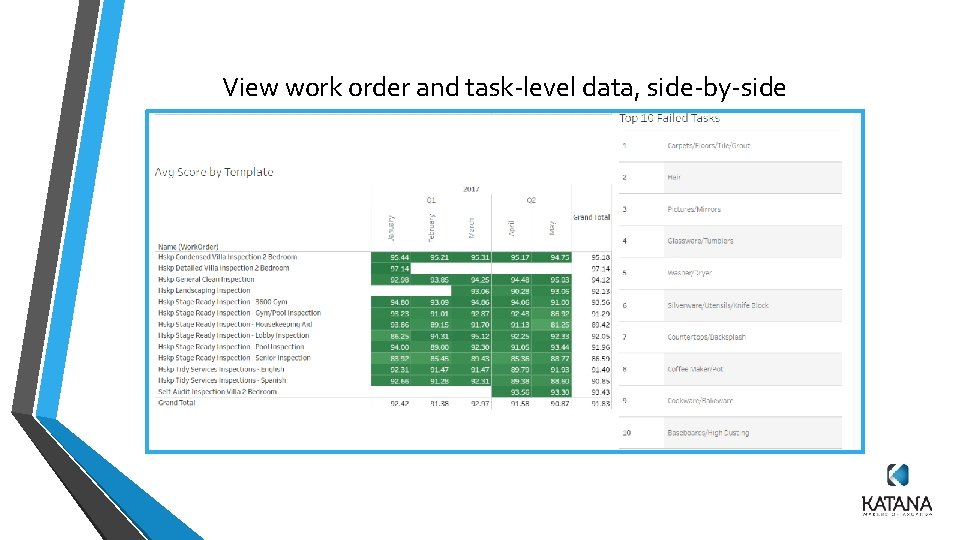
View work order and task-level data, side-by-side
Test the Solution • Layered, Numerous Display Options • Interactive: Hover-Over, Filter, Drill. Down Capabilities Next Steps / Call to Action • Mobile-Friendly, Accessible • Test/Use the new Associate • End-User Accessible and • Submit ideas for further Anywhere Customizable • Secure Dashboard improvements and enhancements
Next Steps Update on Installation of Tableau Reader
Next Steps Brainstorming Dashboard Concepts • • • Visualize your universe • • • Can the findings be leveraged to crush costs, increase revenue, and improve satisfaction? What sources of data are available/needed? (Inputs and Outputs) How can the data be moved/accessed? What platforms are available/needed? Identify user communities need to be involved to make the project a success • • • Line staff to understand tactical measures Resort leadership to understand strategic goals Katana/Asgard to understand technical impediments/opportunities Test your solution
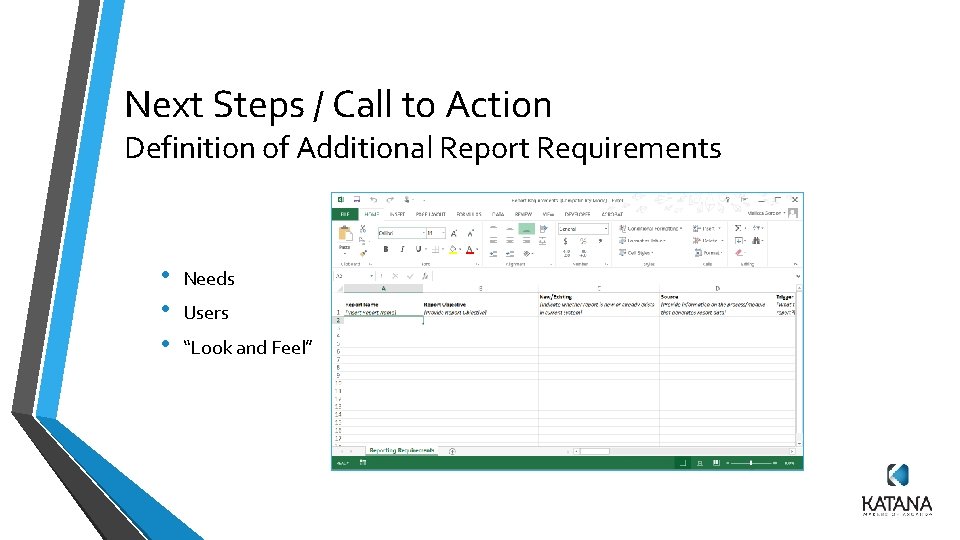
Next Steps / Call to Action Definition of Additional Report Requirements • • • Needs Users “Look and Feel”
“ The right information in the right hands, at the right time, presented in the most compelling way, yields incredibly golden results. ” But, even the right information presented too late, to the wrong people, or with too much complexity will not create business value. For further questions, inspiration, or assistance contact mgordon@katanasoft. com