Worldwide energy stats Total energy consumption 15 TW
 in 2004 (86. 5")
 Energy (1018 J/yr) % Oil 5. 6")
 Batteries")


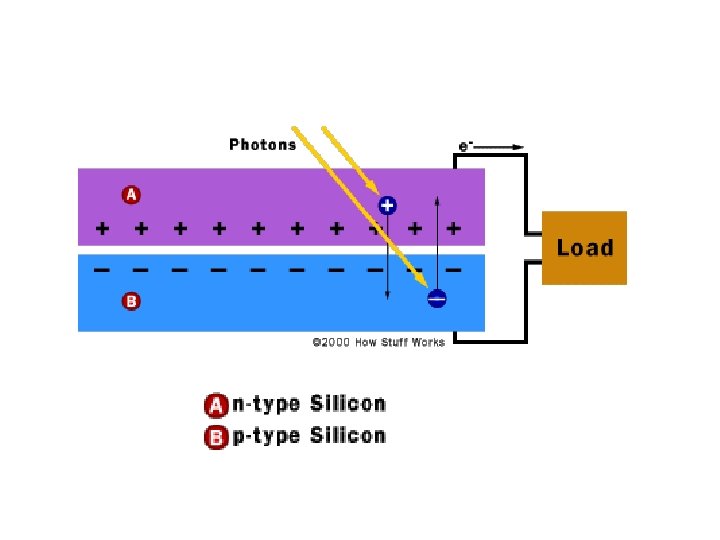
 and p-doped Si (electron poor)")

 • Manufacturing cost (materials and methods) • Net")


 technologies • Large scale electricity plants in the Southwest US")


 • A planned test gone horribly wrong • The test – See")


 Regio n 530 60 - > 900 3060 NE")


 • Transportation 20 % • Industrial 38 % •")


- Slides: 71
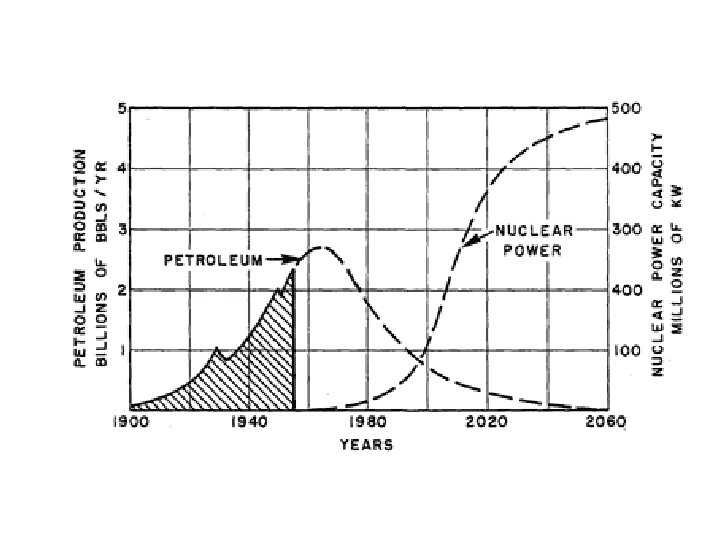
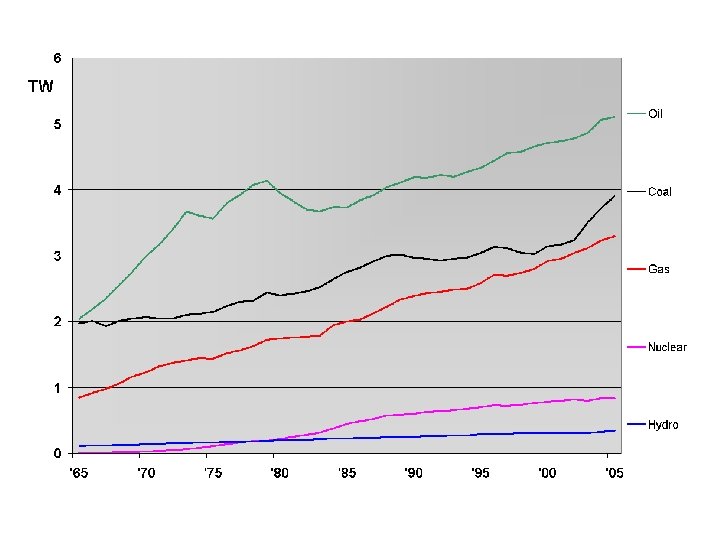
Worldwide energy stats • Total energy consumption: 15 TW (1012) in 2004 (86. 5 % from fossil fuels) • This corresponds to 5· 1020 J/yr • Worldwide reserves of fossil fuels 4000· 1020 J (800 yrs) • 2. 5· 1024 J of uranium reserves • Renewable energy flux from the sun (radiation, wind, waves) 120 PW (1015) or 3. 8· 1024 J/yr
Energy Consumption Breakdown Fuel type Power (TW) Energy (1018 J/yr) % Oil 5. 6 180 38 Gas 3. 5 110 24 Coal 3. 8 120 26 Hydroelectric 0. 9 30 6 Nuclear 0. 9 30 6 0. 13 4 0. 9 14. 83 474 100 Geo, wind, solar, wood Total
EERE funded by DOE $2. 3 B • • • Biofuels ($235 M) Batteries ($200 M) Fuel Cells ($68 M) Hydrogen (cut from 2010 budget, considered too long term) Solar cells ($320 M) Wind ($75 M) Water/Geothermal ($30 M / $50 M) Green Buildings ($237 M) Financing for states, industry and consumers to encourage adoption ($350 M) Nuclear ($845 M /$191 for Gen IV)) Office of Nuclear energy Fusion ($421 M) Office of Science ($4. 9 B)
Potential for solar • A land mass of about 100 x 100 miles in the Southwest U. S. -less than 0. 5% of the U. S. mainland mass, or about 25% of the area currently used for the nation's highway/roadway system-could provide as much electricity as presently consumed in the United States. • Truly renewable, with a net positive energy • Can be converted into electricity
Solar cells • For use at site of power use • Integration of solar energy into the electrical grid • Semi-conductor – – – Absorb photon Excite electron into conduction band Mobile electron holes directional flow of electrons An array of solar cells produce a usable quantity of direct current (DC) – Store the charge that is produced
n-doped Si (electron rich) and p-doped Si (electron poor)
Types of solar cells • Wafer- based crystaline silicon – Mono vs. poly (less efficient, but cheaper) • Thin film Si – more flexible, lighter • Cadmium telluride (Cd/Te) solar cell – easier to deposit/large scale production • Cu/In/Ga • Organic polymer cells (low cost, large scale production and flexibility, poor efficiency) • Sensitized Solar cells (Grätzel cells); semiconductor formed between photo-sensitized anode and an electrolyte
Performance • Efficiency (5 -20 %) • Manufacturing cost (materials and methods) • Net Energy Analysis (Break even in 1 -7 yrs depending on solar cell) • Trade-off between efficiency and cost
Additional factors • Solar concentrators (use a large area of lenses or mirrors to focus sunlight on a small area of photovoltaic cells) – 400 suns – 300 times reduction of materials • Inverters and grid integration – One way to two way grids that communicate
Table 2. 1– 3 Technical Barriers in Photovoltaics Photovoltaic Technical Barriers Modules A. Material Utilization & Cost B. Design & Packaging C. Manufacturing Processes D. Efficiency Inverters & Other BOS E. Inverter Reliability & Grid Integration F. Energy Management Systems G. BOS Cost & Installation Efficiency Systems Engineering & Integration H. Systems Engineering I. Modularity & Standardization J. Building-integrated products
2015 Goal • PV-produced electricity and domestic installed PV generation capacity of 5 -10 GW • 1000 GW/yr of electricity in US • Much more long term
Concentrating Solar Power (CSP) technologies • Large scale electricity plants in the Southwest US • CSP plants produce power by first converting the sun’s energy into heat, next into mechanical power, and lastly, into electricity in a conventional generator. • Thermal storage (molten salt) or hybrid natural gas system
Nuclear Energy • How does a nuclear reactor work? • Is it a major energy source worldwide? • Problems – Waste Disposal – Accidents • Future – Research – Generation IV
Nuclear Energy Plant • Nuclear Fission • 235 U + n → 236 U → 92 Kr + 141 Ba + g + 3 n • Chain Reaction • Controlled by control (graphite) rods and water coolant • Heat from reactor is cooled by circulating pressurized water • Heat exchange with secondary water loop produces steam • Steam turns turbine generator to produce electricity
Present Nuclear Energy • 100 plant produce about 20 % of the electricity in US • 431 plants worldwide in 31 countries produce about 17 % of the world’s electricity • Environmental Impact – No Greenhouse gases – Completely contained in normal operation – Spent fuel issue
Waste Disposal • Waste kept at plant, but running out of room. • Site chosen in Nevada for nuclear waste. • Research on safe transportation • Nuclear proliferation; fuel is very dilute and not easily converted to weapons grade • Stored in very heavy casings (difficult to steal)
Accidents • • Nuclear Meltdown Chernobyl Three Mile Island Environmentalist watch dogs note other near misses in recent years
Chernobyl (1986) • A planned test gone horribly wrong • The test – See if turbine generator could power the water pumps that cool the reactor in the event of a loss of power – Crew shut off power too rapidly, producing a Xe isotopes that poisons the reactor – In response the rods were lifted to stimulate reaction – The lower cooling rate of the pumps during the experiment led to steam buildup that increase reactor power – Temperature increased so rapidly, that rod insertion could not be performed in time to stop meltdown – Roof blew off, oxygen rushed in a caused fire that spread radioactive material over a large area
Blame Management communication A bizarre series of operator mistakes Plant design, poor or no containment vessels Large positive void coefficient (steam bubbles in coolant) Poor graphite control rod design Poorly trained operators Shut off safety systems Helicopter drops Coverup
Consequences • • • Deaths of plant and workers Medical problems (short and large term) Thyroid cancer Contaminated soil as far as Great Britain Billions of $
Three Mile Island • Partial meltdown • No radiation escaped • Caused fear of nuclear power and cost $ in terms of clean up • Operator error and lack of safety backups in design • In some ways the accident showed how the kind of catastrophic disaster at Chernobyl is avoidable
types • • Generation I – retired; one of a kinds In operation Gen II and Gen III Gen II was a large design changes Gen III and Gen II, upgraded with many safety features along the way • Gen III plus (passive safety systems) • Gen IV, 30 yrs away
Gen IV • • • Very High Temperature Reactor Advance Nuclear Safety; Address Nuclear Nonproliferation and Physical Protection Issues; Are Competitively Priced Minimize Waste and Optimize Natural Resource Utilization Compatible with Hydrogen Generation
Gen IV Roadmap - 2002 • Solicited design models • Chose six design models to base future research • Out of these six, the DOE has relatively recently selected two for further investment – Very-High Temperature Reactor (VHTR) – Sodium-Cooled Fast Reactors (SFR)
Very-High Temperature Reactor • Reach temperatures > 1000 C • Drive water splitting for hydrogen production – 2 M m 3 • 50% efficiency for producing electricity • Heat and power generation • Fuel recycling/reprocessing • Fuel coating requirements, absorbers, ceramic rods, vessel materials, passive heat removal systems
Show pic
Actinide management • To support effective actinide management a fast reactor must have a compact core with a minimum of materials which absorb or moderate fast neutrons. This places a significant heat transfer requirement on the coolant.
Sodium-Cooled Fast Reactors • Old technology • Management of waste • Low system pressure, high thermal conductivity, large safety margins. • Burns almost all of the energy in uranium, as opposed to 1% in today’s plants • Smaller core with higher power density, lower enrichment, and lower heavy metal inventory. • Primary system operates at just above atmospheric pressure • Secondary sodium circulation that heats the water (if it leaks, no radiation release) • Demonstrated capability for passive shutdown and decay heat removal.
Show pic
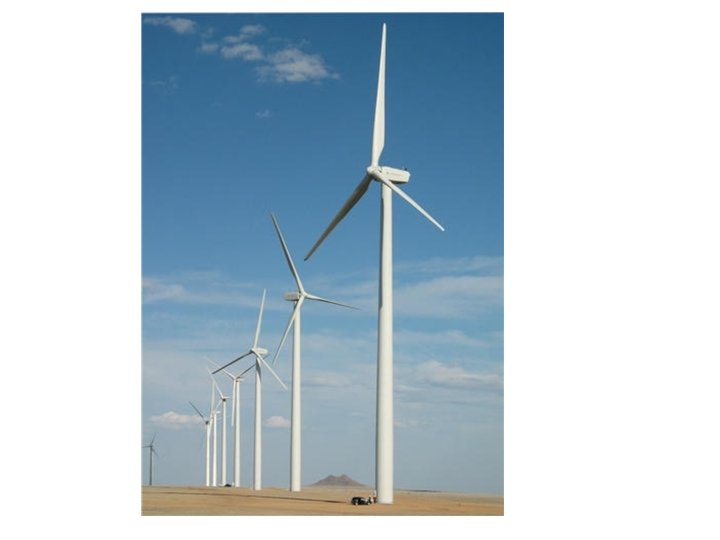
Wind Energy • Electricity • In 2005, 18 GW produced in US, enough to supply 1. 6 million households • By 2008, 121 GW worldwide (1. 5 %) • It has doubled in the last 3. 5 years • Largest farm in US in Texas – 421 turbines, 230, 000 homes • Cape Cod/Long Island plan • Capacity in US – 170 turbines, 25 sq miles, 500, 000 homes (2007) – 28, 635 MW, 1. 5 M homes (as of April 30, 2009).
# Nation 1 United States 2005 2006 2007 2008 9, 149 11, 603 16, 819 25, 170 2 Germany 18, 428 20, 622 22, 247 23, 903 3 Spain 10, 028 11, 630 15, 145 16, 740 4 China 1, 266 2, 599 5912 12, 210 5 India 4, 430 6, 270 7850 9, 587 6 Italy 1, 718 2, 123 2, 726 3, 736 779 1, 589 2, 477 3, 426 8 United Kingdom 1, 353 1, 963 2, 389 3, 288 9 Denmark 3, 132 3, 140 3, 129 3, 164 10 Portugal 1, 022 1, 716 2, 130 2, 862 11 Canada 683 1, 460 1, 846 2, 369 12 Netherlands 1, 236 1, 571 1, 759 2, 237 13 1, 040 1, 309 1, 528 1, 880 7 France
20 % by 2030 initiative • 300 GW goal • The wind industry is on track to grow to a size capable of installing 16, 000 MW/year
Politics and economics • Not in my backyard • The cost of the project grows (the big dig phenomenon
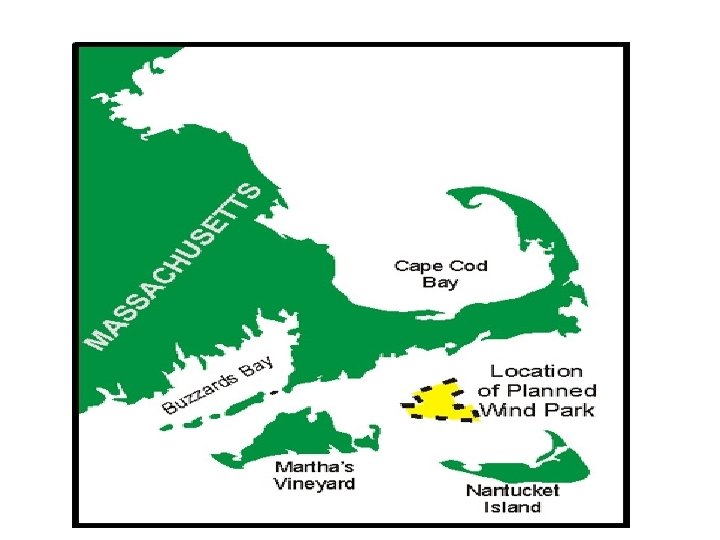
Cape cod • 130 wind turbines • 420 megawatts • 3/4 of the Cape and Islands electricity needs • The late Senator Kennedy and the candidates for his seat.
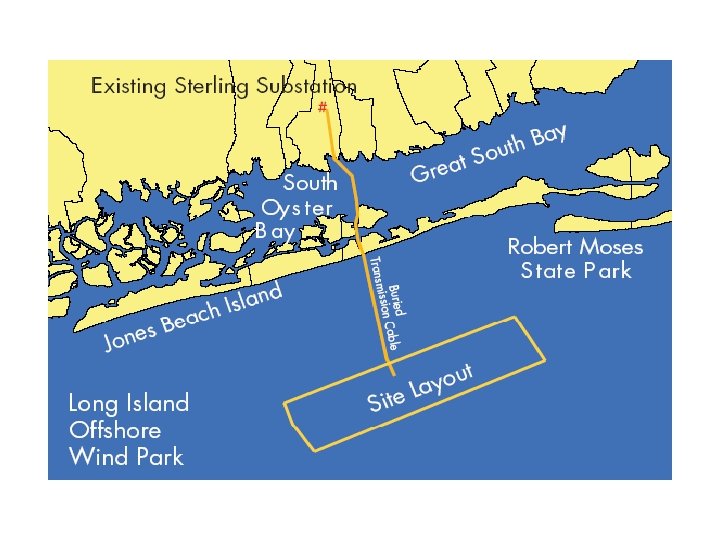
Long Island Wind Farm • Each wind turbine will generate 3. 6 megawatts. • The project will consist of 40 turbines, producing a total of 140 megawatts. • The facility will generate enough energy to power approximately 44, 000 homes. • Each turbine rotor has three blades approximately 182 ft. long. • The turbines shut down at wind speeds beyond 56 mph. • Project called off in 2007 (voted down) • But new project surfacing in 2008/09 700 (MWs)
Rhode Island • State officials picked Deepwater Wind to build a $1. 5 -billion, 385 -megawatt wind farm in federal waters off Block Island. The 100 -turbine project could provide 1. 3 terawatt-hours (TW·h) of electricity per year - 15 percent of all electricity used in the state.
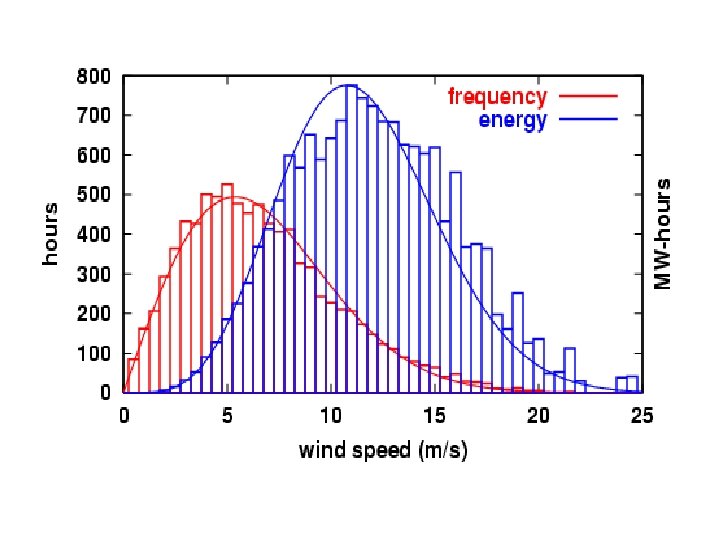
2005 Report from the National Renewable Energy Laboratory • Estimates offshore US wind potential • Offshore has several advantages over onshore – Land with greatest wind potentials are far from populated centers – Less of an eye sore – Stronger, more dependable winds – Use of larger, more economical turbines
GW by Depth (m) Regio n 530 60 - > 900 3060 NE 10. 130. 3 43. 5 6 0. 0 Midatlanti c 64. 126. 3 2 Great lakes 15. 193. 5 11. 6 6 0. 0 45. 3 30. 0 Califo 47. 168. rnia 0. 0 0. 3 8 0 US Offshore Wind Resource Exclusions Inside 5 nm – 100% exclusion�� Pacifi 100. 68. 67% -5 to 20 nm resource exclusion to account for avian, marine mammal, c NW 0. 0 1. 6 4 2 view shed, restricted habitats, shipping routes & other habitats. �� 90. 183. 517. 266. 33% exclusion– 20 to 50 nm�� Total 1 2 7 2
Deep Water Wind Turbine Development
Deep water • In June 2009, Secretary of the Interior Ken Salazar issued five exploratory leases for wind power production on the Outer Continental Shelf offshore from New Jersey and Delaware. The leases authorize data gathering activities, allowing for the construction of meteorological towers on the Outer Continental Shelf from six to 18 miles offshore.
US Potential • Over 1 TW, which is about equal to the total capacity for electricity generation in US. • Requires research into the construction of off(off)shore turbines • Research into potential environmental impacts • Research into best sites (wind/wave action, whale migration, ect. ) • 10 -15 yrs from commercial deepwater technology
Hydro • 7 % of US electricity • 70 % of renewable electricity • Research: – improving environmental impact of damming – Expand use – Hydrokinetic (wave, tidal, current, and ocean thermal energy)
Potential of harnessing wave energy • Young technology • But maybe 7 % of our total electricity
Fusion • Rxn • Nuclei confined by magnetic field • Capture neutrons – Extract heat – Drive reaction (self-sustained) • • Steam-turbine-electricity Physics of plasma Materials Stability
Research timeline • JET – 16 MW for 0. 5 s – 1983 -2004 • ITER – 500 MW for 1000 s – 2018 start date • DEMO – 2000 MW continuously – 2030 -2040
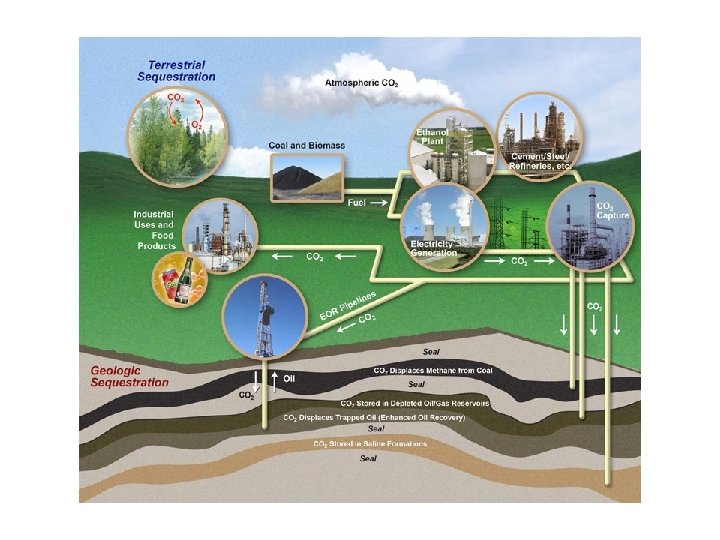
Carbon trapping
Energy use by sector (worldwide) • Transportation 20 % • Industrial 38 % • Residential heating, lighting, and appliances 11 % • Commercial heating, lighting, sewer, ect, 5 % • 27 % lost in generation and transmission
Hydrogen Generation • Uses Solar energy to generate hydrogen • Photovoltaic cells convert light to electricity that drives electrochemical splitting of water to hydrogen and oxygen • Earlier studies estimate the maximum conversion efficiencies of 15 % • Conversion efficiencies of 30 % have been demonstated
30 % obtained by • Eliminating the linkage of photo to electrolysis surface area • Ideal matching of photo- and electrolysis potentials • Incorporating better electrolysis catalysts • Incorporating efficient multiple bandgap photosensitizers
Hypothesis • Further improvements can be made by using the photons that are below the minimum band gap energy of the sensitizers to heat the water. • Theory predicts that the potential needed to drive electrolysis decreases with increasing temperature and lowers the overpotential. • This would increase the efficiency of electrolysis to about 40 -50 %
Attempt to put the idea into perspective • How much energy could be produced from this type of solar tower? • From Figure 3, the potential power collected by the photosensitizer is about 80 m. W/cm 2 • This equates to 80· 108 W/km 2 • Total Energy consumption (worldwide) is 1. 5· 1013 W • Photosensitizers would have to take up an area of 18800 km 2 (100 % efficiency), 100000 km 2 (18 %), 38000 km 2 (50 %) • 18%: PA, 50 %: Conn and MA
Figures
Electric Cars • Plug in to charger in garage • Limited mileage, but ideal for most commuters • Equivalent to over 150 mpg on a cost basis • Pb, Ni. Cd, Ni. MH, Li ion polymer batteries (expensive to replace)
Toyota RAV 4 -EV • Only 328 leased/purchased to individuals in 2003 -04. • Sold for $42000 in CA and Arizona (with Cal rebate; $29, 000 • Battery replacement $26000 (third party vendors) • About 80 -120 miles (130 -190 km) on full battery • Top speed 78 miles/hr • 0 -60 in 18 s • Charging takes 5 hrs
Debate: why have these electric cars not been successful • Cost? • Performance? • Conspiracy between oil companies and auto industry
2007 electric cars • • • Telsa Roadster 100 vehicles to be sold, 650 in 2008 Lithium ion batteries 0 -60 in 4 s 135 mph equiv. 2 cents/mile 245 miles/charge Top speed: 125 mph $90, 000 Company Strategy
Who killed the electric car? • Chris Payne 2007 Documentary • Consumers – Lots of ambivalence to new technology, unwillingness to compromise on decreased range and increased cost for improvements to air quality and reduction of dependence on foreign oil. • Batteries – Limited range (60 -70 miles) and reliability Lithium ion batteries, the same technology available in laptops would have allowed the EV-1 to be upgraded to a range of 300 miles per charge. • Oil companies – Fearful of losing business to a competing technology, they supported efforts to kill the ZEV mandate. They also bought patents to prevent modern batteries from being used in US electric cars. • Car companies – Negative marketing, sabotaging their own product program, failure to produce cars to meet existing demand, unusual business practices with regards to leasing versus sales.
Continued • Government – The federal government joined in the auto industry suit against California, has failed to act in the public interest to limit pollution and require increased fuel economy, has promoted the purchase of vehicles with poor fuel efficiency through preferential tax breaks, and has redirected alternative fuel research from electric towards hydrogen. • California Air Resources Board – The CARB, headed by Alan Lloyd, caved to industry pressure and repealed the ZEV mandate. Lloyd was given the directorship of the new fuel cell institute, creating an inherent conflict of interest. • Hydrogen fuel cell – The hydrogen fuel cell was presented by the film as an alternative that distracts attention from the real and immediate potential of electric vehicles to an unlikely future possibility embraced by automakers, oil companies and a pro-business administration in order to buy time and profits for the status quo. GM is bring back the EV this coming year. It will be a hybrid that also plugs into the wall.
Li ion battery • • • Battery specifications Energy/weight 160 Wh/kg Energy/size 270 Wh/L Power/weight 1800 W/kg Charge/discharge efficiency 99. 9%[1] Energy/consumer-price 2. 8 -5 Wh/US$[2] Self-discharge rate 5%-10%/month Time durability(24 -36) months Cycle durability 1200 cycles Nominal Cell Voltage 3. 6 / 3. 7 V
electrochemistry • In a lithium-ion battery the lithium ions are transported to and from the cathode or anode, with the transition metal, Co, in Lix. Co. O 2 being oxidized from Co 3+ to Co 4+ during charging, and reduced from Co 4+ to Co 3+ during discharge.
Recent Advances • Nano-sized titanate electrode material for lithium-ion batteries. I • three times the power output of existing batteries and can be fully charged in six minutes. • 20, 000 recharging cycles, so durability and battery life are much longer, estimated to be around 20 years • The batteries can operate from -50 °C to over 75 °C and will not explode or result in thermal runaway even under severe conditions because they do not contain graphite-coated-metal anode electrode material • The batteries are currently being tested in a new production car made by Phoenix Motorcars which was on display at the 2006 SEMA motorshow. • In March 2005, Toshiba announced another fast charging lithium-ion battery, based on new nano-material technology, that provides even faster charge times, greater capacity, and a longer life cycle. The battery may be used in commercial products in 2006 or early 2007, primarily in the industrial and automotive sectors.