Industrial Industrial sector energy consumption Industrial energy consumption


- Slides: 8

Industrial

Industrial sector energy consumption Industrial energy consumption by fuel AEO 2021 Reference case Industrial energy consumption by subsector AEO 2021 Reference case quadrillion British thermal units 40 35 2020 projections 40 35 30 30 25 25 natural gas hydrocarbon gas liquids petroleum renewables purchased electricity coal 20 15 10 5 0 2020 2030 2040 2050 2020 projections 20 15 10 5 0 2020 2030 Source: U. S. Energy Information Administration, Annual Energy Outlook 2021 (AEO 2021) 2040 nonmanufacturing non-energyintensive other energyintensive bulk chemicals feedstocks bulk chemicals heat and power refining other 2050 www. eia. gov/aeo 2

Industrial sector delivered energy consumption across cases Industrial delivered energy consumption AEO 2021 selected side cases quadrillion British thermal units 2020 history projections 45 High Economic Growth High Oil Price High Oil and Gas Supply Reference Low Oil Price Low Oil and Gas Supply Low Economic Growth 40 35 30 25 20 15 2000 2010 2020 2030 2040 Source: U. S. Energy Information Administration, Annual Energy Outlook 2021 (AEO 2021) 2050 www. eia. gov/aeo 3

Industrial sector energy intensity Energy intensity by subsector AEO 2021 Reference case Energy-intensive manufacturing by industry AEO 2021 Reference case total industry cement and lime 2020 2030 2040 2050 manufacturing 2020 2030 2040 2050 iron and steel refining paper energy-intensive manufacturing bulk chemical feedstocks bulk chemical heat and. . . non-energy intensive manufacturing glass aluminum non-manufacturing food 0 2 4 6 0 8 trillion British thermal units per billion 2012 dollar shipments 5 10 15 20 25 trillion British thermal units per billion 2012 dollar shipments Source: U. S. Energy Information Administration, Annual Energy Outlook 2021 (AEO 2021) www. eia. gov/aeo 4

Bulk chemicals industry energy consumption by fuel Bulk chemicals industry energy consumption by energy source, including feedstocks AEO 2021 Reference case quadrillion British thermal units 12 10 purchased electricity renewables coal petroleum products hydrocarbon gas liquids residual and distillate fuel oil natural gas 8 6 4 2 0 2025 2030 2035 2040 2045 2050 Source: U. S. Energy Information Administration, Annual Energy Outlook 2021 (AEO 2021) www. eia. gov/aeo 5

Iron and steel industry energy consumption by fuel AEO 2021 Reference case quadrillion British thermal units 1, 5 propane and residual fuel oil purchased electricity coal natural gas 1, 0 0, 5 0, 0 2025 2030 2035 2040 2045 2050 Source: U. S. Energy Information Administration, Annual Energy Outlook 2021 (AEO 2021) www. eia. gov/aeo 6

Industrial sector combined-heat-and-power (CHP) generation CHP generation by industry AEO 2021 Reference case CHP generation by fuel AEO 2021 Reference case billion kilowatthours 300 billion kilowatthours 2020 projections 300 250 2020 projections 250 200 other 150 bulk chemicals 100 refining 50 50 paper 0 2020 2030 2040 coal other natural gas 0 2050 2020 Source: U. S. Energy Information Administration, Annual Energy Outlook 2021 (AEO 2021) 2030 2040 2050 www. eia. gov/aeo 7

Industrial sector carbon dioxide emissions and carbon intensity Industrial sector carbon dioxide emissions AEO 2021 economic growth cases Industrial sector carbon intensity AEO 2021 Reference case billion metric tons of carbon dioxide per billion British thermal units 2, 0 2020 history projections 60 2020 history projections history High Economic 50 Growth 1, 5 Reference 1, 0 Low Economic Growth carbon intensity (excluding power sector emissions) 40 carbon intensity (including power sector emissions) 30 20 0, 5 10 0, 0 2000 2010 2020 2030 2040 2050 0 2000 2010 Source: U. S. Energy Information Administration, Annual Energy Outlook 2021 (AEO 2021) 2020 2030 2040 2050 www. eia. gov/aeo 8
 Mri energy consumption
 Dynamic resolution scale
 Cuales son los factores de localización industrial
 Sector industrial maduro
 Public sector buildings energy efficiency
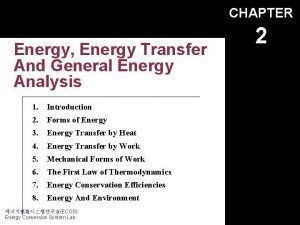
 Energy energy transfer and general energy analysis
 Energy energy transfer and general energy analysis
 World tea consumption
 Rdimm power consumption


