N CA Oracle Users Group Performance Diagnostics using


- Slides: 26

N. CA Oracle Users Group Performance Diagnostics using STATSPACK data 18 -May 2006 Tim Gorman Sage. Logix, Inc.

Agenda • • • Configuring STATSPACK optimally About the STATSPACK repository Analysis using the STATSPACK repository

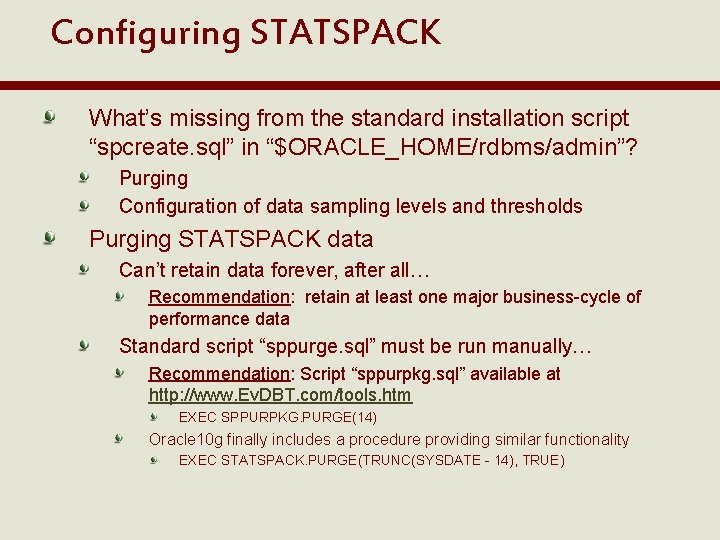
Configuring STATSPACK What’s missing from the standard installation script “spcreate. sql” in “$ORACLE_HOME/rdbms/admin”? Purging Configuration of data sampling levels and thresholds Purging STATSPACK data Can’t retain data forever, after all… Recommendation: retain at least one major business-cycle of performance data Standard script “sppurge. sql” must be run manually… Recommendation: Script “sppurpkg. sql” available at http: //www. Ev. DBT. com/tools. htm EXEC SPPURPKG. PURGE(14) Oracle 10 g finally includes a procedure providing similar functionality EXEC STATSPACK. PURGE(TRUNC(SYSDATE - 14), TRUE)

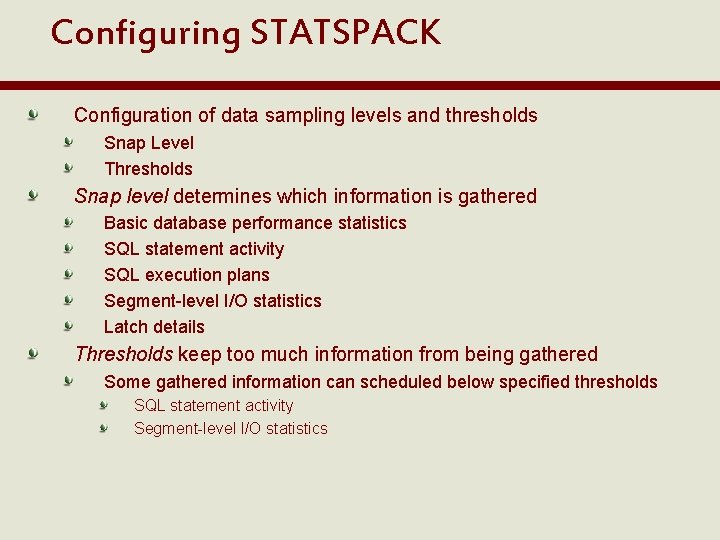
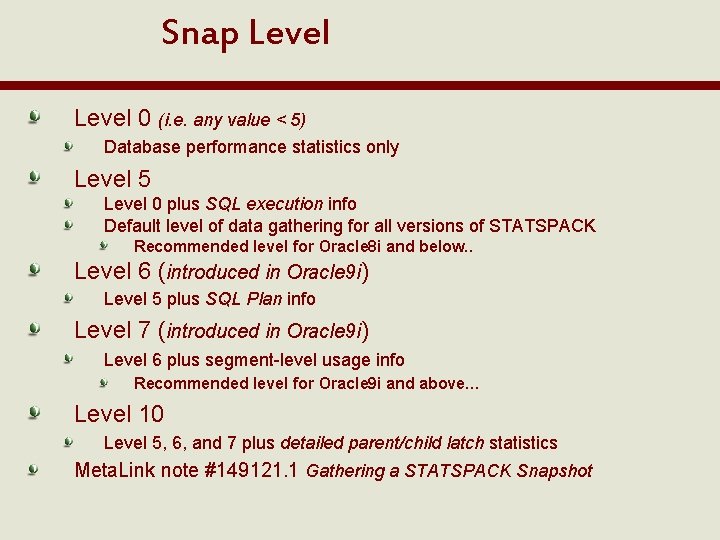
Configuring STATSPACK Configuration of data sampling levels and thresholds Snap Level Thresholds Snap level determines which information is gathered Basic database performance statistics SQL statement activity SQL execution plans Segment-level I/O statistics Latch details Thresholds keep too much information from being gathered Some gathered information can scheduled below specified thresholds SQL statement activity Segment-level I/O statistics

Snap Level 0 (i. e. any value < 5) Database performance statistics only Level 5 Level 0 plus SQL execution info Default level of data gathering for all versions of STATSPACK Recommended level for Oracle 8 i and below. . Level 6 (introduced in Oracle 9 i) Level 5 plus SQL Plan info Level 7 (introduced in Oracle 9 i) Level 6 plus segment-level usage info Recommended level for Oracle 9 i and above… Level 10 Level 5, 6, and 7 plus detailed parent/child latch statistics Meta. Link note #149121. 1 Gathering a STATSPACK Snapshot

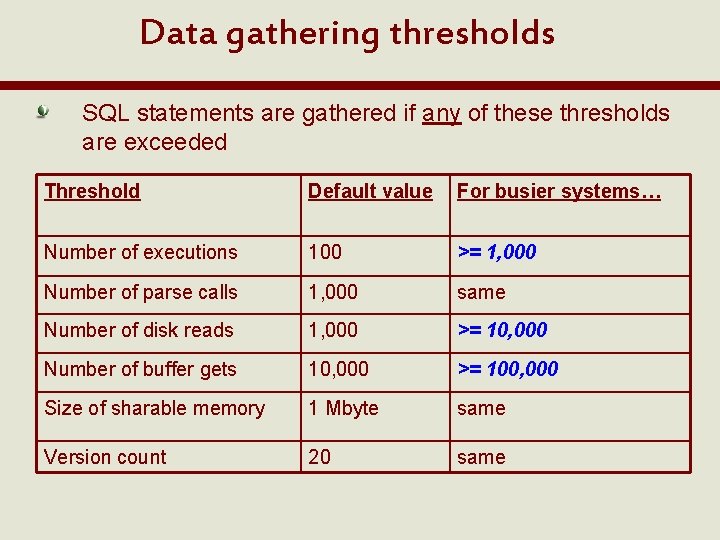
Data gathering thresholds SQL statements are gathered if any of these thresholds are exceeded Threshold Default value For busier systems… Number of executions 100 >= 1, 000 Number of parse calls 1, 000 same Number of disk reads 1, 000 >= 10, 000 Number of buffer gets 10, 000 >= 100, 000 Size of sharable memory 1 Mbyte same Version count 20 same

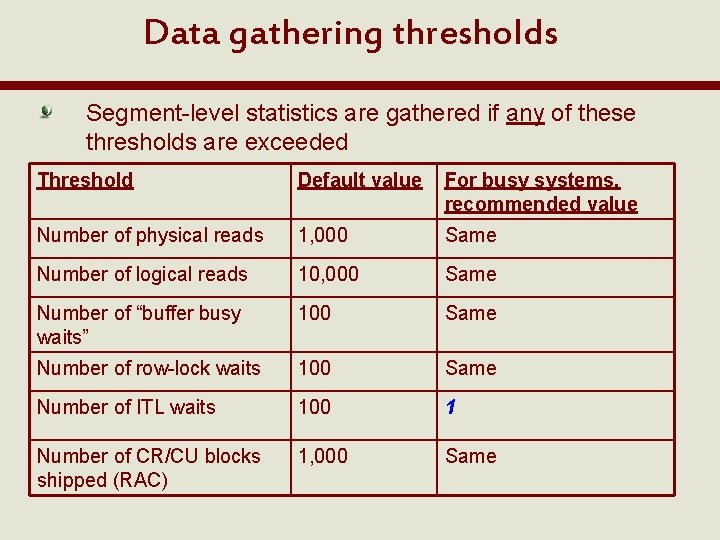
Data gathering thresholds Segment-level statistics are gathered if any of these thresholds are exceeded Threshold Default value For busy systems, recommended value Number of physical reads 1, 000 Same Number of logical reads 10, 000 Same Number of “buffer busy waits” 100 Same Number of row-lock waits 100 Same Number of ITL waits 100 1 Number of CR/CU blocks shipped (RAC) 1, 000 Same

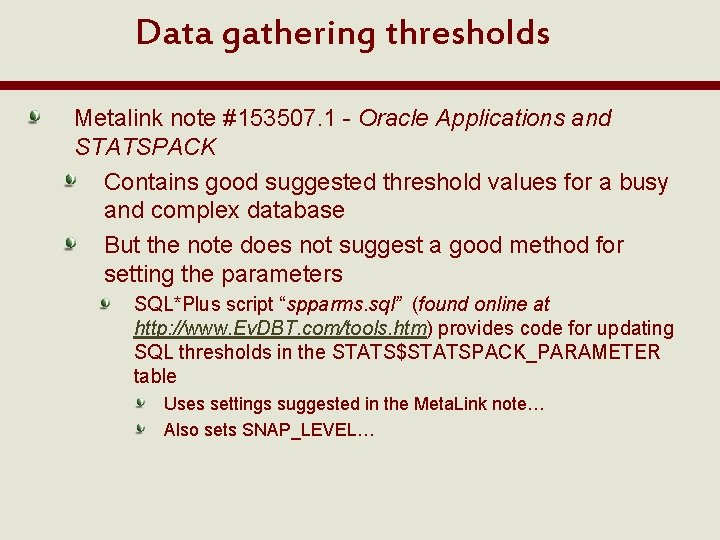
Data gathering thresholds Metalink note #153507. 1 - Oracle Applications and STATSPACK Contains good suggested threshold values for a busy and complex database But the note does not suggest a good method for setting the parameters SQL*Plus script “spparms. sql” (found online at http: //www. Ev. DBT. com/tools. htm) provides code for updating SQL thresholds in the STATS$STATSPACK_PARAMETER table Uses settings suggested in the Meta. Link note… Also sets SNAP_LEVEL…

Using STATSPACK But using STATSPACK isn’t all about the reports provided by Oracle The single main report requires some advance knowledge of a time period in which problems are occurring… Keep in mind that there is an amazing repository of information that can used for broad general analysis as well as specific targeted investigations Think of some interesting questions that arise during a troubleshooting session What changed between then and now? Is the current behavior an anomaly or normal for this environment? How much of resource XXX are we using? How much have we used over time?

Using STATSPACK In general, STATSPACK data will not provide a specific answer to a specific solution It is too high-level, too aggregated However, it can provide a general idea Enough to zero in on what should be examined more closely So…. . Use STATSPACK data to: Generalize the problem(s) Eliminate irrelevancies (!!!!) View trends from a high level Use extended SQL Tracing (event 10046, level > 1) to: Examine individual processes minutely Determine exactly what is happening in a specific process

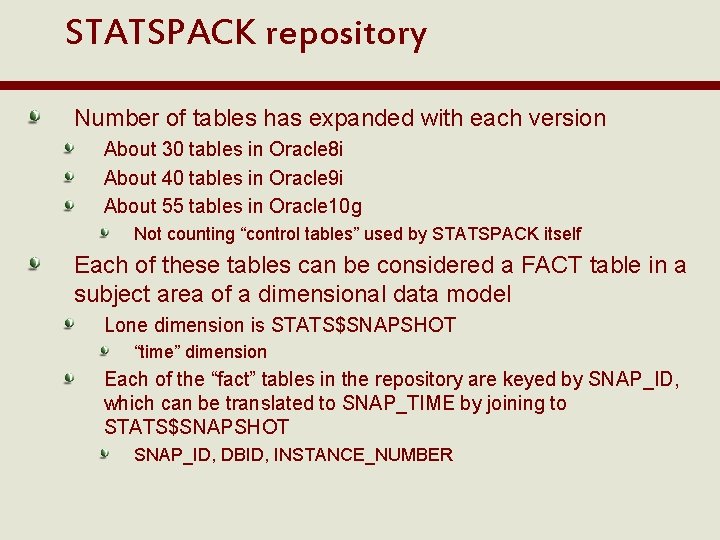
STATSPACK repository Number of tables has expanded with each version About 30 tables in Oracle 8 i About 40 tables in Oracle 9 i About 55 tables in Oracle 10 g Not counting “control tables” used by STATSPACK itself Each of these tables can be considered a FACT table in a subject area of a dimensional data model Lone dimension is STATS$SNAPSHOT “time” dimension Each of the “fact” tables in the repository are keyed by SNAP_ID, which can be translated to SNAP_TIME by joining to STATS$SNAPSHOT SNAP_ID, DBID, INSTANCE_NUMBER

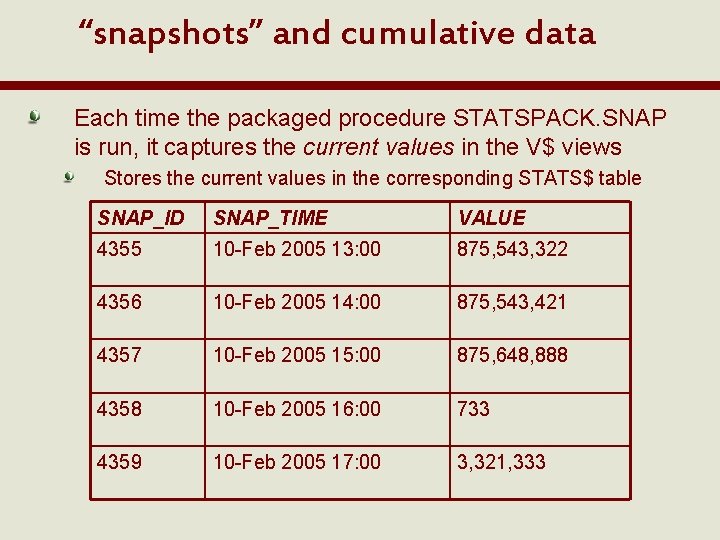
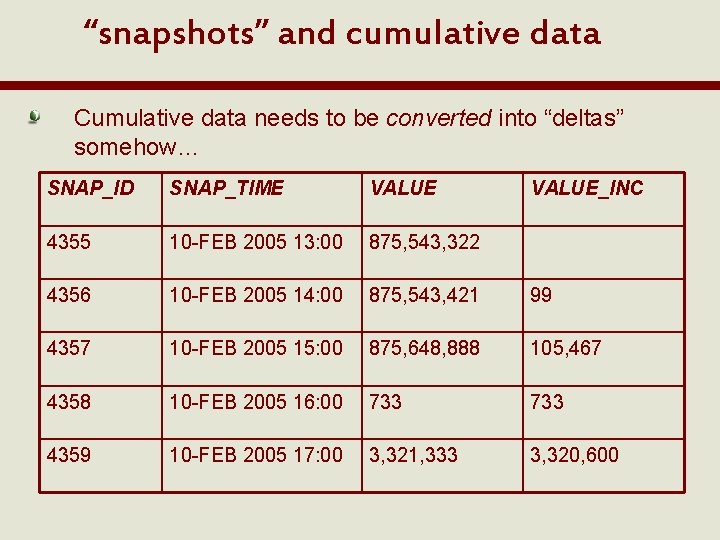
“snapshots” and cumulative data Each time the packaged procedure STATSPACK. SNAP is run, it captures the current values in the V$ views Stores the current values in the corresponding STATS$ table SNAP_ID SNAP_TIME VALUE 4355 10 -Feb 2005 13: 00 875, 543, 322 4356 10 -Feb 2005 14: 00 875, 543, 421 4357 10 -Feb 2005 15: 00 875, 648, 888 4358 10 -Feb 2005 16: 00 733 4359 10 -Feb 2005 17: 00 3, 321, 333

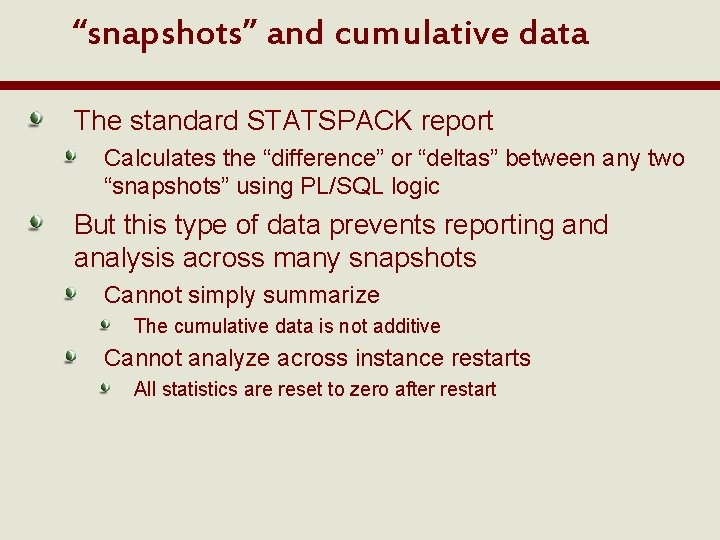
“snapshots” and cumulative data The standard STATSPACK report Calculates the “difference” or “deltas” between any two “snapshots” using PL/SQL logic But this type of data prevents reporting and analysis across many snapshots Cannot simply summarize The cumulative data is not additive Cannot analyze across instance restarts All statistics are reset to zero after restart

“snapshots” and cumulative data Cumulative data needs to be converted into “deltas” somehow… SNAP_ID SNAP_TIME VALUE_INC 4355 10 -FEB 2005 13: 00 875, 543, 322 4356 10 -FEB 2005 14: 00 875, 543, 421 99 4357 10 -FEB 2005 15: 00 875, 648, 888 105, 467 4358 10 -FEB 2005 16: 00 733 4359 10 -FEB 2005 17: 00 3, 321, 333 3, 320, 600

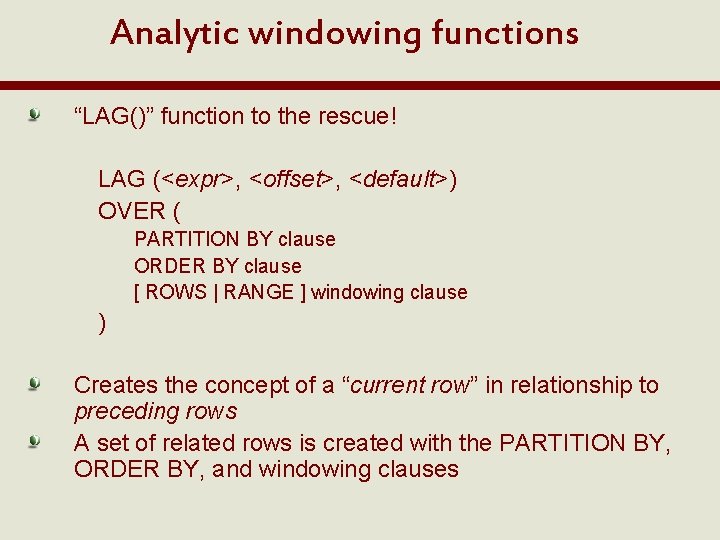
Analytic windowing functions “LAG()” function to the rescue! LAG (<expr>, <offset>, <default>) OVER ( PARTITION BY clause ORDER BY clause [ ROWS | RANGE ] windowing clause ) Creates the concept of a “current row” in relationship to preceding rows A set of related rows is created with the PARTITION BY, ORDER BY, and windowing clauses

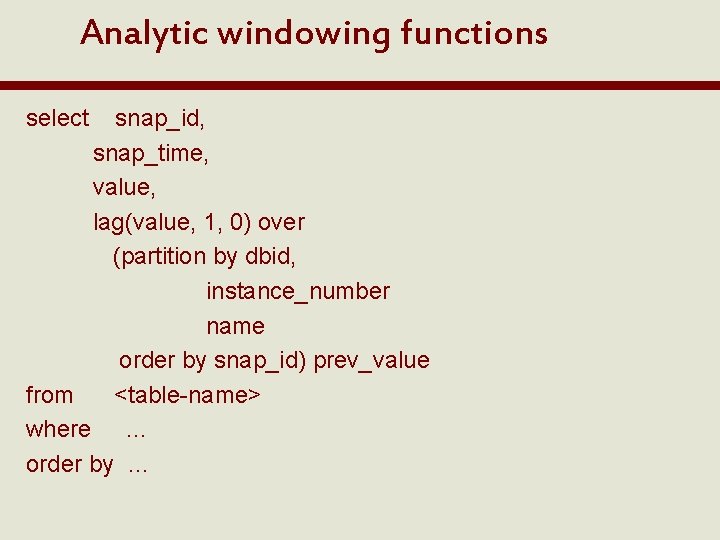
Analytic windowing functions select snap_id, snap_time, value, lag(value, 1, 0) over (partition by dbid, instance_number name order by snap_id) prev_value from <table-name> where … order by …

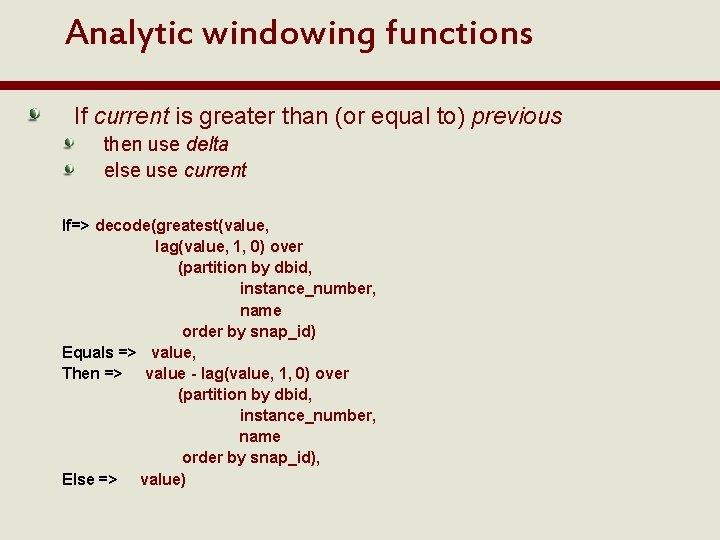
Analytic windowing functions If current is greater than (or equal to) previous then use delta else use current If=> decode(greatest(value, lag(value, 1, 0) over (partition by dbid, instance_number, name order by snap_id) Equals => value, Then => value - lag(value, 1, 0) over (partition by dbid, instance_number, name order by snap_id), Else => value)

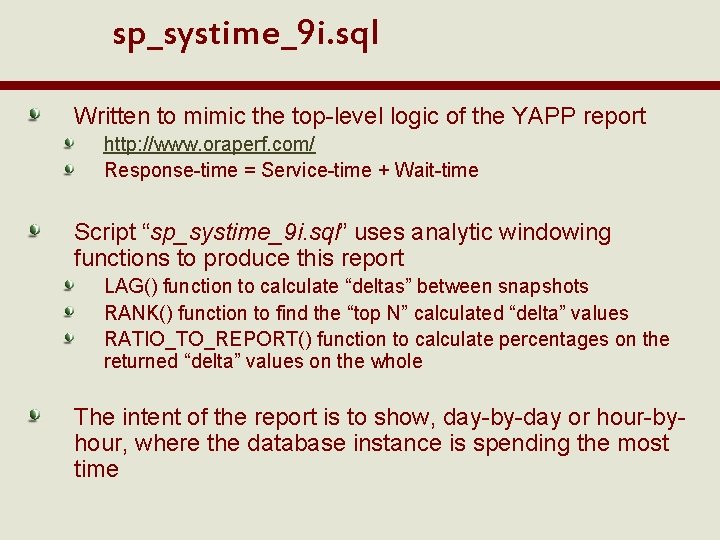
sp_systime_9 i. sql Written to mimic the top-level logic of the YAPP report http: //www. oraperf. com/ Response-time = Service-time + Wait-time Script “sp_systime_9 i. sql” uses analytic windowing functions to produce this report LAG() function to calculate “deltas” between snapshots RANK() function to find the “top N” calculated “delta” values RATIO_TO_REPORT() function to calculate percentages on the returned “delta” values on the whole The intent of the report is to show, day-by-day or hour-byhour, where the database instance is spending the most time

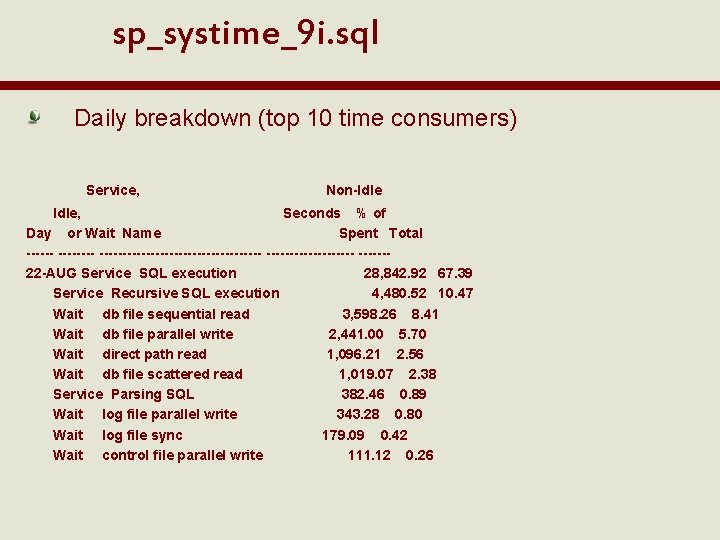
sp_systime_9 i. sql Daily breakdown (top 10 time consumers) Service, Non-Idle, Seconds % of Day or Wait Name Spent Total ------------------ ------22 -AUG Service SQL execution 28, 842. 92 67. 39 Service Recursive SQL execution 4, 480. 52 10. 47 Wait db file sequential read 3, 598. 26 8. 41 Wait db file parallel write 2, 441. 00 5. 70 Wait direct path read 1, 096. 21 2. 56 Wait db file scattered read 1, 019. 07 2. 38 Service Parsing SQL 382. 46 0. 89 Wait log file parallel write 343. 28 0. 80 Wait log file sync 179. 09 0. 42 Wait control file parallel write 111. 12 0. 26

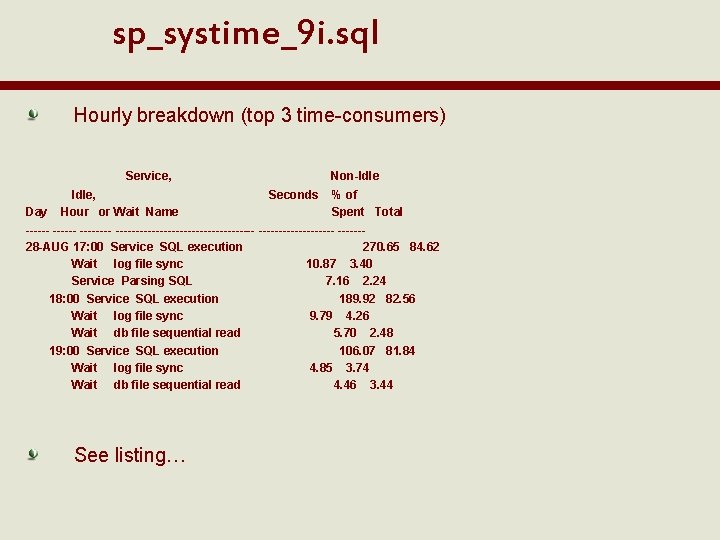
sp_systime_9 i. sql Hourly breakdown (top 3 time-consumers) Service, Non-Idle, Seconds % of Day Hour or Wait Name Spent Total ---------------------- ------28 -AUG 17: 00 Service SQL execution 270. 65 84. 62 Wait log file sync 10. 87 3. 40 Service Parsing SQL 7. 16 2. 24 18: 00 Service SQL execution 189. 92 82. 56 Wait log file sync 9. 79 4. 26 Wait db file sequential read 5. 70 2. 48 19: 00 Service SQL execution 106. 07 81. 84 Wait log file sync 4. 85 3. 74 Wait db file sequential read 4. 46 3. 44 See listing…

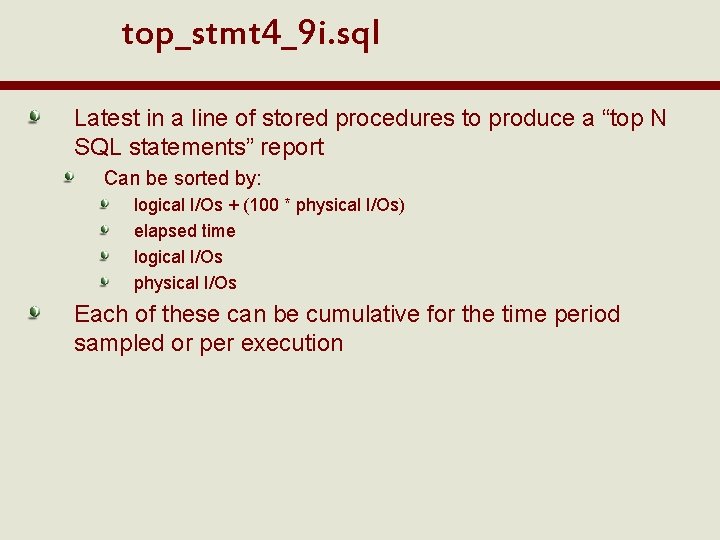
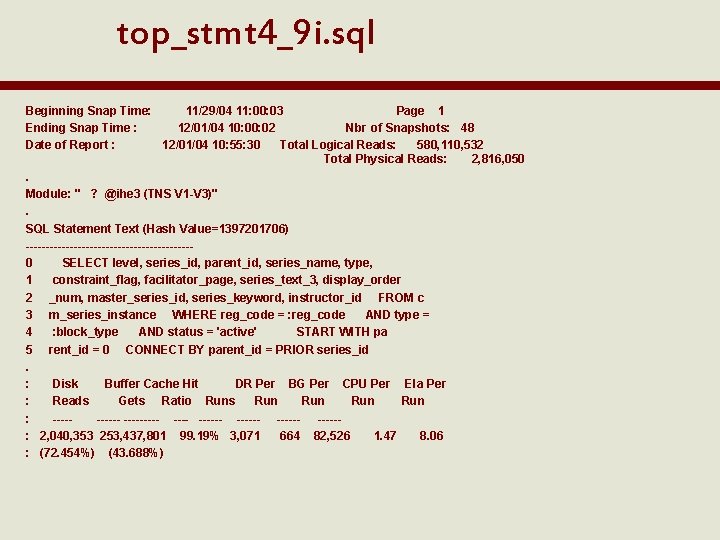
top_stmt 4_9 i. sql Latest in a line of stored procedures to produce a “top N SQL statements” report Can be sorted by: logical I/Os + (100 * physical I/Os) elapsed time logical I/Os physical I/Os Each of these can be cumulative for the time period sampled or per execution

top_stmt 4_9 i. sql Beginning Snap Time: 11/29/04 11: 00: 03 Page 1 Ending Snap Time : 12/01/04 10: 02 Nbr of Snapshots: 48 Date of Report : 12/01/04 10: 55: 30 Total Logical Reads: 580, 110, 532 Total Physical Reads: 2, 816, 050. Module: " ? @ihe 3 (TNS V 1 -V 3)". SQL Statement Text (Hash Value=1397201706) ---------------------0 SELECT level, series_id, parent_id, series_name, type, 1 constraint_flag, facilitator_page, series_text_3, display_order 2 _num, master_series_id, series_keyword, instructor_id FROM c 3 m_series_instance WHERE reg_code = : reg_code AND type = 4 : block_type AND status = 'active' START WITH pa 5 rent_id = 0 CONNECT BY parent_id = PRIOR series_id. : Disk Buffer Cache Hit DR Per BG Per CPU Per Ela Per : Reads Gets Ratio Runs Run Run : ----- ------ -----: 2, 040, 353 253, 437, 801 99. 19% 3, 071 664 82, 526 1. 47 8. 06 : (72. 454%) (43. 688%)

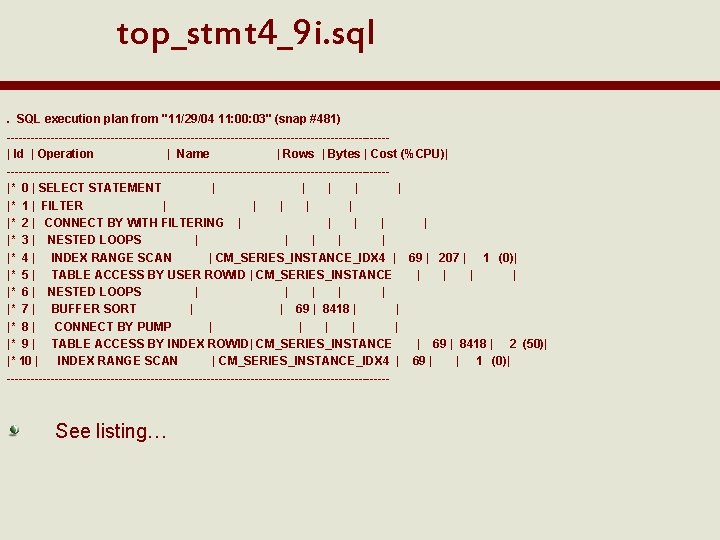
top_stmt 4_9 i. sql. SQL execution plan from "11/29/04 11: 00: 03" (snap #481) ------------------------------------------------| Id | Operation | Name | Rows | Bytes | Cost (%CPU)| ------------------------------------------------|* 0 | SELECT STATEMENT | | |* 1 | FILTER | | |* 2 | CONNECT BY WITH FILTERING | | |* 3 | NESTED LOOPS | | |* 4 | INDEX RANGE SCAN | CM_SERIES_INSTANCE_IDX 4 | 69 | 207 | 1 (0)| |* 5 | TABLE ACCESS BY USER ROWID | CM_SERIES_INSTANCE | | |* 6 | NESTED LOOPS | | |* 7 | BUFFER SORT | | 69 | 8418 | | |* 8 | CONNECT BY PUMP | | |* 9 | TABLE ACCESS BY INDEX ROWID| CM_SERIES_INSTANCE | 69 | 8418 | 2 (50)| |* 10 | INDEX RANGE SCAN | CM_SERIES_INSTANCE_IDX 4 | 69 | | 1 (0)| ------------------------------------------------ See listing…

Additional scripts Generic reporting enablement sp_delta_views. sql Based on STATS$SQL_SUMMARY and STATS$SQL_PLAN top_stmt 4_10 g. sql, top_stmt 4_9 i. sql, top_stmt 4_8 i. sql, run_top_stmt 4. sql sphistory. sql Based on STATS$SEG_STAT & STATS$SEG_STAT_OBJ sp_buffer_busy_waits. sql, sp_itl_waits. sql, sp_row_lock_waits. sql, sp_gc_waits. sql Based on STATS$PARAMETER sp_parm_changes. sql Based on STATS$SYSSTAT sptrends. sql Based on STATS$SYSTEM_EVENT sp_evtrends. sql Based on STATS$LATCH_MISSES sp_latch_misses. sql

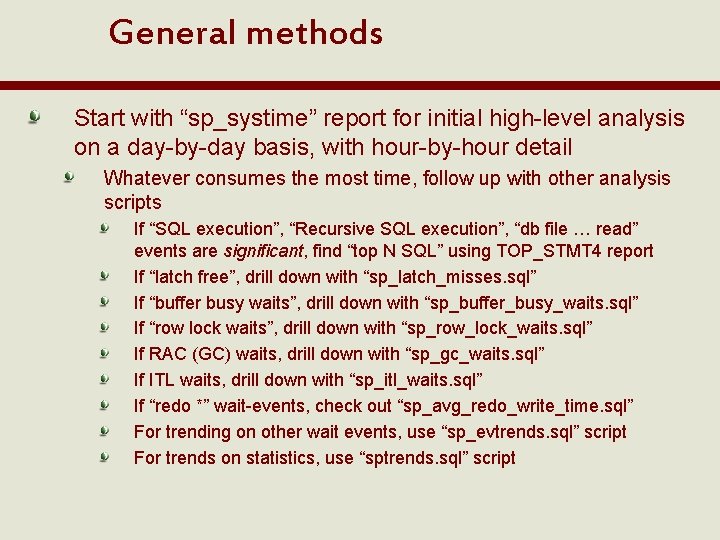
General methods Start with “sp_systime” report for initial high-level analysis on a day-by-day basis, with hour-by-hour detail Whatever consumes the most time, follow up with other analysis scripts If “SQL execution”, “Recursive SQL execution”, “db file … read” events are significant, find “top N SQL” using TOP_STMT 4 report If “latch free”, drill down with “sp_latch_misses. sql” If “buffer busy waits”, drill down with “sp_buffer_busy_waits. sql” If “row lock waits”, drill down with “sp_row_lock_waits. sql” If RAC (GC) waits, drill down with “sp_gc_waits. sql” If ITL waits, drill down with “sp_itl_waits. sql” If “redo *” wait-events, check out “sp_avg_redo_write_time. sql” For trending on other wait events, use “sp_evtrends. sql” script For trends on statistics, use “sptrends. sql” script

Northern CA Oracle Users Group Questions? Discussion? Please fill out the evaluation forms? Tim@Sage. Logix. com Website: http: //www. Sage. Logix. com/ Scripts and presentation can be downloaded from http: //www. Ev. DBT. com/papers. htm http: //www. Ev. DBT. com/tools. htm Else, email me… : -)