Week 8 Lecture 15 Diversity and Similarity Measures


 – vs. beta vs. gamma Shannon (Shannon-Weiner;")

 Simple and intuitive Definition – similarity")
 – n by p data matrix")


** Czekanowski**")

 – 1= 100% dissimilar – Influenced by big")
 – Sample size independent – n = number")
 – 0 = perfect similarity (no difference) Manhattan")


- Slides: 22
Week 8 Lecture 15 Diversity and Similarity Measures of distance and diversity for multivariate environmental (habitat) and (species) composition data Class Prep library (vegan) ponds. csv bufochem. csv Af_ungulate. csv HW Borcard CH 3 – 4. 7 Attacking Environmental and Species Composition Data Thought for Today: “Imagination is more important than knowledge. " – Albert Einstein, physicist (1879 -1955)
Objectives Explain what measures of biological diversity do and don’t do. Define what measures of distance are and explain how they can be used in data analysis Decide (and defend) on the best type of coefficient and data to use. Calculate various coefficients of diversity and distance.
Diversity What information does it convey? What it doesn’t tell us?
Review: what is diversity? How should we measure it? Mc. Cune and Grace 2002 Table 4. 1
Classic Diversity Indexes Diversity of Samples (alpha) – vs. beta vs. gamma Shannon (Shannon-Weiner; Shannon Weaver)
Classic Diversity Indexes Simpson’s Brillouins What diversity measures don’t do…
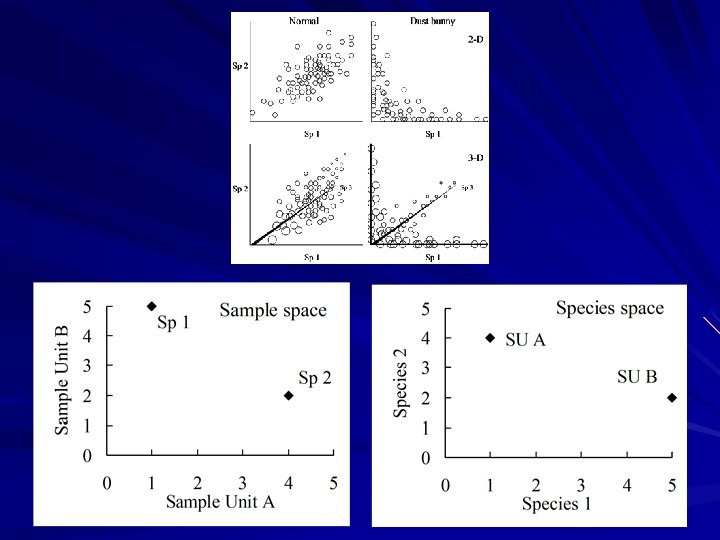
Measures of “Distance” Similarity ( or dissimilarity) Simple and intuitive Definition – similarity
Similarity Analysis—Data Types n entities by p (rows) – n by p data matrix – Binary – Integers Counts/Abundance Meristics – Continuous attributes (columns)
Similarity Analysis—Indexes Many coefficients Site Spp 1 Spp 2 Range 0 -1, ∞ Pond 1 23 0 Dissimilarity = 1 -Sim Beta Diversity Pond 2 5 32 Pond 3 20 0 Example
Similarity Coefficients: Terms j Site j Presence Absence Presence a b Absence c d Site i
Similarity Analysis—Binary Data Simple Matching Coefficient—P/A data Site Pond 1 Spp 1 1 Spp 2 0 Pond 2 Pond 3 1 1 1 0 Goes to 1 for lots of d
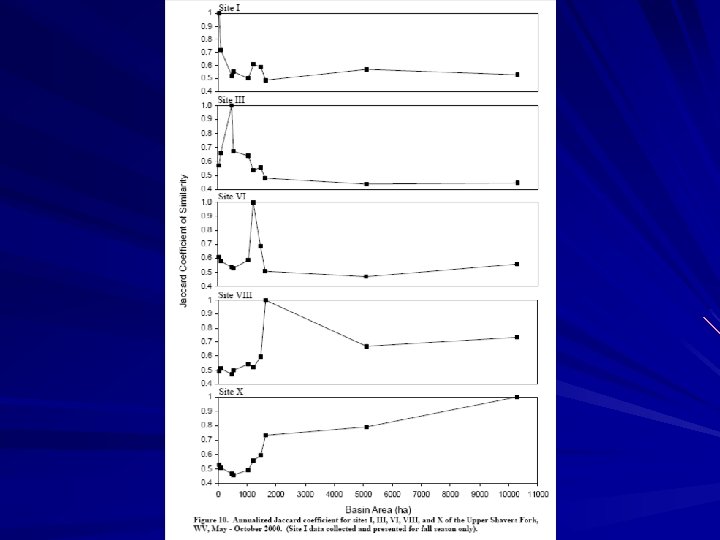
Similarity / Dist Analysis—Binary Data Russell and Rao Sokal and Sneath Jaccard (Sorensen)** Czekanowski** Ochiai (“O-key-i”) Product Moment Correlation Euclidean Distance (0 -∞) **some inconsistency in the literature
Similarity Analysis—Non-binary Data conventions n = # of species/attributes X 1 j X 2 j = jth value for the pair
Similarity Analysis—Continuous Data Bray-Curtis (0 -1) – 1= 100% dissimilar – Influenced by big values; but not conjoint absences
Similarity Analysis—Continuous Data Canberra (0 -1) – Sample size independent – n = number of non-zero entries (i. e. , number of species)
Similarity Analysis—Continuous Data Euclidian (0 -∞) – 0 = perfect similarity (no difference) Manhattan
Which Measure to Use? One that – makes sense – is defendable – is intuitive – uses binary (P/A) vs. Abundance data? Site Spp 1 Spp 2 Exp 1 1 1 Exp 1 23 54 Exp 2 1 0 Exp 2 12 0
Matrices in Symmetrical Diagonal elements Off-diagonal elements
Diversity and Similarity in R VEGAN is our friend – The ecology package – labdsv, plus some others ? vegan tutor Biodiversity. R: GUI for ecological analysis – http: //www. worldagroforestry. org/resources/databases/treediversity-analysis – Free book
REF AMD Heat