Week 3 Economics Topics of Week 3 1


\" – Watch for changes")


 – Bartering is a great")


, 1")
- Slides: 79
Week #3 Economics
Topics of Week #3 1. 2. 3. 4. 5. Markets Demand* Supply* Demand Supply Analysis* Graphs of Shifts* "*" Indicates the most important topics. Mateer and Coppock: Chapter #3
Markets • Firms – Supply goods and service • Consumers – Want to purchase goods supplied by firms. • Exchange happens – Through prices established in markets. – Supply or demand factors can change the market price.
Markets • Sellers and buyers come together to form a market. – Markets exist whenever goods and services are exchanged. – Doesn't have to be a physical place.
SNAPSHOT The Invisible Hand The trucker cares only about getting paid once the delivery is made. What's in the back of the rig is not important. 2. PROCESSED 1. CAUGHT The fishing boat captain trolls the waters to earn an income. She doesn't care what happens to the fish so long as she gets paid when the boat offloads at the dock. 3. SHIPPED
SNAPSHOT The Invisible Hand The consumers care about freshness and price. They don't care to know the name of the fishing captain or trucker that brought the fish to the store for them to enjoy. 4. DISPLAYED 6. EATEN 5. PURCHASED
Demand • Quantity demanded – The amount of a good purchased at a given price. • Law of demand – All other things equal, there is an inverse relationship between price and quantity demanded. – Inverse: two variables move in opposite directions.
Demand • Demand schedule – Table showing the relationship between price and quantity demanded. • Demand curve – Graph of the relationship between price and quantity demanded. • Market demand – Horizontal sum of all individual quantities demanded by each buyer in the market at each price.
Demand Higher price Lower price Meredith's Demand Schedule for Salmon Fillets Price of Salmon Fillets Salmon Demanded $20. 00 0 $17. 50 1 $15. 00 2 $12. 50 3 $10. 00 4 $ 7. 50 5 $ 5. 00 6 $ 2. 50 7 $ 0. 00 8 Lower quantity demanded Higher quantity demanded
Demand Curve
Market Demand Price of Salmon $20. 00 $17. 50 $15. 00 $12. 50 $10. 00 $ 7. 50 $ 5. 00 $ 2. 50 $ 0. 00 Meredith's Demand 0 1 2 3 4 5 6 7 8 + Derek's Demand 0 0 1 1 2 2 3 3 4 = Market Demand 0 1 3 4 6 7 9 10 12
Market Demand
Shifts in Demand • Movement along a demand curve – Caused by a change in the price of the good. – Inverse relationship between price and quantity demanded. • Shift in demand – Caused by changes in non-price factors. – Entire demand curve will shift to the left or right.
Shifts in Demand
Graphical Summary of Demand Movement vs. Shift • The next few slides give a summary of the possible movements and shift that we could see when considering demand.
Increase in Quantity Demanded P Caused by price decrease A $12 Move from point A to point B B $10 D 7 8 Q Movement along a demand curve Price↓ Qd↑
Decrease in Quantity Demanded P Caused by price increase B $50 Move from point A to point B A $30 4 6 D Movement along a demand curve Q Price↑ Qd↓
Increase in Demand Caused by non-price factors P Entire demand curve shifts to the right. D 1 D 2 Q Willing to buy more at ANY price
Decrease in Demand Caused by non-price factors P Entire demand curve shifts to the left. D 2 D 1 Q Willing to buy less at ANY price
Demand Shifters 1. Changes in income • Normal good – Good in which we buy more of when we get more income. – Direct relationship between income and demand • Inferior good – Good in which we buy less of when we get more income. – Inverse relationship between income and demand
Normal and Inferior Goods Normal Goods • • • Steak Housing Laptop TV Sit-down restaurant meals Name-brand clothing Inferior Goods • • • Canned meat Ramen Mac'n'cheese Store-brand goods Secondhand clothing
Demand Shifters 2. Price of related goods • Complements – Two goods used together. – Inverse relationship between the price of good X and demand for good Y • Substitutes – Goods that can be used in place of each other. – Direct relationship between the price of good X and demand for good Y
Substitutes and Complements in Consumption Complements • • • Biscuits and gravy Milk and cereal Printers and toner Peanut butter and jelly Whiskey and Coke Substitutes • • • Coke and Pepsi Snickers and Milky Way Butter and margarine Pizza Hut and Dominos Various items in the store with multiple brands
Demand Shifters 3. Changes in Tastes and Preferences • A good may become more fashionable or may come into season. – New style becomes popular – Demand increases (shifts right) as a result. • A good may go out of style or out of season. – Demand decreases (shifts left). – Lower demand for frozen pizza in summer • New information about a good – Can change tastes for better or worse.
Demand Shifters 4. Future expectations – Our consumption today may depend on what we think the price may be tomorrow. 5. Number of buyers – Recall the market demand curve – More individual buyers means more market demand. – Aging, immigration, war, and birth rates can affect the number of buyers for various goods.
Multiple Market Effects • Goods are often related – Substitutes and complements • This means that one economic event – Can affect multiple markets. • Consider an increase in the price of peanut butter – This will affect the demand for peanut butter and the demand for jelly, but in different ways!
Multiple Market Effects • Event: price of peanut butter increases. P $4 Peanut butter: Jelly: Movement along the demand curve A shift in demand P B A $3 D 2 4 Q D 2 D 1 Q
Practice What You Know Oreos P Event: A $3 The price of Oreos falls. B $2 D 4 5 Q
Practice What You Know Movie Tickets P B $20 The price of movie tickets increases. A $15 D 2 3 Event: Q
Practice What You Know Big Macs Event: P The price of a Burger King Whopper falls. D 2 D 1 Q
Practice What You Know P Steak Dinners Event: You get a promotion and pay raise at your job. D 1 D 2 Q
Practice What You Know P Sam's Club Soda D 2 Event: You get a promotion and pay raise at your job. D 1 Q
Practice What You Know Pizza Event: P The price of your favorite beverage falls. D 1 D 2 Q
Practice What You Know Old men's demand for oranges P Event: Doctors discover that oranges cure baldness. D 1 D 2 Q
Practice What You Know • The following three questions are considering the market for the same good. • The good in question is PEPSI. • We are considering: – Change in quantity demanded (movement), and – Change in demand (shift).
Practice What You Know • Assume you like Pepsi, and your income increases. A. B. C. D. The demand for Pepsi increases. The demand for Pepsi decreases. The quantity demanded for Pepsi increases. The quantity demanded for Pepsi decreases.
Practice What You Know • Assume the price of Pepsi decreases. A. B. C. D. The demand for Pepsi increases. The demand for Pepsi decreases. The quantity demanded for Pepsi increases. The quantity demanded for Pepsi decreases.
Practice What You Know • Assume the price of Coke decreases. A. B. C. D. The demand for Pepsi increases. The demand for Pepsi decreases. The quantity demanded for Pepsi increases. The quantity demanded for Pepsi decreases.
Summary of Demand Shifters
Class Activity: Think-Pair-Share • You work at a restaurant/bar. – Your boss comes to you, knowing you are studying economics, and asks for your opinion on the following question: • Which of the following would increase the demand for drinks the most? A. Reduction in the price of a complementary good such as an appetizer. B. Reduction in the price of drinks. C. Both would. • Think carefully about your answer for a minute. Pair up with a classmate and share your thoughts.
Economics in The Hudsucker Proxy • "The Hudsucker Proxy (1994)" – Watch for changes in price. – Which price changes are an illustration of a movement along a demand curve, and which are the result of demand increase?
Supply • Quantity supplied – The amount of the good or service that producers are willing and able to sell at the current price. • Law of supply – All other things equal, there is a direct relationship between price and quantity supplied. – Direct: two variables move in the same direction.
Supply • Supply schedule – Table showing the relationship between price and quantity supplied. • Supply curve – Graph of the relationship between price and quantity supplied. • Market supply – Horizontal sum of all individual quantities supplied by each seller in the market at each price.
Supply Higher price Lower price Pure Food Fish's Supply Schedule Price of Salmon Fillets Salmon Supplied $20. 00 800 $17. 50 700 $15. 00 600 $12. 50 500 $10. 00 400 $ 7. 50 300 $ 5. 00 200 $ 2. 50 100 $ 0. 00 0 Higher quantity supplied Lower quantity supplied
Market Supply Price of Salmon Pure Food Fish's Supply $20. 00 $17. 50 $15. 00 $12. 50 $10. 00 $ 7. 50 $ 5. 00 $ 2. 50 $ 0. 00 800 700 600 500 400 300 200 100 0 + City Fish's Supply 200 175 150 125 100 75 50 25 0 Market Supply = 1000 875 750 625 500 375 250 125 0
Supply Curve
Shifts in Supply • Movement along a supply curve – Caused by a change in the price of the good. – Direct relationship between price and quantity supplied. • Shift in supply – Caused by non-price factors. – Entire supply curve will shift to the left or right.
Market Supply
Supply Shifters 1. The cost of inputs • Inputs – Resources used in the production process – Inverse relationship between input costs and supply curve 2. Changes in technology • Technology – Knowledge that producers have about how to produce a product – Direct relationship between level of technology and supply
Supply Shifters 3. Taxes and subsidies • Tax – Tax paid by producer added cost of production – Inverse relationship between taxes and supply • Subsidy – "Opposite" of a tax; government pays sellers to produce goods. – Direct relationship between subsidies and supply
Supply Shifters 4. Number of sellers – Recall the market supply curve – More individual sellers means more market supply. 5. Price expectations – Higher price expected tomorrow? If so, delay sales until future, if possible. – Inverse relationship between tomorrow's expected price and today's supply
Summary of Supply Shifters
Practice What You Know • Assume the price of cheese decreases. What will happen in the pizza market? A. B. C. D. The supply of pizza increases. The supply of pizza decreases. The quantity supplied of pizza increases. The quantity supplied of pizza decreases.
Practice What You Know • Which of the following will cause the supply curve for oranges to shift to the left? A. The government begins subsidizing orange growers. B. A study showing oranges improve eyesight. C. Ice storm strikes Florida. D. A new orange juice commercial airs on TV.
Bringing Supply and Demand Together • How is the price of a good determined? – The market forces of supply AND demand work simultaneously to determine the price. • The law of supply and demand – The price of any good will adjust to bring the quantity supplied and quantity demanded into balance.
Supply and Demand • Equilibrium point – Graphically, the intersection of supply and demand • Equilibrium price – The price that causes quantity supplied to equal quantity demanded. – The price that "clears the market" • Equilibrium quantity – The numerical quantity (supplied and demanded) at the equilibrium price
Graphs of Shifts Change Illustration Impact on Price and Quantity Demand increases The demand curve shifts to the right. As a result, the equilibrium price and equilibrium quantity increase. Supply increases The supply curve shifts to the right. As a result, the equilibrium price declines and the equilibrium quantity increases.
Graphs of Shifts Change Illustration Impact on Price and Quantity Demand decreases The demand curve shifts to the left. As a result, the equilibrium price and equilibrium quantity decrease. Supply decreases The supply curve shifts to the left. As a result, the equilibrium price increases and the equilibrium quantity decreases.
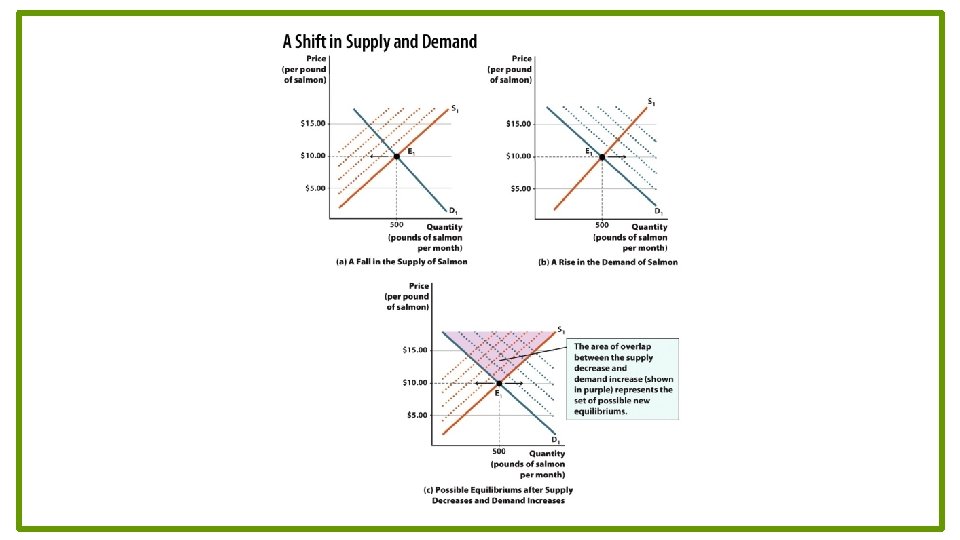
Shifts in Supply and Demand: Example • By itself, decrease in supply leads to – Higher equilibrium price. – Lower equilibrium quantity. • By itself, increase in demand leads to – Higher equilibrium price. – Higher equilibrium quantity. • Combined effects? – Higher equilibrium price – Equilibrium quantity?
Shifts in Supply and Demand • The world is complex and shifts don't always occur in a simple, one-at-a-time manner. • What happens if there is a shift in supply AND a shift in demand?
Shifts in Supply and Demand: Example • Consider the market for salmon, and suppose two things happen simultaneously: 1. A major drought hits the northwest United States 2. A medical journal reports that people who consume salmon live longer than people who eat other fish • These two events will respectively lead to: 1. 2. A decrease in the supply of salmon. An increase in the demand for salmon.
Graphs of Shifts Change Demand supply both increase Demand supply both decrease Illustration Impact on price and quantity The demand supply curves shift to the right. The shifts reinforce each other with respect to quantity, but act as countervailing forces along the price axis. The demand supply curves shift to the left. The shifts reinforce each other with respect to quantity, but act as countervailing forces along the price axis.
Graphs of Shifts Change Demand increases and supply decreases Demand decreases and supply increases Illustration Impact on price and quantity The demand curve shifts to the right and the supply curve shifts to the left. The shifts reinforce each other with respect to price, but act as countervailing forces along the quantity axis. The demand curve shifts to the left and the supply curve shifts to the right. The shifts reinforce each other with respect to price, but act as countervailing forces along the quantity axis.
Shorthand Summary of Shifts • • D→ : P↑Q↑ D← : P↓Q↓ S→ : P↓Q↑ S← : P↑Q↓ → Indicates right shift. ← Indicates left shift. • • D→ & S→ : P(↑↓ or ↔)Q↑ D← & S← : P(↑↓ or ↔)Q↓ D→ & S← : P↑Q(↑↓ or ↔) D← & S→ : P↓Q(↑↓ or ↔) Notation: ↔ means "stays the same"
Shift Summary • Don't memorize the previous slide! • A better idea: 1. Figure out what shift(s) will occur as a result of some economic event. 2. Draw the correct shift(s). 3. Examine what you just graphed.
Economics in Willy Wonka & The Chocolate Factory • "Willy Wonka & The Chocolate Factory" – What sort of market effect is happening here? – Why is the price of candy bars increasing?
Shortages and Surpluses • Shortage – QD > Q S – Occurs at any price below equilibrium. – Price will rise over time toward equilibrium if the market is not regulated! • Why does price rise over time with a shortage? – Consumers who value the product will "outbid" other consumers or otherwise show a higher willingness to pay. – Suppliers will see that the price can be raised without a decrease in sales.
Shortages and Surpluses • Surplus – QS > Q D – Occurs at any price above equilibrium. – Price will fall over time toward equilibrium if the market is not regulated! • Why does price fall over time with a surplus? – Firms will have to eventually get rid of mounting inventories of goods. – To do this, they must lower their prices.
Shortages and Surpluses
Economics in Pawn Stars • "Pawn Stars" (History Channel) – Bartering is a great way to see the forces of supply and demand at work.
Conclusion • If you take away just one thing from this course, it will probably be "supply and demand. " • In competitive markets, supply and demand allow prices to adjust toward equilibrium. • In equilibrium, the markets clears. This means there are no surpluses or shortages.
Summary • Supply and demand play a key role in determining prices in the market economy. Prices established through this process help allocate resources. • A market consists of a group of buyers and sellers for a particular product or service. • The demand curve is downward-sloping. • The supply curve is upward-sloping.
Summary • A change in the price of a good will cause – A movement along the demand curve. – A movement along the supply curve. • Changes other than price – Cause a shift in demand. – Cause a shift in supply. • Supply and demand interact through the process of market coordination. • The equilibrium is the balancing point between the two opposing forces. The market clearing price and output are determined at the equilibrium point. • Shortages and surpluses are resolved in competitive markets.
Practice What You Know Suppose the price of good X increases. In terms of demand, what is the result? A. B. C. D. The demand for X increases. The demand for X decreases. The quantity demanded of X increases. The quantity demanded of X decreases.
Practice What You Know Suppose goods X and Y are substitutes for each other. If the price of good Y increases, what is the result in the market for good X? A. B. C. D. The demand for X increases. The demand for X decreases. The quantity demanded of X increases. The quantity demanded of X decreases.
Practice What You Know Suppose there is a shortage in the market for avocados. Assuming a competitive and unrestrained market, what happens over time? A. The price of avocados will fall, and the shortage will worsen. B. The price of avocados will rise, and the market will eventually reach equilibrium. C. The price of avocados will rise, and a large surplus will be created. D. Producers will stop growing avocados.
Practice What You Know Consider the market for bananas. Suppose that both the supply and demand for bananas increases simultaneously. Which of these effects is certain? A. B. C. D. The equilibrium price of bananas will increase. The equilibrium price of bananas will decrease. The equilibrium quantity of bananas will increase. The equilibrium quantity of bananas will decrease.
Sources • "Principles of Economics with Smartwork Access (ISBN: 978 -0 -26314 -5), 1 st Edition, 2013" by Mateer and Coppock • "Economics: Custom Edition for NCSU (ISBN: 9781937435202" by David Hyman