Week 9 Economics Topics of Week 9 1


.")
 Rank 2) Country 3) 2013 GDP (billions of U S")


 Super-Normal Expansion (Temporary) u = u*")
 • Potential real GDP is the \"benchmark\" against")


 – A measure of the price")


, 1")
- Slides: 60
Week #9 Economics
Topics of Week #9 1. 2. 3. 4. 5. 6. 7. 8. 9. Uses of GDP Data Business Cycle* Unemployment Types of Unemployment* Full Employment Output (Potential Real GDP)* Consumer Price Index Comparing Dollar Values Across Time* Inflation* Cost of Inflation* "*" Indicates the most important topics. Mateer and Coppock: Chapter #19, #20 and #21
Three Uses of GDP Data • Why is GDP useful to examine? 1. Estimate living standards across time and nations. 2. Measure economic growth. 3. Determine whether an economy is experiencing a short-run expansion or recession.
Measuring Living Standards • Total GDP: – Not as accurate for cross-country comparisons – Does not adjust for population size of country
Measuring Living Standards • Per capita GDP – GDP person (GDP divided by population). – Average living standards in a nation. – Remember to use Real GDP instead of Nominal GDP.
Measuring Living Standards 1) Rank 2) Country 3) 2013 GDP (billions of U S dollars) 4) Per capita GDP (U S dollars) 1 United states 16, 768 dollars 53, 042 dollars 2 China 9, 240 dollars 6, 807 dollars 3 Japan 4, 920 dollars 38, 634 dollars 4 Germany 3, 730 dollars 46, 269 dollars 5 France 2, 806 dollars 42, 503 dollars 6 United Kingdom 2, 678 dollars 41, 787 dollars 7 Brazil 2, 246 dollars 11, 208 dollars 8 Italy 2, 149 dollars 35, 926 dollars 9 Russia 2, 097 dollars 18, 783 dollars 10 India 1, 877 dollars 1, 499 dollars 11 Canada 1, 827 dollars 51, 958 dollars
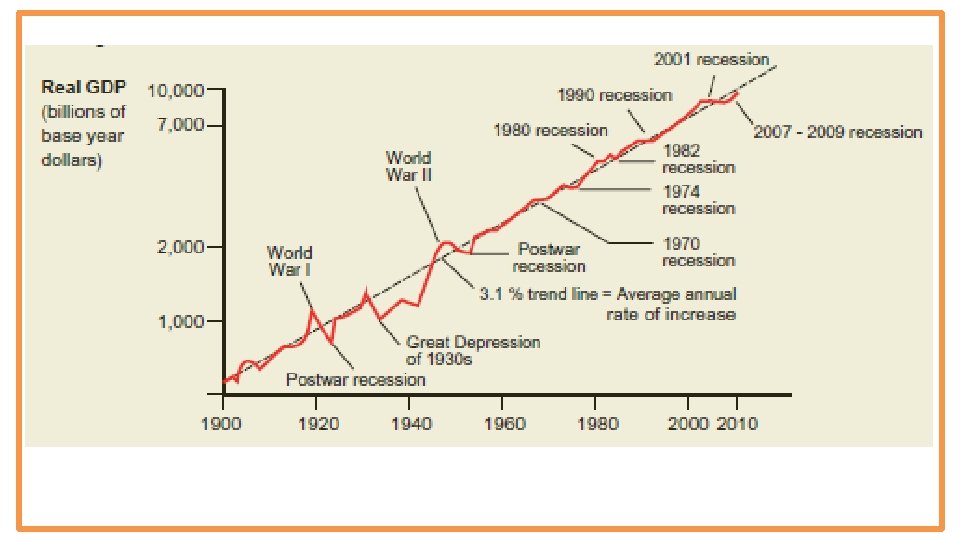
Measuring Economic Growth U. S. Per Capita Real GDP
Per Capita Real GDP in Six Nations
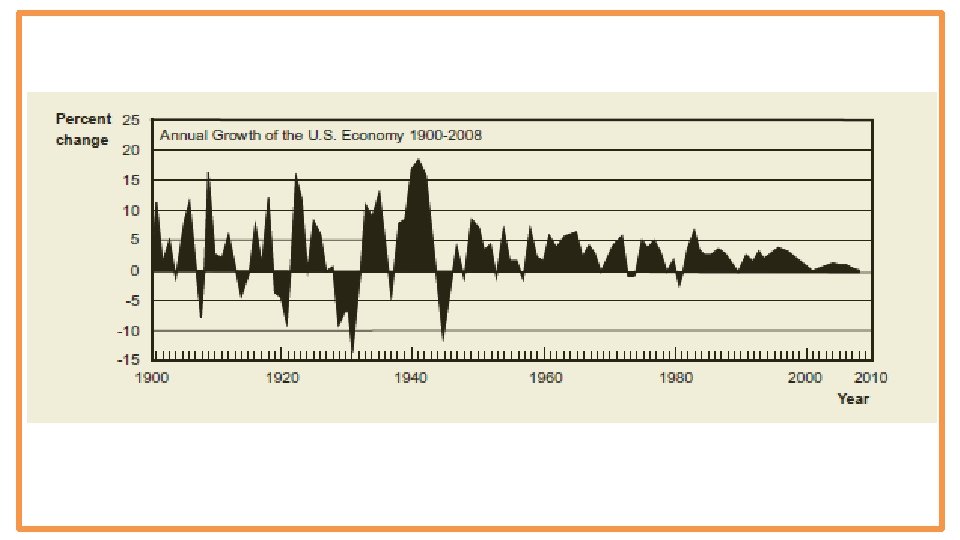
Measuring Business Cycles • Business Cycle – Short-run fluctuations in economic activity that can cause output to be above or below the longrun trend. • Parts of a business cycle – Expansion – Contraction – Peak – Trough
The Business Cycle
The Business Cycle – Peak: is the highest level of real GDP in the cycle. Each peak indicates an economy operating at close to full capacity. Likely to have a shortage of labor and materials; low unemployment. – Contraction or Recession: is a period of declining or abnormally low real GDP (when real GDP declines for two consecutive three-month reporting periods). Income, business profits, business demand for investment goods decline in recessions. – Trough: is the lowest level of real GDP observed over the business cycle. High unemployment, low demand for goods. – Recovery: is used to describe an expansion in economic activity after a trough if the expansion follows a period of contraction severe enough to be classified as a recession. Income, business profits, business demand for investment goods increase in recovery.
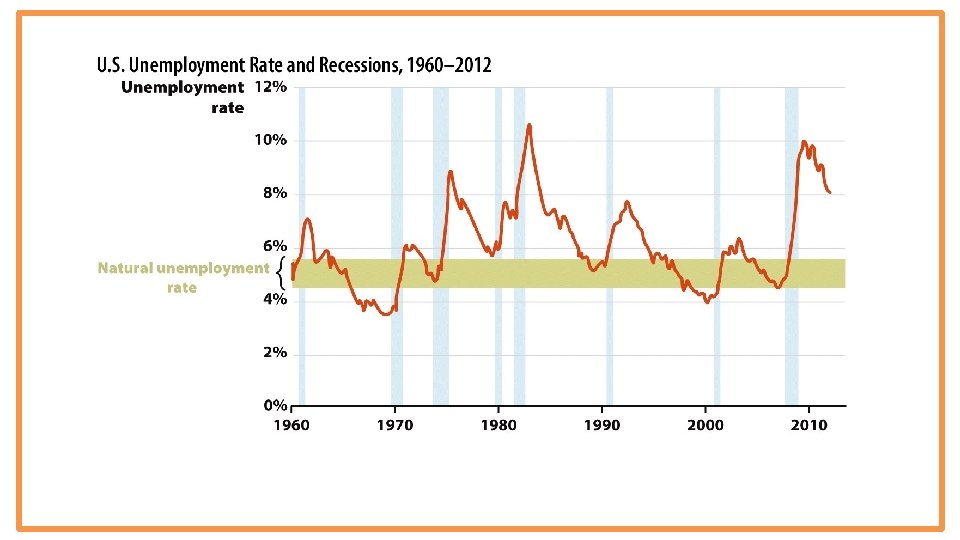
U. S. Real GDP and Recessions, 1960— 2012
Unemployment • Why so much unemployment after recession? • Certain industries hit hard – Housing • Adjustment lags – Corrections take time, not instant • Government policy – Unintended consequences lengthened unemployment • How unemployment is measured? – If you’re not looking for a job, you’re not counted as unemployed. If you start looking again, you’re unemployed.
U. S. Unemployment Rate 1960– 2012
Looking at the Data • Labor force – People who are employed or actively seeking work. • Who is not in the labor force? – Jobless people not actively seeking employment (no efforts made in four weeks) – Retirees – Students – Institutionalized Unemployment Rate =
Measuring Unemployment in the United States, April 2012 Relevant Population: 243 million - Noninstitutionalized - Civilian - Aged 16+ Not in Labor Force: 89 million - Students - Homemakers -Retirees - Others Labor Force: 154 million Employed: 142 million 91. 9% of labor force Unemployed: 12 million 8. 1% of labor force
Three Types of Unemployment • Is it practical to have zero unemployment? – Generally, unemployment is a drain on society and very difficult for certain individual households. – However, as our economy changes and progresses, certain jobs are destroyed. – We can never eliminate unemployment entirely. • Three types of unemployment – Structural – Frictional – Cyclical
Structural Unemployment • Structural unemployment – Unemployment caused by changes in the industrial makeup (structure) of the economy. – Joseph Schumpeter: "creative destruction. " – New industries are created, and old ones are destroyed. • Examples: – Borders (bookstore) bankrupt in 2011. Job losses in the book industry. Why? – U. S. steel industry: • 1980: 500, 000 laborers • 2010: 150, 000 laborers • More automated equipment, safer and more efficient.
Structural Unemployment • Changes in American economy over time – – Agricultural (working in fields) Manufacturing (working in factories) Service (working in offices, online) Today: United States = "service economy"
Growing and Changing Economies
Frictional Unemployment • Frictional unemployment – Unemployment caused by time delays in matching available jobs and workers. – People don’t instantly take a new job, and they might not want to take the first available job. – Firms don’t always hire the first applicant. • Example: – Recent college grads – Spouse of a person who moves for a new job
Cyclical Unemployment • Cyclical Unemployment – – Caused by economic downturns. The "worst" kind of unemployment. Occurs for an unknown length of time. 2008: 18 months, 10% unemployed. • Natural Rate of Unemployment (u*) – Typical rate of unemployment in a healthy economy. – Actual rate of unemployment denoted by (u). • Full Employment Output (Y*) – Output by an economy with no cyclical unemployment. • In some books, Full Employment Output = Potential Real GDP = Natural Rate of Output. – Actual Output denoted by (Y).
Three Types of Unemployment Actual Unemployment Rate during Recession Cyclical Bad! Actual Unemployment Rate during Normal Macroeconomic Conditions Structural Frictional Always occurring, denoted as u* Structural Frictional Natural Unemployment Natural unemployment is currently estimated to be around 6%.
Economics in Bronze Age Orientation • "Bronze Age Orientation" – This clip illustrates two, Mitchell and Webb, cavemen facing possible structural unemployment during the movement from the Stone Age to the Bronze Age
Natural Rate of Unemployment and Output Recession (Temporary) Super-Normal Expansion (Temporary) u = u* u > u* u < u* Y = Y* Y < Y* Y > Y* Cyclical unemployment is zero Cyclical unemployment is positive Cyclical unemployment is negative Healthy Economy (Long Run) Long Run
Full Employment Output (Potential Real GDP) • Potential real GDP is the "benchmark" against which actual performance of the economy is measured. • When the economy operates below potential real GDP there will be cyclical unemployment. • Sometimes the economy operates at levels of production that exceed potential real GDP as the economy "overheats". When the economy is overheated upward pressures on wages and prices occur and real GDP falls. • Potential Real GDP grows over time with growth in resources, and improvement in resource quality and in technology. Without additional changes, the economy cannot sustain an output greater than Potential Real GDP in the long run.
The Business Cycle If the actual real GDP is above the Long-run trend of GDP (you can consider it as Full Employment Output-Potential Real GDP trend) cyclical unemployment is negative and natural unemployment is higher than actual unemployment. On the Long-run trend of GDP (you can consider it as Full Employment Output. Potential Real GDP trend) cyclical unemployment is zero and natural unemployment is equal to actual unemployment. If the actual real GDP is below the Long-run trend of GDP (you can consider it as Full Employment Output-Potential Real GDP trend) cyclical unemployment is positive and natural unemployment is less than actual unemployment.
Economics in Geography of Jobs • "Geography of Jobs" – An interactive map which shows unemployment rates changing across America during the Great Recession which began in December 2007
Shortcomings of the Unemployment Rate • Unemployment timeline – Unemployment rate lags behind economic activity. – Recovery happens, people re-enter the labor force, and the unemployment rate can actually increase! • Who is unemployed? – Do not know who is unemployed. – Do not know how long they have been out of work. – Short-run unemployment may not be a big concern, but long-term unemployment is a big concern.
Summary • Frictional and structural unemployment explain why unemployment is naturally greater than zero. • Cyclical unemployment explains changes in the rate across the business cycle. • The unemployment rate is the percentage of the labor force that would like to work who are unemployed.
Practice What You Know Which of the following is an example of structural unemployment? A. Alfred the VCR repairman is unemployed because there are very few people that still own VCRs. B. Bernie the construction worker is unemployed because no one is building houses right now. C. Carl the restaurant chef is unemployed because he and his wife recently moved to a new city.
Practice What You Know Which of the following is an example of frictional unemployment? A. Alfred the VCR repairman is unemployed because there are very few people that still own VCRs. B. Bernie the construction worker is unemployed because no one is building houses right now. C. Carl the restaurant chef is unemployed because he and his wife recently moved to a new city.
Practice What You Know Who is considered unemployed? A. Jean, a college student who is currently not working. B. Zoe, a recent college graduate who sent out job application, but has yet to hear back from the businesses. C. Michael, a stay-at-home dad. D. All of the above.
Consumer Price Index • Consumer Price Index (CPI) – A measure of the price level based on the consumption pattern of a typical consumer. – Goal: include everything purchased by a typical consumer to get a measure of the cost of living. • Bureau of Labor statistics – The government agency that reports inflation and unemployment data. – Determines how much "weight" to put on certain consumer prices.
What Prices Are Included in the CPI?
Calculating a Simple Price Index 2013 Good Popcorn Limeade Movie ticket Consumer Price Index (CPI) Which year is the base year here? 2014 Quantity Price Cost 2 2 1 $4 $4 $8 $8 $6 $4 $10 $12 $8 $10 $24 $30
Calculating a Simple Price Index • Finding the price index OR • The CPI is computed monthly and since 1988 an average of prices for the period 1982 -1984 has been used as the base. • Ex: CPI as of August 2013 is 233. 9, which means that prices for the CPI market basket in 2013 were 133. 9% higher than they were in 1983.
Inflation • Inflation – Continuing rise in the general price level. – Measured as a growth rate (percentage change) in the average level of prices. For example, %4 for 2010. – Deflation: opposite of inflation. . . price level falls. For example, %-4 for 2008. – Disinflation: price level increases but with a decreasing rate. For example, %6 for 1950, %4 for 1951 and %3 for 1952. • Biggest problem of inflation? – Uncertainty about price changes creates problems for firms and workers. – Long-term wages difficult to agree upon. – Consumers may change buying patterns due to uncertainty.
Inflation • Having found the price levels, we can find inflation by using a percentage change formula – Inflation rates are measured over the course of a year – The general formula is • In the previous example (slide 37), inflation is 25%
Prices Don’t All Move Together • Clearly, most prices rise over time. – Travel – Education – Health care • However, some prices fall over time. – Consumer electronics – Usually due to a result of great technological advancements – Flat panel TV, 1997: $7, 000 – Flat panel TV 2012: $500
Inflation in the United States
CPI and Inflation over the Long Run
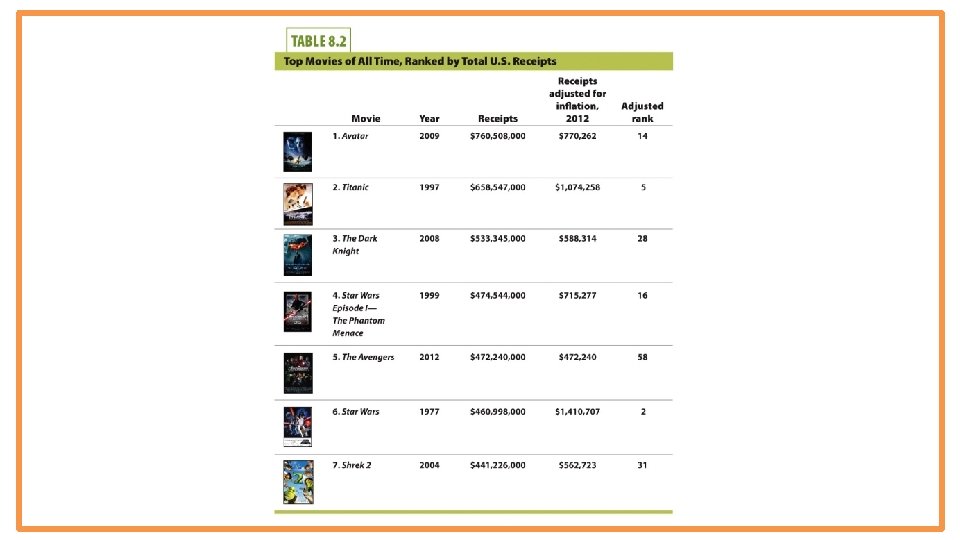
Using the CPI to Compare Dollar Values across Time • Prices from different time periods can be confusing. – In 1921, you could buy a fully constructed house for $2000. – To compare, we can transform this into a "price in today’s dollars" (In the analysis we will use 2012 as today). – The house with the value of $2000 in 1921 is $25555. 55 today.
CPI 2012: 230 CPI 1942: 16 CPI 1921: 18 CPI 1955: 27 CPI 1922: 17
Economics in CPI Inflation Calculator • "CPI Inflation Calculator"
The Costs of Inflation 1. Future price level uncertainty – Firms often make long-term agreements that involve paying salaries to workers and paying loans on capital goods. – Uncertain inflation makes long-term contracts riskier. – Workers: fear of getting underpaid next year. – Lenders: fear of lending out money today and getting paid back in less-valuable dollars next year. – If long-term contracts don’t transpire, GDP growth is slowed.
The Costs of Inflation • Uncertainty about future price levels – Wage and other input contracts often have a long-term commitment. Firms may have to borrow today and pay back the money later. – Uncertainty about prices may make lending riskier. Prepare to Produce Borrow $$ Build Capital Goods Hire Workers Today Produce The real value of these future dollars depends on inflation. Sell Output Repay Loans $$ Pay Workers $$ Future Periods Time
The Costs of Inflation 2. Money Illusion – People interpreting nominal wage or price changes as real changes. – If prices and wages all go up by 2%, there is no real change in your purchasing power. People with money illusion think they are richer in this case. • Nominal wage – The wage in current dollars, analogous to nominal GDP • Real wage – Nominal wage adjusted for inflation (changes in the price level) • Another money illusion example: – If nominal wages go up by 3%, but prices go up by 5%, money illusion may cause you to think of yourself as wealthier, but your real wages have actually decreased!
The Costs of Inflation 3. Wealth redistribution – Wealth can be redistributed between borrowers and lenders. Real Interest Rate = Nominal Interest Rate – Inflation Rate • Example: – You borrow $50, 000, and expect to pay back $60, 000 in five years. • If unexpected inflation occurs – You are better off, bank is worse off. • If the inflation was expected – The bank would have required more in return for the loan (you’d have to repay $75, 000 in five years for example).
The Costs of Inflation These 3 are enough to know for this class.
Summary • The CPI is the primary measure of the general price level in the United States. – Computed using prices from a basket of goods formed by the spending habits of the typical consumer. • Measuring inflation is straightforward once the CPI is calculated. The inflation rate is the growth rate of the CPI, expressed in percentage terms. • The CPI is also useful for equating monetary values (or prices) over time. • There are several macroeconomic costs from inflation, including future price level uncertainty and money illusion.
Practice What You Know If inflation is a general rise in the price level, why have consumer electronic prices fell over time? A. The demand for electronics has decreased. B. Electronics are not counted in the CPI. C. Electronics are getting smaller in size so the price is falling as well. D. Increases in technology have greatly reduced production costs for these goods.
Practice What You Know Suppose that prices and wages both double next year. What is true about next year compared to this year? A. Nominal wages are higher and real wages remained constant. B. Nominal wages and real wages are both higher. C. Nominal wages are higher and real wages are lower. D. Nominal wages decreased and real wages increased.
Practice What You Know In 2012, John takes out a 30 -year bank mortgage loan at a fixed interest rate. He buys a house with the loan. In 2014 to 2018, there is a large amount of inflation. Who is hurt and helped by this inflation, ceteris paribus? A. John is helped and the bank is hurt. B. The bank is helped and John is hurt. C. John and the bank are both hurt. D. John and the bank are both helped.
Practice What You Know Suppose that Felix gets a 1% raise this year, but prices have also risen by 1%. Felix feels richer due to his raise and attempts to change his spending habits. Felix is suffering from A. B. C. D. irrational exuberance. macroeconomics. money illusion. inflation pricing.
Sources • "Principles of Economics with Smartwork Access (ISBN: 978 -0 -26314 -5), 1 st Edition, 2013" by Mateer and Coppock • "Economics: Custom Edition for NCSU (ISBN: 9781937435202" by David Hyman