Water Supply Reallocation Workshop Determining Yield and Space


- Slides: 36
Water Supply Reallocation Workshop Determining Yield and Space Requirement
Corp Guidelines • EM 1110 -2 -1420 “Hydrologic Engineering Requirements for Reservoirs” • EM 1110 -2 -1417 “Flood Runoff Analysis” • EM 1110 -2 -1701 “Engineering and Design Hydropower”
Terms • Yield – also know as firm yield and critical yield is the maximum sustainable flow at some point in time during the most adverse sequence of streamflow (critical period). • Storage – water impounded in surface or underground reservoirs for future use.
Storage-Yield Relationship • Two ways to view – The storage required at a given site to supply a given yield (planning) – Determine the yield from a given amount of storage (final design)
Purpose • Storage requirements for – Water supply – Water quality – Hydroelectric power – Navigation – Irrigation – Other conservation purpose
Yield Objectives • Determine yield given a storage allocation • Find storage required given a desired yield • Determination of complementary or competitive aspects of multi project development • Analysis of alternative operation rules for a project or group of projects
Procedures • Simplified – Mass Curve – Depth duration • Detailed sequential analysis – Simulation analysis – Mathematical programming (optimization)
Selection • Simplified – Constant demand, preliminary or screening studies • Sequential – Feasibility and design phases • Other factors – Available data, study objectives and budget
Simplified • Sequential Mass Curve – Constructed by accumulating inflows to a reservoir site throughout the period of record & plotting the accumulated inflows versus the sequential time period • Depth Duration – Relationship of storage yield vs shortage frequency
Sequential Mass Curve • Manual graphical procedure used to identify the critical period and firm yield • Firm yield is maximized by fully drafting available storage to supplement natural streamflow • Mass curve is cumulative plotting of reservoir inflow • The slope of the mass curve at any point in time represents the inflow at that time.
Sequential Mass Curve
Mass Curve & Constant Yield Lines
Yield given Storage
Simplified Limitations • Does not reflect seasonal variations in demand • Inability to accurately evaluate evaporation losses
Detailed Sequential Analysis • Conservation of mass I–O= S I = inflow, O= outflow, S=change in storage • Computer Simulation (HEC-5, Res. Sim) – Multipurpose reservoir – Varying demand – Evaporation evaluation – Firm yield optimization
Maximize Firm Yield
Firm Yield Curve
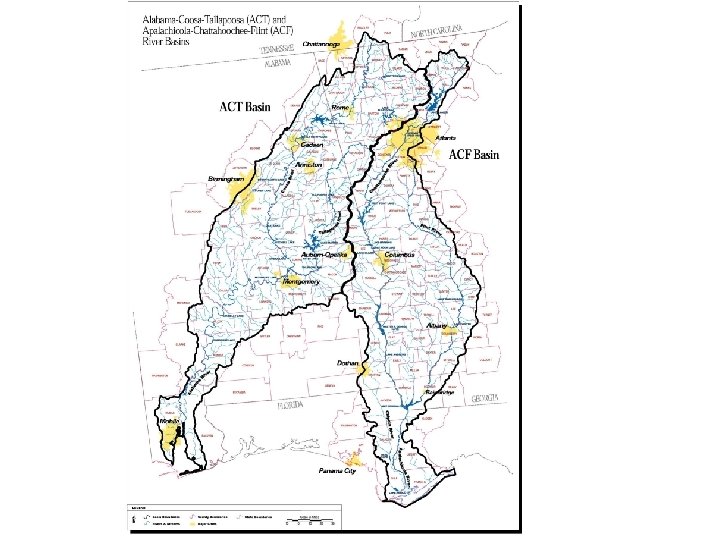
Case Study #1 • ACF Water Allocation Formula – Lake Lanier has 65% of basin storage – Water supply demand increase from 1, 415 cfs to 1, 842 cfs by year 2030 ( 30% increase).
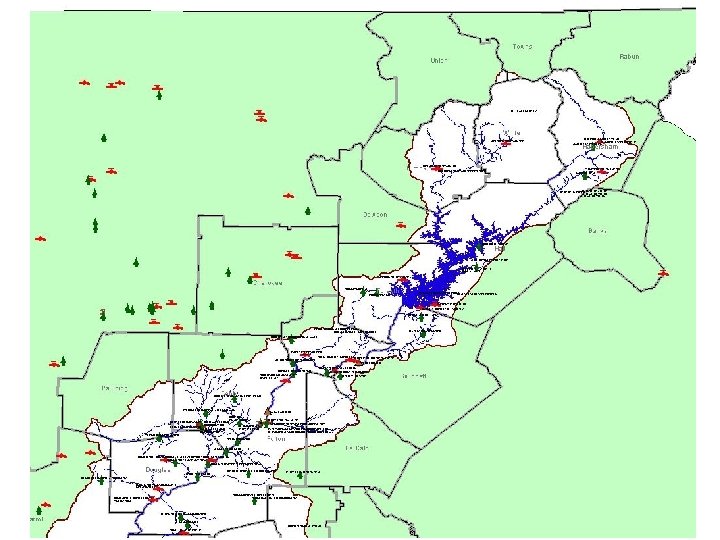
Chattahoochee River Atlanta Gage Lake Lanier
Chattahoochee Demands Year Lake Lanier Withdrawal Chattahoochee River Withdrawal Water Quality Needs 1999 120 186 297 460 310 480 408 632 485 750 2030 Total 915 MGD 1, 416 cfs 1190 MGD 1, 842 cfs
Objective • Determine if enough storage exist to meet future demands – Demands • Water supply (lake and river withdrawal) • Water quality
4 yrs, 8 months
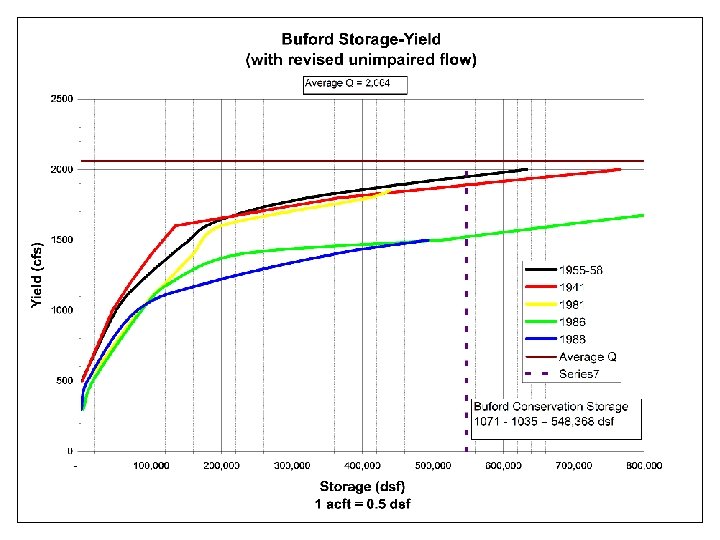
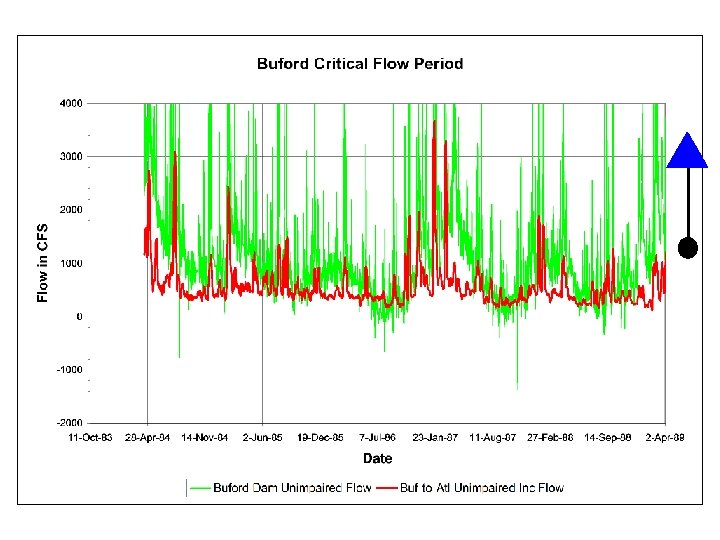
Buford Dam Critical Yield • • Graphical Method Unimpaired Flow 1939 -1993 Critical Period 1980’s Buford Conservation Storage 549, 000 dsf (1071 -1035) • Critical Yield = 1, 524 cfs (w/o evap)
GA ACF Proposal • Upper 2030 Chattahoochee Withdrawals – Lake Lanier withdrawal 460 (297 mgd) – Chat River withdrawal 632 (408 mgd) – Water Quality needs 800 (548 mgd) Total 1, 892 Evaporation ? (100 -200 cfs) Preliminary analysis; shortage of 368 cfs
Chattahoochee River at Atlanta Safe Yield Model File: ATLY • Prime flow (local inflow + Lanier release) = 1, 985 cfs • No other operational targets except 10, 000 cfs limiting flood release • Conservation pool limits = 1035. 0, 1071. 0 • Seasonal drawdown to 1070. 0 • Demand equals 1, 892 cfs (no shortages)
Buford Yield Buford TOC 1070 - 1071 Yield = 1, 465 cfs with evaporation
Buf-to-Atl Base Flow Estimate Location Sope Ck Suwanee Ck Big Ck DA 1986 AADF CFSM (mile 2) (cfs) 29. 2 21. 8 0. 75 46. 8 31. 7 0. 68 72 45. 5 0. 63 Ave = 0. 69 Buford to Atlanta DA = 410 miles 2 Dependable Buf-Atl Local Flow 410 x 0. 69 = 280 cfs
Potential Shortage Year Demands 2010 1600 Yield + 200 Potential Shortage 1665 2020 1753 1665 88 2030 1842 1665 177 Assume Buf – Atl base flow of 200 cfs Analysis presented to states but ignored
Buford Dam Critical Yield • What if Storage Increased? • Raise T. O. C. to 1080 • Buford Conservation Storage 735, 000 dsf (1080 -1035) • Critical Yield = 1, 638 cfs (w/o evap) • 34% increase in storage, 7% increase in yield
Case Study #2 • ACT Allocation Formula • Reallocation to meet 2030 demands • Model run using critical period – Existing Conditions (2001 demands) – Future Conditions (2030 demands) • Measure the additional storage to meet increase demand • Economic analysis
Allatoona Required Storage 64, 160 ac-ft
Yield Objectives • Determine yield given a storage allocation • Find storage required given a desired yield • Determination of complementary or competitive aspects of multi project development • Analysis of alternative operation rules for a project or group of projects