Warm Season Forecasting with GFE along the Florida


 and original radar based graphic (bottom)")
 and original radar")


- Slides: 31
Warm Season Forecasting with GFE along the Florida Panhandle Coastline - Bryan Mroczka WFO Tallahassee, FL
Outline 1. What exactly is GFE ? 2. Florida Panhandle forecast challenge in the warm season 3. Florida Panhandle sea-breeze convection research 4. Tallahassee GFE Sea-Breeze Convection tool 5. Future research
GRAPHICAL FORECAST EDITOR - GFE ? Software package used at WFOs to produce graphical forecasts “grids” of weather elements including T, Td, Wx, Sky, Po. P, Wave. Height, QPF, etc…
The point-n-click era now allows WFOs to provide more detailed location specific forecasts by utilizing these “grids” WFO Tallahassee Point and Click interface http: //www. nws. noaa. gov/tlh
Forecast Challenge The warm season is dominated by outdoor and water related activities. - Beach - Sports - Construction - Pool Threatened daily by diurnal sea-breeze thunderstorms
“It rains every day at 3 o’clock” False statement used to describe Florida Convection Needed to improve daily Po. P forecasts using the Graphical Forecast Editor (GFE) and thus aid in outdoor planning Mon Tues Wed Thurs Fri 50% 50% 50% Not a very useful forecast !
Tallahassee Sea-Breeze Convection Research Background Info
Research began by examining “flow patterns” or “Flow Regimes” These flow regimes are classified by the position of the subtropical ridge relative our forecast area Each regime produces a unique low level flow (1000 -700 mb mean) which will interact differently with the sea breeze to maximize convergence. Typical Regime # 1 Pattern
Eleven potential regimes identified Weak and Strong flow from varying directions 1. Light and Variable 2. Light E-NE flow ( < 10 knots ) 3. Strong E-NE flow ( > 10 knots ) 4. Light W-SW flow 5. Strong W-SW flow 6. Light SE Flow 7. Strong SE Flow 8. Light N-NW flow 9. Strong N-NW flow 10. Suppressed (Strong H 5 Ridge Overhead) 11. Disturbed (Usually similar to Strong W-SW flow)
Flow Regime Climatology A rainfall climatology for each regime was produced using data over a 5 year period from 2002 through 2007 Each warm season day (June 1 st – September 15 th) was classified into one of our eleven regimes Archived radar/MPE (Multi-sensor Precipitation Estimates) data was obtained to determine which radar pixels received measurable rainfall on each day
For the days comprising each regime, the frequency in which a pixel received rainfall became a baseline Po. P for that location For example: Flow regime # 1 was seen 120 days during the time of study. A given pixel received measurable rainfall 35 of those days: 35/120 = 0. 29 or 30% A baseline Po. P of 30% is assigned to that location for Regime # 1
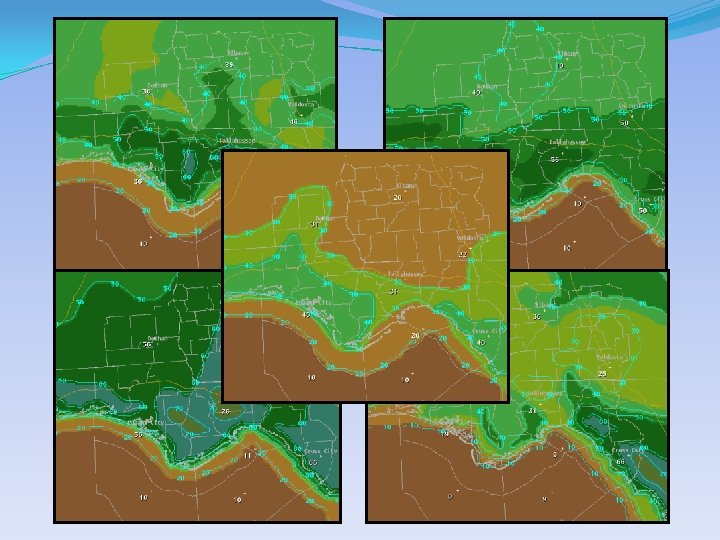
Po. P climatology for each Regime 11 distinct rainfall patterns
Significant differences in localized rainfall probability can easily be seen from one regime to another
Another example of the areal rainfall chances from one regime to another
A convenient method was needed to rapidly reproduce these rainfall climatologies using the GFE software
The Tallahassee Sea-Breeze Convection Tool Forecaster Interface
1. Determines the day’s flow regime 2. The tool will access saved data files for the chosen regime which represent areal coverage of each 10% Po. P interval 3. These files layered on top of one other produce a graphical Po. P forecast that matches the original climatologies
GFE produced Po. P for Regime #3 (top) and original radar based graphic (bottom)
Another Example: GFE produced Po. P for Regime # 10 (top) and original radar based graphic (bottom)
Normal CAPE and PW values for the chosen regime are coded into the tool (slider bars below the regime list) The forecaster can change these values based on local sounding data or numerical guidance If pre-determined thresholds for these fields are exceeded, the climo Po. P grid will be raised or lowered by 10% to 20 %
Additional Options The forecaster can also choose to blend the Climo Po. P grid with one or more traditional guidance packages (MAV, MET, SREF, etc…)
Basic QPF and Sky Grids can also be created to match your Po. P forecast The current “regime” option uses fairly simple algorithms - higher Po. P value results in higher sky cover and QPF More sophisticated procedures are in production for the next build of this tool
Future Upgrades to the sea-breeze tool • Develop higher temporal Po. P grids for each regime (3 or 6 hourly) • Update the tool each winter to include new data from the most recent warm season • Include ongoing cloud frequency research for each regime (GFE Sky grid)
Regime Cloud Frequency Research Brief Overview
• Thunderstorm clusters will often develop expansive anvil/cirrus canopies by the later afternoon hours which expand far from the actual storms. • Cloud frequency grids for each regime can be created for a number of temporal lengths using similar methods to the rainfall frequencies • The sea-breeze tool can then be used to re-produce these cloud frequencies into the GFE sky grids
Daily Cloud Frequencies – Regime 1 1200 Z 1500 Z 2000 Z 1800 Z 2300 Z
Areas have been discovered that have an 80% to 100% probability of cloud cover at a specific time
Climatological QPF Grids ? • QFP grids will be more difficult to produce • Warm season rainfall is highly variable over sub-grid scale distances.
Forecasts with high temporal detail can be best utilized with the hourly weather graphs. These graphs are available through each WFO homepage Hourly Weather Graphs continue to become increasingly popular with the public and other local customers
Thanks You for Listening Any question or comments?