TIN MODEL VOLUMES Reservoir Volumes TIN vs LEVEL


- Slides: 31

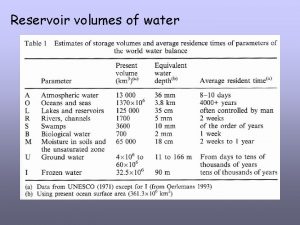
TIN MODEL VOLUMES Reservoir Volumes (TIN vs LEVEL) Beach Erosion Volumes (TIN vs TIN) Volumes with a Planned Line (TIN vs LNW) Volumes with an CHN File (TIN vs CHN) 10/30/2020 2006 HYPACK® Training Seminar 1

TIN MODEL VOLUMES Reservoir Volumes PROJECT: SAMPLE SOLID FILL 10/30/2020 2006 HYPACK® Training Seminar 2

Computing Volumes for Reservoirs in TIN MODEL New and improved in BRUCE! 10/30/2020 2006 HYPACK® Training Seminar 3

Making the TIN 1. Load the ‘Sample Solid Fill’ project and start the TIN MODEL. 2. Use DELC 2. XYZ as your input file with a Tin Max Side of 40. AVI 10/30/2020 2006 HYPACK® Training Seminar 4

TIN MODEL Report If you click the Export – View Report menu item, the TIN MODEL’s text report will appear. – This is where it will store the results of volume computations. – You can also sneak a peak at the Z-Min and ZMax values. 10/30/2020 2006 HYPACK® Training Seminar 5

Initial Reservoir Computation 3. 4. 5. Click ‘Calculate – Volume’ in the TIN MODEL menu. In the ‘Volume Calculation Mode’, select Tin to Level. In the Level Calculation Setting: – – – 6. 7. From: ‘ 80’ To: ‘ 120’ Increment: ’ 10’ Click ‘OK’. Un-Check this box to hide display (much faster). 10/30/2020 2006 HYPACK® Training Seminar 6

Running the Example AVI 10/30/2020 2006 HYPACK® Training Seminar 7

The Results Volume of ‘Pool’ 10/30/2020 2006 HYPACK® Training Seminar Area of ‘Pool’ 8

Explanation of Materials The figure (right) shows a cross section through the model. The Red represents the water. The Gray represents the land above the specified level. 10/30/2020 2006 HYPACK® Training Seminar 9

Computing Volume vs. Level with Elevation Data When working with ‘Elevation’ data (z-value is increasing upwards): – Click View – Set View – Select ‘Elevation’. If done properly, the volume of water should still be represented in red. 10/30/2020 2006 HYPACK® Training Seminar 10

TIN MODEL VOLUMES Beach Erosion Study: XYZ versus XYZ Volumes PROJECT: SAMPLE TIN DIFFERENCES 10/30/2020 2006 HYPACK® Training Seminar 11

The Problem We have two surveys of an area from two different times of the year: – multibeam 3 x 3 Oct. xyz – multibeam 10 x 10 Mar. xyz I want to determine: – How material has moved during the two surveys. – How much material has accumulated or depleted between the two surveys. 10/30/2020 2006 HYPACK® Training Seminar 12

The Solution TIN 1 is in white TIN 2 is in yellow For a ‘node’ of TIN 1: – The z-value from TIN 1 is noted. – The X-Y of the node is projected onto TIN 2. – The z-value from TIN 2 for the X-Y is noted. – A difference file is created by saving the X-Y of the node with a Z-value = Z 1 – Z 2. Z 1 Z 2 The result is an XYZ data set where ‘Z’ represents the difference in elevation between the two models. 10/30/2020 2006 HYPACK® Training Seminar 13

Making the Difference XYZ File 1 Open the ‘SAMPLE TIN DIFFERENCES’ project. Start the TIN MODEL. Click ‘File – New’ – – – Click ‘Tin to Tin’ Input File: Multibeam 3 x 3 Oct. xyz Second File: Multibeam 10 x 10 Mar. xyz Tin Max Side = 50 Click ‘OK’. 2 Click ‘Export – Select’ and select XYZ Tab. – – – XY Source: GRID Z Source: Tin to Tin Statistics: Enable Select Output file name. Export. 10/30/2020 2006 HYPACK® Training Seminar 14

Model the Difference File …. still in the TIN MODEL Click ‘File – New’. Input File: DIFF. XYZ Tin Max Side: 50 Click ‘OK’ 10/30/2020 2006 HYPACK® Training Seminar 16

Viewing the Results The solid fill view was drawn with the following color scheme – Z > 0 (accumulation) Green to grey – Z < 0 (depletion) Yellow to orange In this study, a large sand wave is traveling through the area. 10/30/2020 2006 HYPACK® Training Seminar 17

Net Accumulation or Depletion? 1. 2. 3. 4. Click ‘Calculate – Volumes’ Select ‘Tin to Level’ Set the Levels = 0. Click ‘OK’ Accumulation = Red – 404, 237 ft³ Depletion = Grey – 161, 433 ft³ Net: – +242, 804 ft³ 10/30/2020 2006 HYPACK® Training Seminar 18

TIN MODEL VOLUMES Volumes Using a Planned Line File Created in CHANNEL DESIGN PROJECT: SAMPLE TIN MODEL 10/30/2020 2006 HYPACK® Training Seminar 20

Volumes Using a 3 -Dimensional LNW file The TIN MODEL can compute volumes using a 3 -dimensional LNW file. Volume quantities are computed for: – design template – overdepth template. Material is divided: – – Left slope (or box) Left of center Right slope (or box) You can thank the Philadelphia District, U. S. Army Corps of Engineers. They paid for it. 10/30/2020 2006 HYPACK® Training Seminar 21

Advantages Volume quantities can be computed with multibeam and multiple transducer data. Accounts for variations in bottom topography between planned lines. You can quickly answer ‘what if’ questions by creating a new LNW file and running the same data in TIN MODEL. 10/30/2020 2006 HYPACK® Training Seminar 22

Let’s Run One 1 2 3 4 Open the ‘Sample TIN MODEL’ project. Start the TIN MODEL. Click ‘File - New’. Input File: – AS 4 BEFORE 20. XYZ 7 Section File: GEORGE. LNW TIN Max Side: 50. Invert Value of Z: Yes! 8 Click ‘OK’. 5 6 – When computing volume with this technique: XYZ Data: Invert It LOG Data: Don’t Invert It 10/30/2020 2006 HYPACK® Training Seminar 23

Philadelphia Method Once the model has been generated: 1. Click ‘Calculate – Volumes’. 2. Make sure the ‘Section’ file is GEORGE. LNW. 3. For ‘Volume Calculation Mode’, select ‘Philadelphia’. 4. Under ‘Philadelphia Settings’: – – – AVI Click ‘Slope’. Set the ‘Overdepth’ to 1. 0. We’ll explain what all these things mean in a little bit. 5. Click ‘OK’. 10/30/2020 2006 HYPACK® Training Seminar 24

Sample Philadelphia Report Export –View Report A = Design Material B = Overdepth Material A+B 10/30/2020 2006 HYPACK® Training Seminar 25

Contour Dredging ‘Contour’ computes overdepth material only where the bottom is shoaler than the channel design. Also called ‘Smart’ in Standard HYPACK® method. 10/30/2020 2006 HYPACK® Training Seminar 26

Box Cuts 3 D planned lines have side slope templates shown by ABCDE above. The Box Cut options (right) use BCD from the original template. Points F and G define the left box and right box limits and are computed from info entered in the Philadelphia Setting frame (in green to right). Left Box and Right Box only compute material on one side of the centerline. 10/30/2020 2006 HYPACK® Training Seminar 27

Shoals Only ‘Shoals Only’ will only compute overdepth material in the box extension areas if the bottom measured at the toe line is shoaler than the design depth. It is only associated with box cut computations. 10/30/2020 2006 HYPACK® Training Seminar 28

TIN MODEL Volumes – Pre-Dredge vs. Post-Dredge TIN MODEL can compute a Pre-Dredge versus a Post-Dredge volume. This uses the Philadelphia Method. Input files can be: – XYZ – LOG (Edited ALL) This allows you to compute volumes using multibeam and multiple transducer data. 10/30/2020 2006 HYPACK® Training Seminar 29

Let’s Run It 1. Open the ‘Sample TIN MODEL’ 2. 3. 4. 5. 6. 7. project and start the TIN MODEL. 3 Click ‘File New’. Use your Pre-Dredge data as the 4 input file: AS 4 BEFORE 20. XYZ 5 Use your Post-Dredge data as the Additional File: 6 AS 4 AFTER 20. XYZ The Section file must be a 3 D Planned Line file: GEORGE. LNW Invert the Values if it’s XYZ data. Set the Tin Max Side to 50 and click ‘OK’. 10/30/2020 2006 HYPACK® Training Seminar 7 30

Setting the Method When they are finished, click ‘Calculate – Volumes’. Set ‘Volume Calculation Mode’ to ‘Philadelphia’. Philadelphia Settings: – – Type = Box Contour = On Overdepth = 2. 0’ Box Extensions = 25. 0’ AVI Click ‘OK’. Hint: 10/30/2020 You’ll see the TIN MODEL program run through several screens before it completes the computation. 2006 HYPACK® Training Seminar 31

Viewing the Results Click ‘Export – View Report’. For each pair of lines, the program reports: – The material quantities from the Pre-Dredge survey. – The material quantities from the Post-Dredge survey. – The material removed (difference between the above). – The summary info. 10/30/2020 2006 HYPACK® Training Seminar 32

Summary Explanation Forgive me George, but here I go…. . A: TOTAL REMOVED TO PROJECT DEPTH: The difference in available material above the design template between the Pre-Dredge and Post-Dredge surveys. B: TOTAL PAY REMOVED IN OVERDEPTH: The difference in available material in the overdepth area between the Pre-Dredge and Post-Dredge surveys. C: TOTAL PAY REMOVED: A + B D: TOTAL REMOVED: A + B + Any material removed that is beneath the bottom of the overdepth template. E: TOTAL REMAINING ABOVE PROJECT DEPTH: The available material above the design template after the Post-Dredge survey. F: TOTAL OVERDREDGED MATERIAL: D – C G: TOTAL INFILL MATERIAL: The total material in areas where the Post-Dredge survey is shoaler than the Pre-Dredge survey. 10/30/2020 2006 HYPACK® Training Seminar 33
 Reservoir monitoring system
 Teacup diagram upper snake river
 Level pool routing
 Reservoir high school calendar
 Balantidium coli
 Dead storage in reservoir
 Jackson gulch reservoir
 Reservoir massal
 Reservoir surveillance definition
 Reservoir monitoring system
 Hard labor creek reservoir
 Abingdon reservoir map
 Otorrhoea
 Liquid pressure gas
 A thermal energy reservoir (ter) has
 Investigation for reservoir planning
 Richland creek reservoir
 Reservoir massal
 Anatomy of the digestive system exercise 38
 Reservoir geophysical corporation
 Vision radiology reservoir
 Narva reservoir
 Apwrims reservoir
 Retrograde thrombophlebitis meaning
 Kocks reservoir
 Réservoir hydrogène
 Air to oxygen ratio chart
 Reservoir storage monitoring system
 C-51 reservoir
 Abingdon reservoir map
 Advantages of controlled drug delivery system
 Dinamika rotasi

