The Souths Peculiar Institution John Sacher University of

- Slides: 28
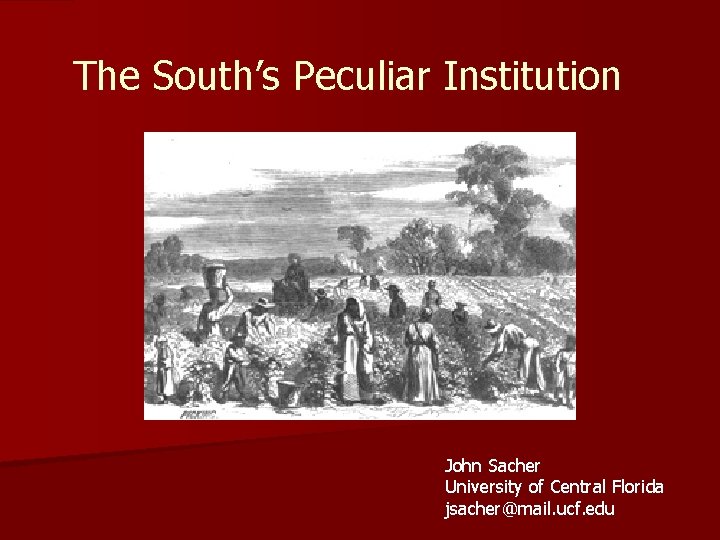
The South’s Peculiar Institution John Sacher University of Central Florida jsacher@mail. ucf. edu
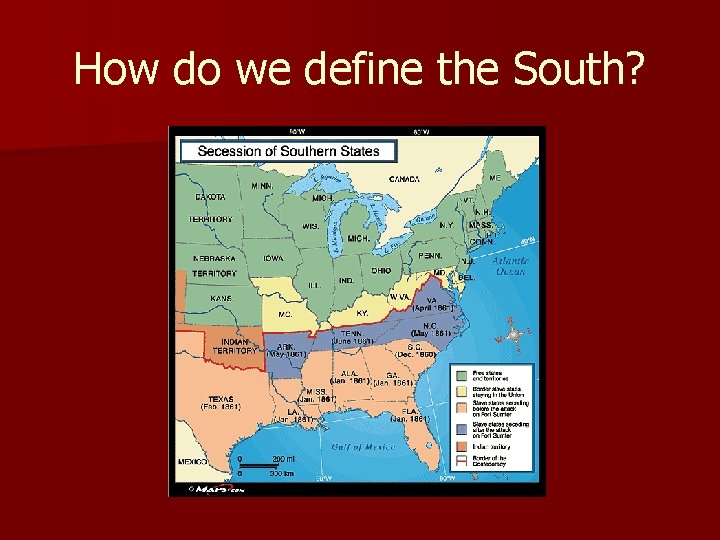
How do we define the South?
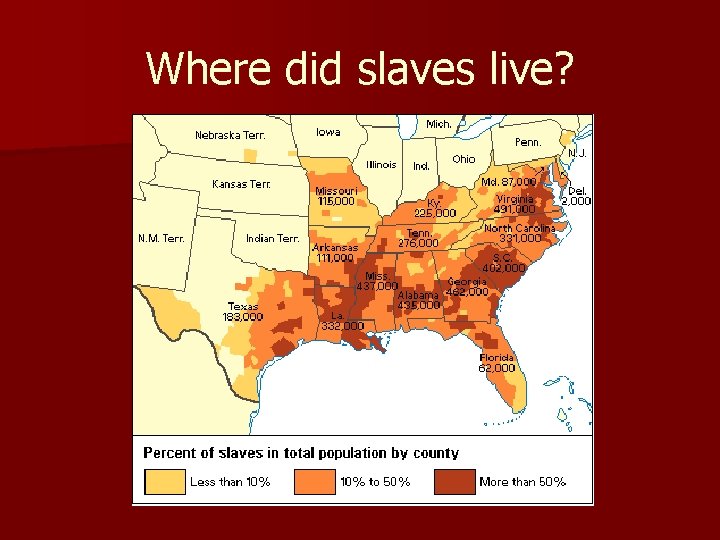
Where did slaves live?
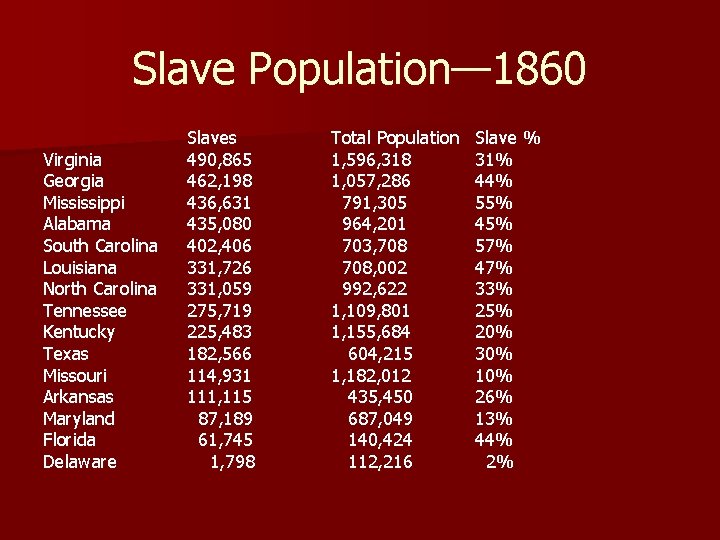
Slave Population— 1860 Virginia Georgia Mississippi Alabama South Carolina Louisiana North Carolina Tennessee Kentucky Texas Missouri Arkansas Maryland Florida Delaware Slaves 490, 865 462, 198 436, 631 435, 080 402, 406 331, 726 331, 059 275, 719 225, 483 182, 566 114, 931 111, 115 87, 189 61, 745 1, 798 Total Population 1, 596, 318 1, 057, 286 791, 305 964, 201 703, 708, 002 992, 622 1, 109, 801 1, 155, 684 604, 215 1, 182, 012 435, 450 687, 049 140, 424 112, 216 Slave % 31% 44% 55% 45% 57% 47% 33% 25% 20% 30% 10% 26% 13% 44% 2%
Slave Population— 1860 South Carolina Mississippi Louisiana Alabama Georgia Florida North Carolina Virginia Texas Arkansas Tennessee Kentucky Maryland Missouri Delaware Slaves 402, 406 436, 631 331, 726 435, 080 462, 198 61, 745 331, 059 490, 865 182, 566 111, 115 275, 719 225, 483 87, 189 114, 931 1, 798 Total Population 703, 708 791, 305 708, 002 964, 201 1, 057, 286 140, 424 992, 622 1, 596, 318 604, 215 435, 450 1, 109, 801 1, 155, 684 687, 049 1, 182, 012 112, 216 Slave % 57% 55% 47% 45% 44% 33% 31% 30% 26% 25% 20% 13% 10% 2%
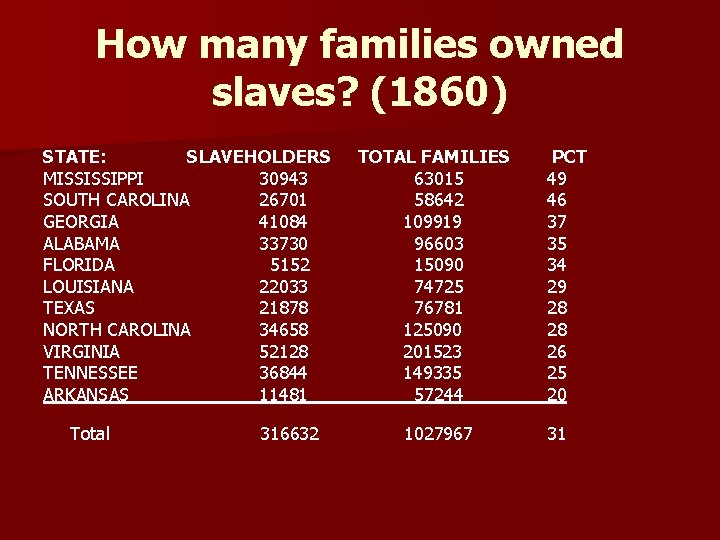
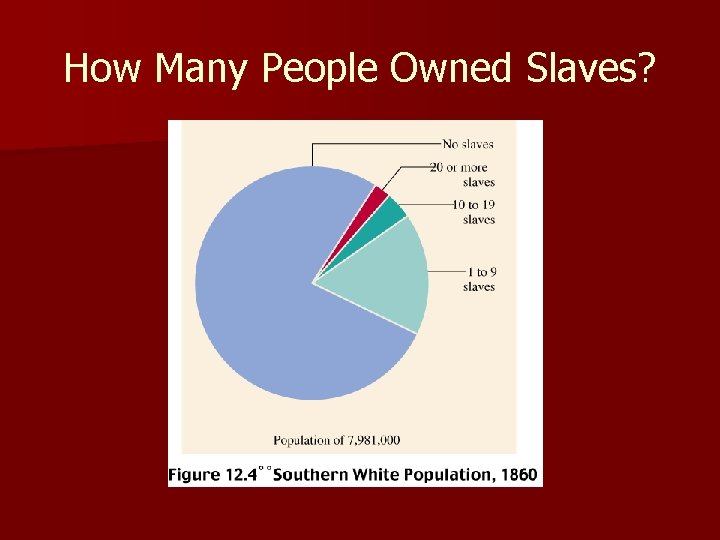
Some Figures: n In 1860, in the slave states, there were 8 million whites who owned 4 million slaves. n The number of slaveholders in 1860—approx. 387, 000 n In other words, only approximately 5% of all whites owned slaves. n Wait a second, only 5% of all whites living in slave states owned slaves, that doesn’t sound right….
How many families owned slaves? (1860) STATE: SLAVEHOLDERS MISSISSIPPI 30943 SOUTH CAROLINA 26701 GEORGIA 41084 ALABAMA 33730 FLORIDA 5152 LOUISIANA 22033 TEXAS 21878 NORTH CAROLINA 34658 VIRGINIA 52128 TENNESSEE 36844 ARKANSAS 11481 Total 316632 TOTAL FAMILIES 63015 58642 109919 96603 15090 74725 76781 125090 201523 149335 57244 1027967 PCT 49 46 37 35 34 29 28 28 26 25 20 31
How Many People Owned Slaves?
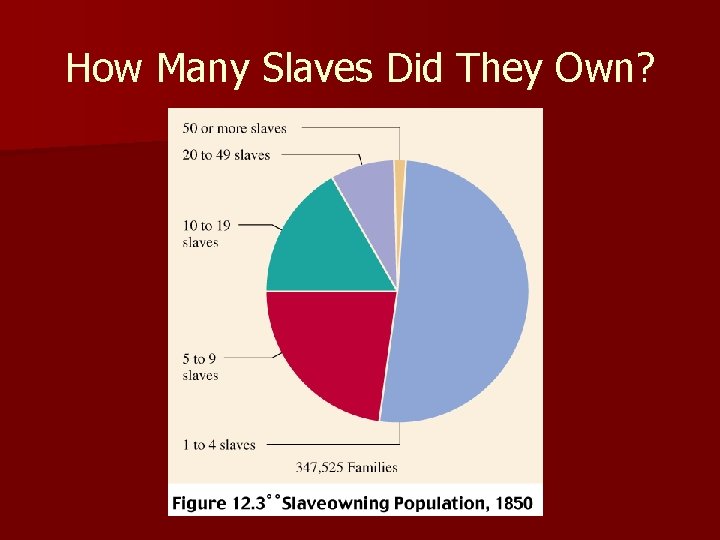
How Many Slaves Did They Own?
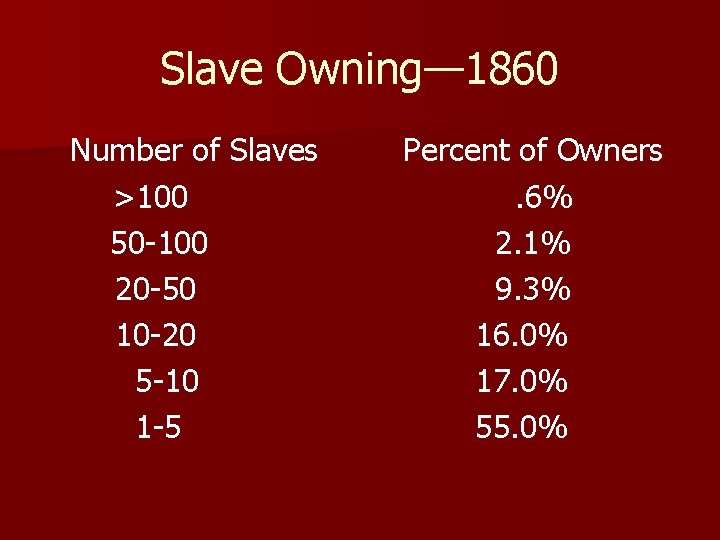
Slave Owning— 1860 Number of Slaves >100 50 -100 20 -50 10 -20 5 -10 1 -5 Percent of Owners. 6% 2. 1% 9. 3% 16. 0% 17. 0% 55. 0%
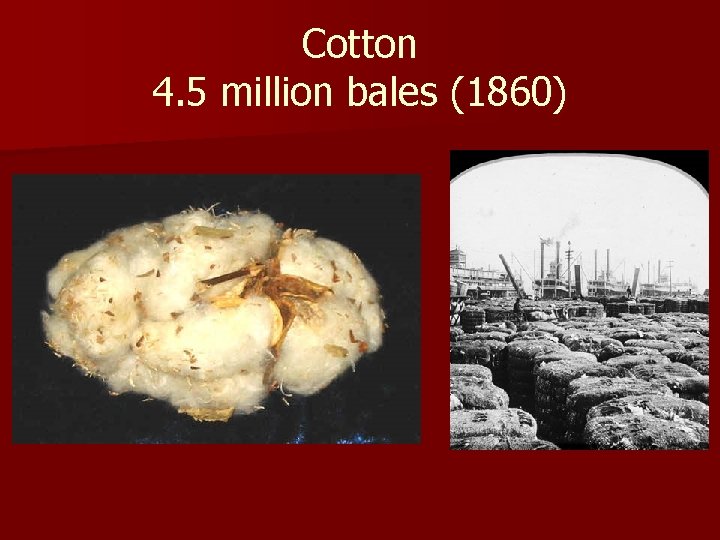
Cotton 4. 5 million bales (1860)
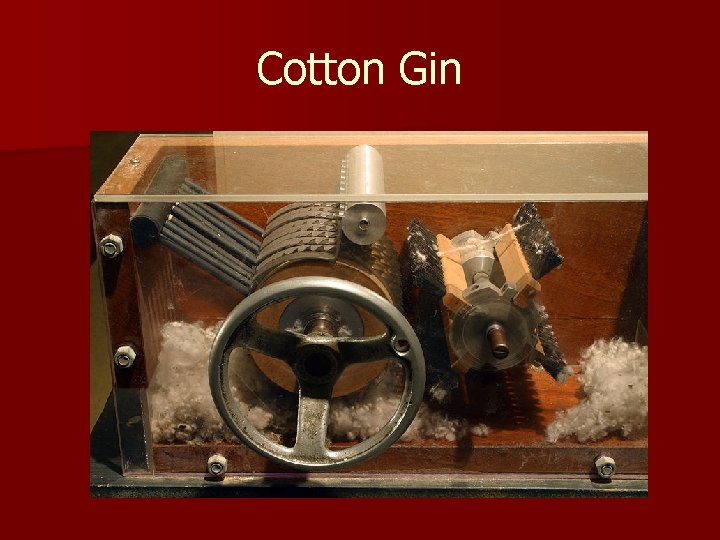
Cotton Gin
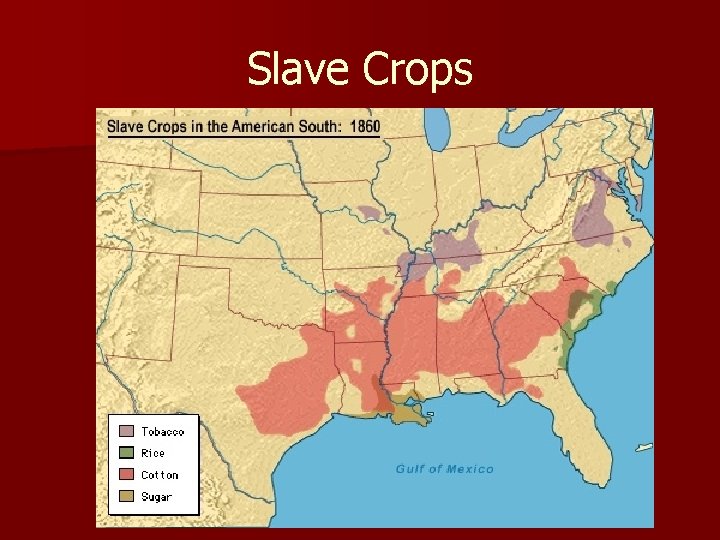
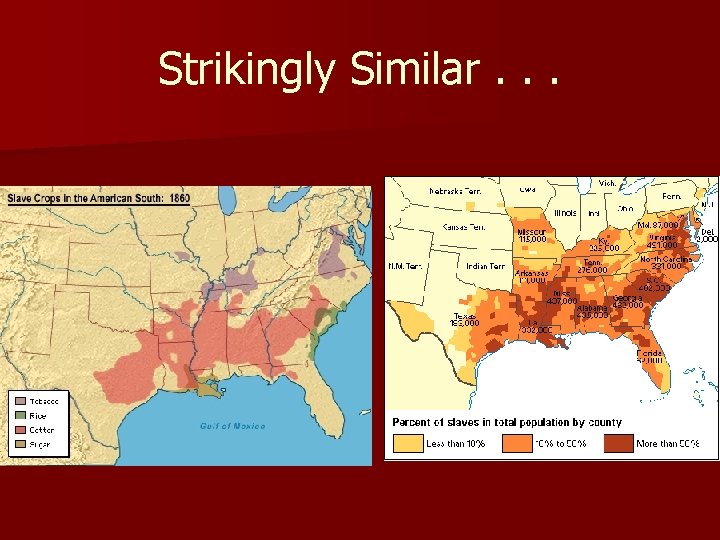
Slave Crops
Strikingly Similar. . .
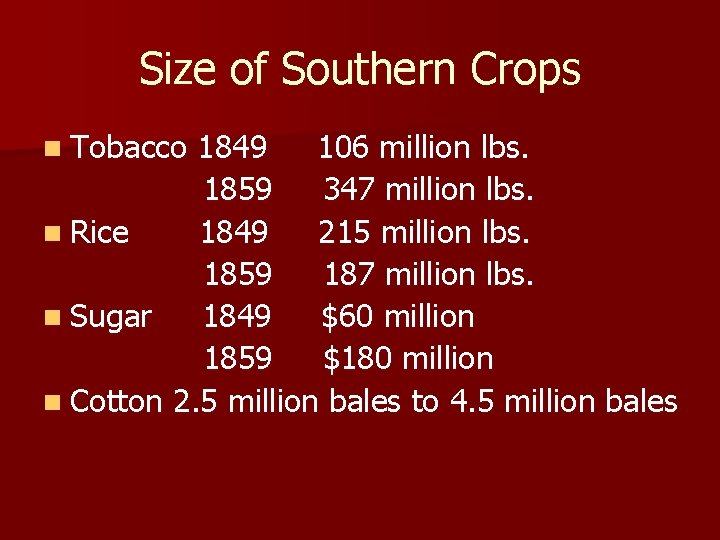
Size of Southern Crops n Tobacco 1849 106 million lbs. 1859 347 million lbs. n Rice 1849 215 million lbs. 1859 187 million lbs. n Sugar 1849 $60 million 1859 $180 million n Cotton 2. 5 million bales to 4. 5 million bales
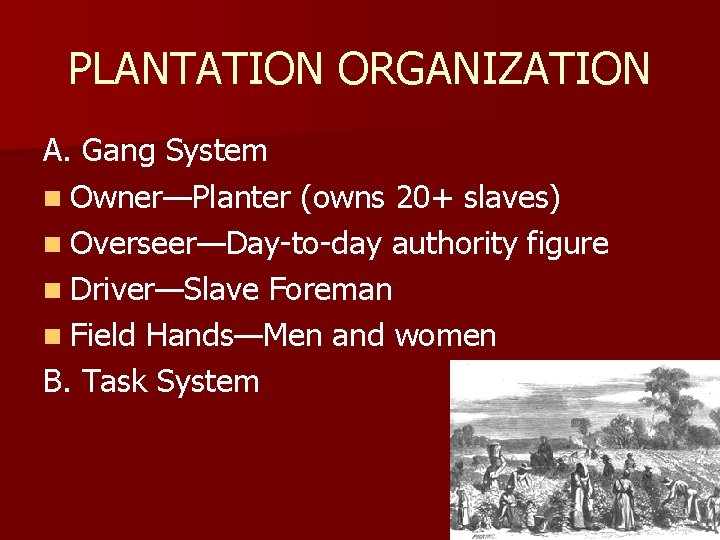
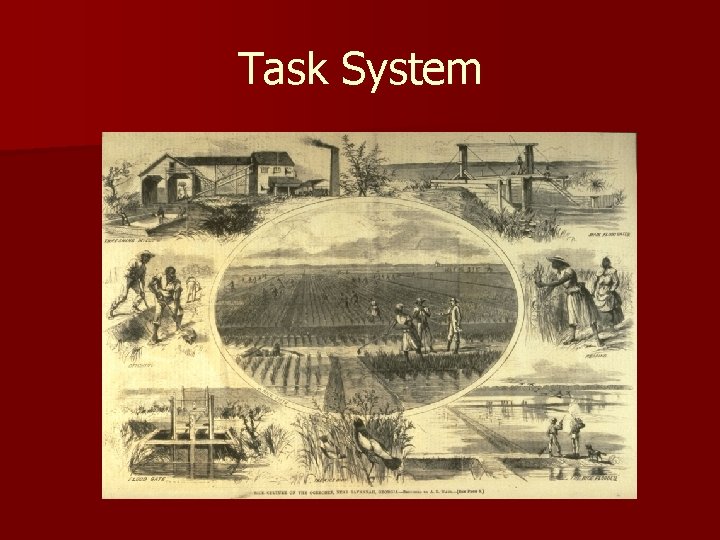
PLANTATION ORGANIZATION A. Gang System n Owner—Planter (owns 20+ slaves) n Overseer—Day-to-day authority figure n Driver—Slave Foreman n Field Hands—Men and women B. Task System
Task System
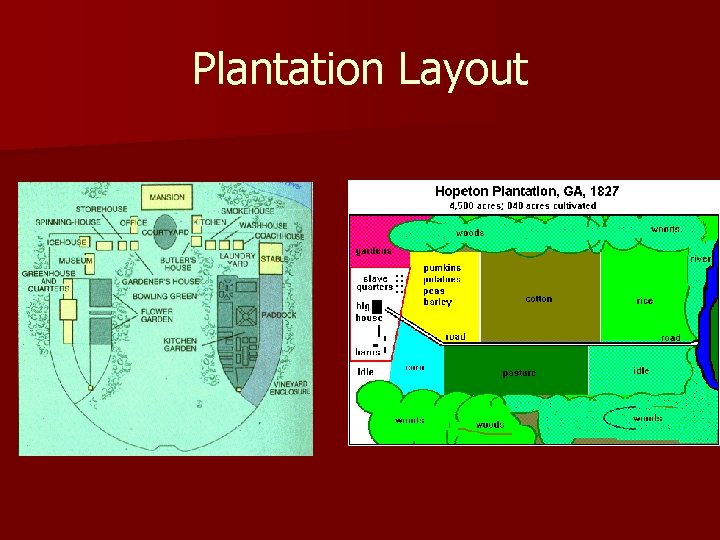
Plantation Layout
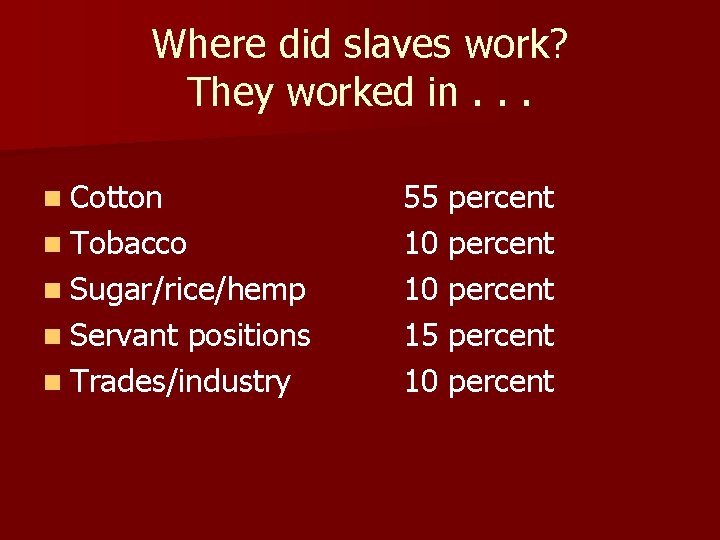
Where did slaves work? They worked in. . . n Cotton n Tobacco n Sugar/rice/hemp n Servant positions n Trades/industry 55 percent 10 percent 15 percent 10 percent
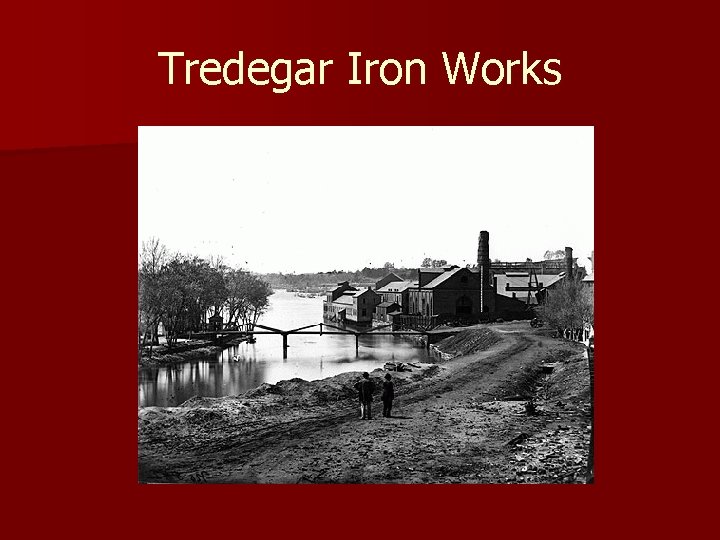
Tredegar Iron Works
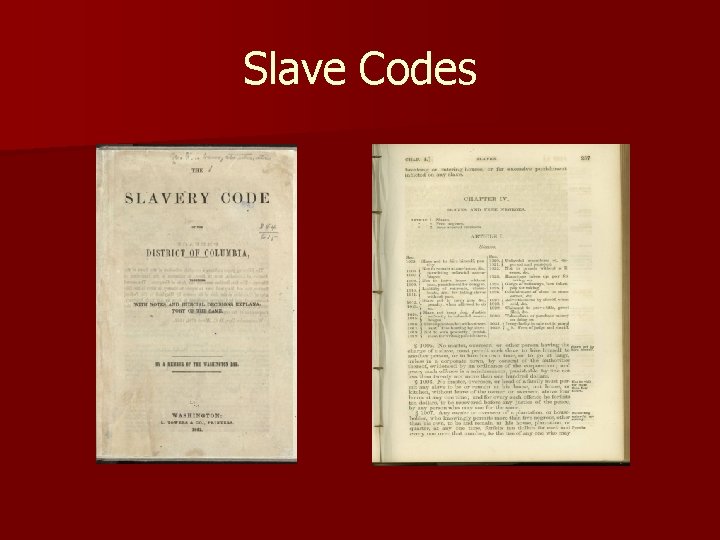
Slave Codes
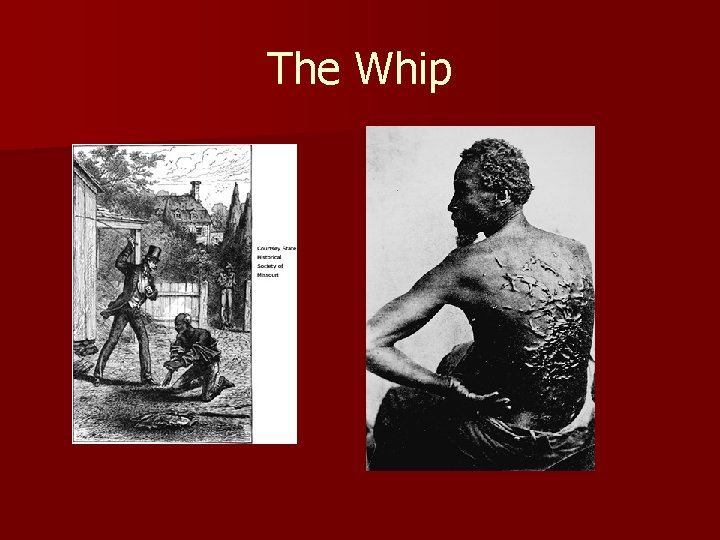
The Whip
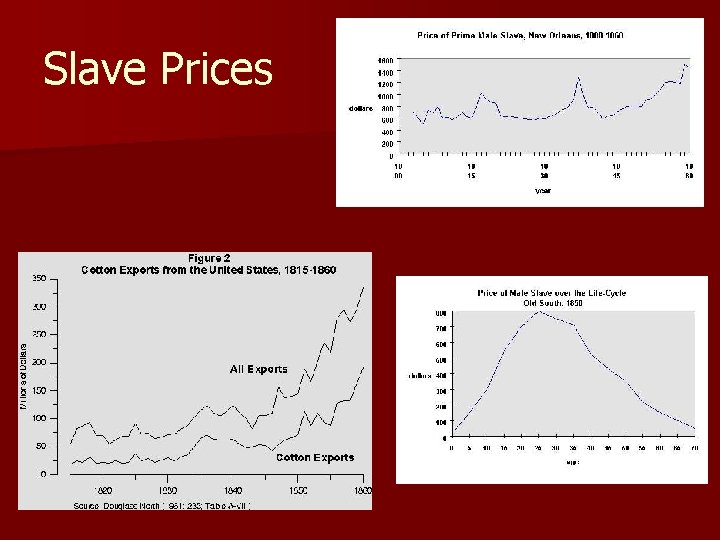
Slave Prices
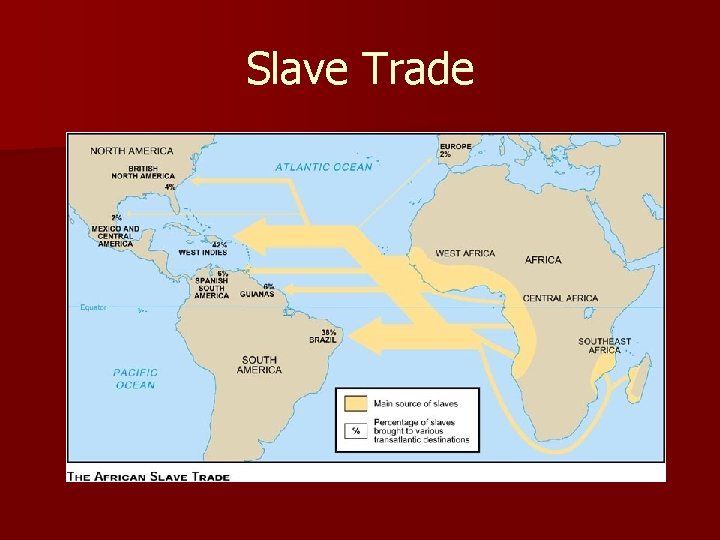
Slave Trade
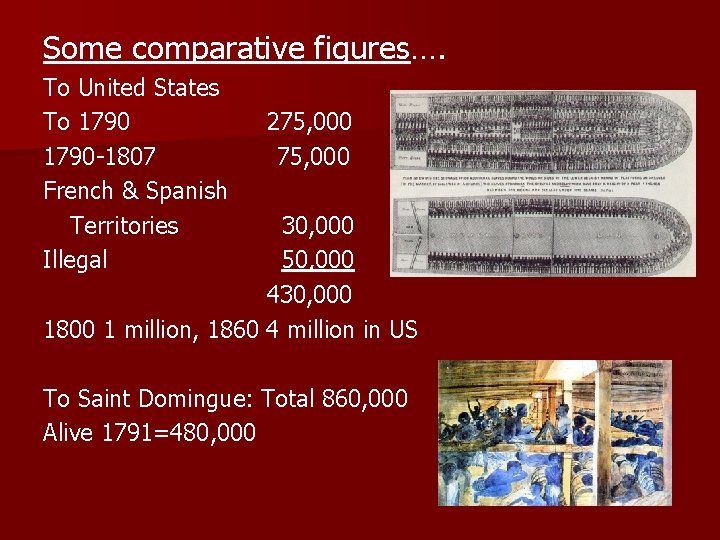
Some comparative figures…. To United States To 1790 -1807 French & Spanish Territories Illegal 275, 000 30, 000 50, 000 430, 000 1800 1 million, 1860 4 million in US To Saint Domingue: Total 860, 000 Alive 1791=480, 000
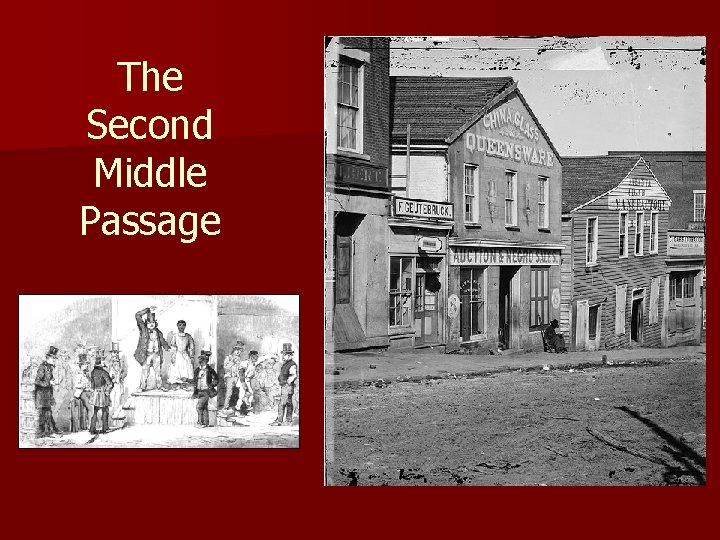
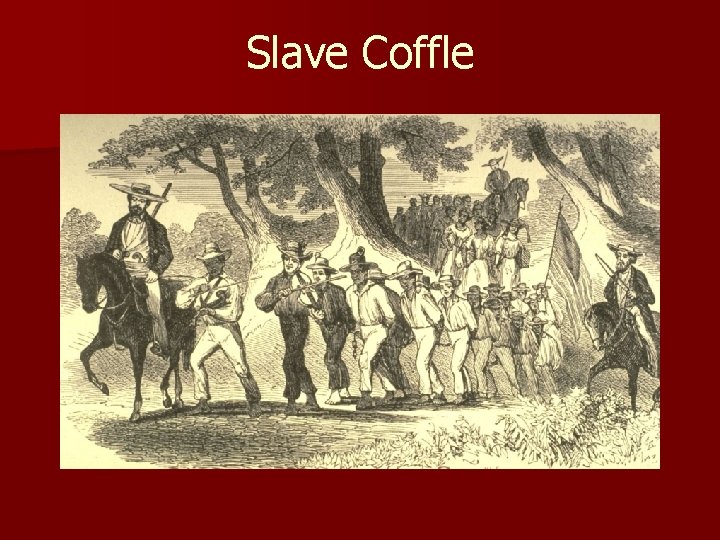
The Second Middle Passage
Slave Coffle
Mary Chesnut South Carolina Plantation Mistress n “Every lady tells you who is the father of all the mulatto children in everybody's household, but those in her own she seems to think drop from the clouds, or pretends so to think. "