Testing significance continuous data Martin van der Esch




- Slides: 49
Testing significance – continuous data Martin van der Esch, Ph. D Amsterdam Rehabilitation Research Center | Reade
Literature Ch 8 -9 Comparing two means, Chapter 9: Andy Field http: //www. youtube. com/watch? v=Ekbk. I 7 x 6 b. NA&list=TL 8 ZKAn. Iv 6 Vb. Qt 4 YOId 55 FDpa. KTf 1 aon 9 Amsterdam Rehabilitation Research Center | Reade
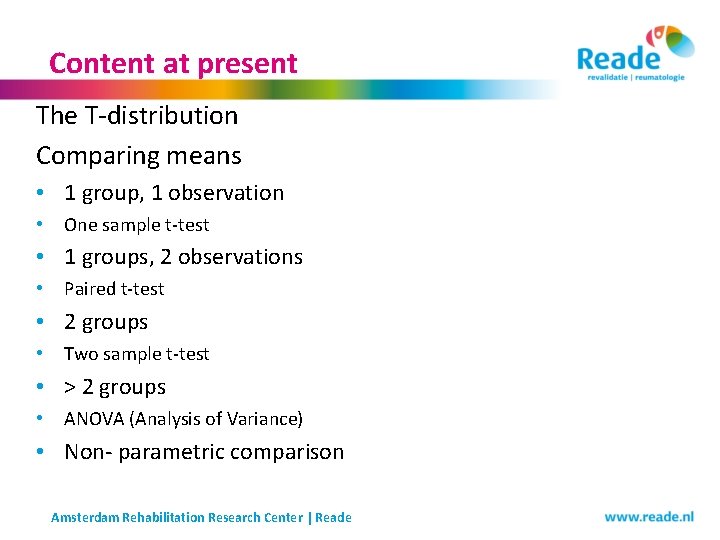
Content at present The T-distribution Comparing means • 1 group, 1 observation • One sample t-test • 1 groups, 2 observations • Paired t-test • 2 groups • Two sample t-test • > 2 groups • ANOVA (Analysis of Variance) • Non- parametric comparison Amsterdam Rehabilitation Research Center | Reade
The t-distribution Amsterdam Rehabilitation Research Center | Reade
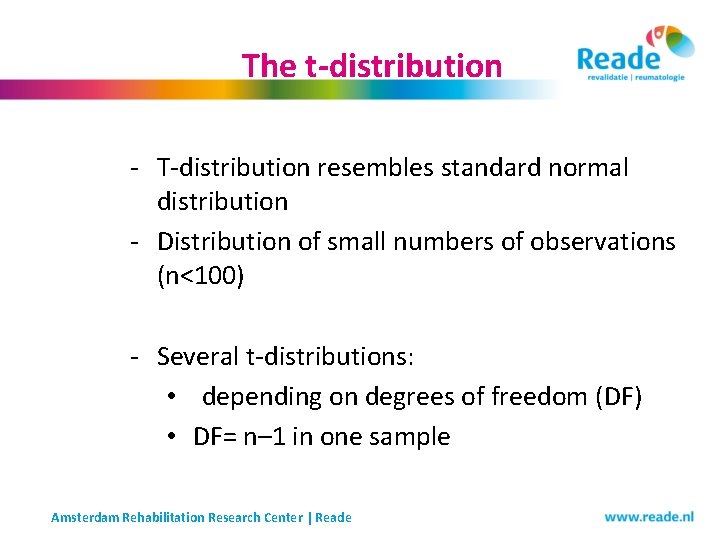
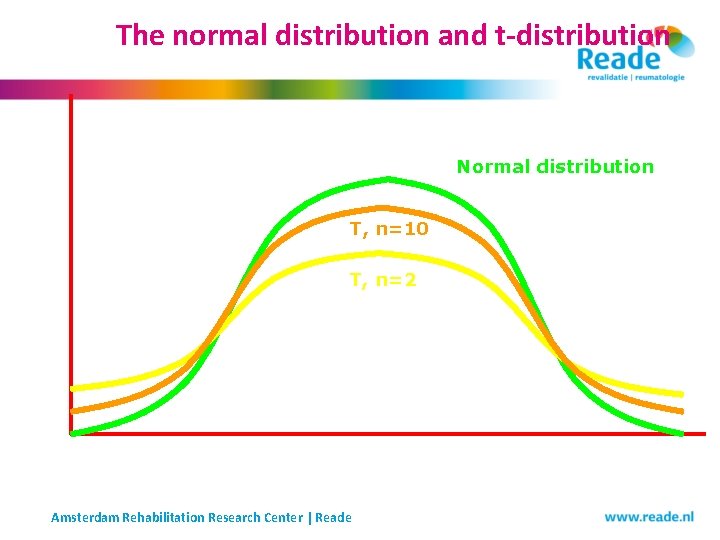
The t-distribution - T-distribution resembles standard normal distribution - Distribution of small numbers of observations (n<100) - Several t-distributions: • depending on degrees of freedom (DF) • DF= n– 1 in one sample Amsterdam Rehabilitation Research Center | Reade
The normal distribution and t-distribution Normal distribution T, n=10 T, n=2 Amsterdam Rehabilitation Research Center | Reade
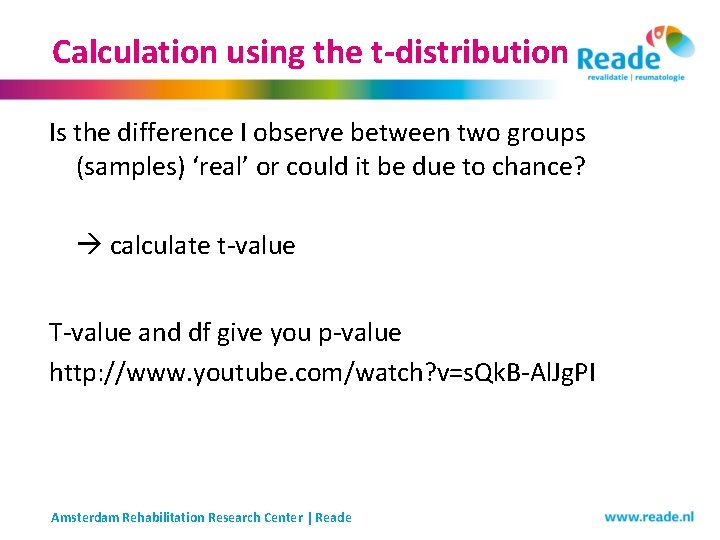
Calculation using the t-distribution Is the difference I observe between two groups (samples) ‘real’ or could it be due to chance? calculate t-value T-value and df give you p-value http: //www. youtube. com/watch? v=s. Qk. B-Al. Jg. PI Amsterdam Rehabilitation Research Center | Reade
Comparing means Amsterdam Rehabilitation Research Center | Reade
Continuous data Ø can take any value within a certain range (measuring) (e. g. body weight) Amsterdam Rehabilitation Research Center | Reade
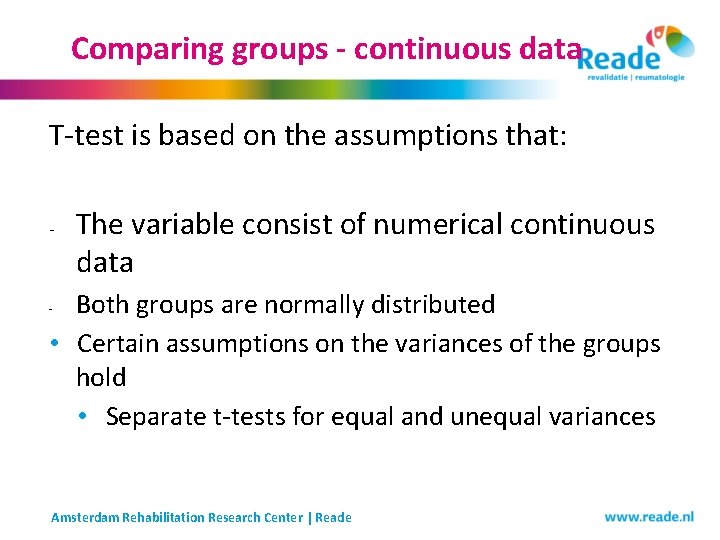
Comparing groups - continuous data T-test is based on the assumptions that: - The variable consist of numerical continuous data Both groups are normally distributed • Certain assumptions on the variances of the groups hold • Separate t-tests for equal and unequal variances - Amsterdam Rehabilitation Research Center | Reade
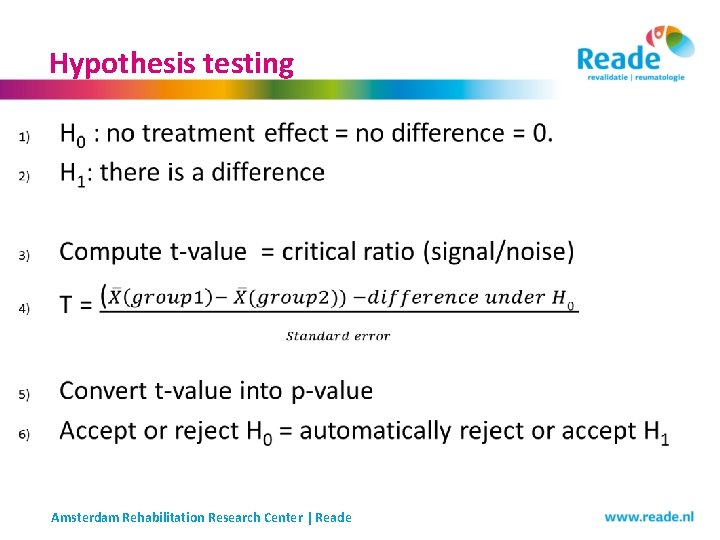
Hypothesis testing Amsterdam Rehabilitation Research Center | Reade
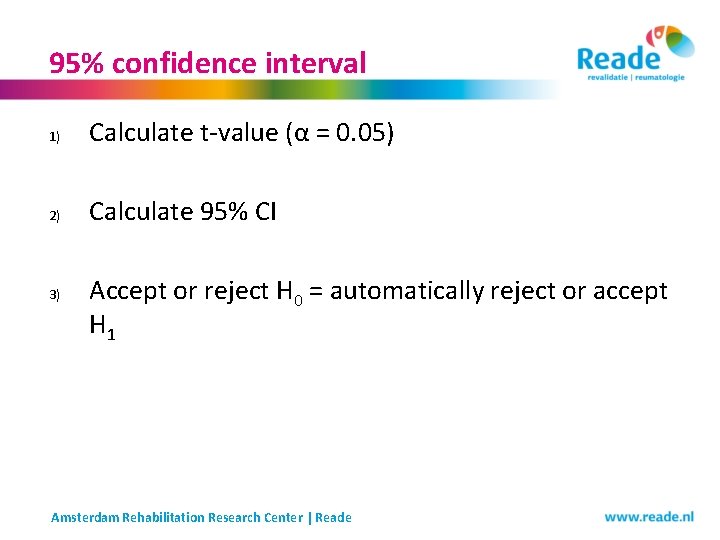
95% confidence interval 1) Calculate t-value (α = 0. 05) 2) Calculate 95% CI 3) Accept or reject H 0 = automatically reject or accept H 1 Amsterdam Rehabilitation Research Center | Reade
1 group, 1 observation - One sample t-test Amsterdam Rehabilitation Research Center | Reade
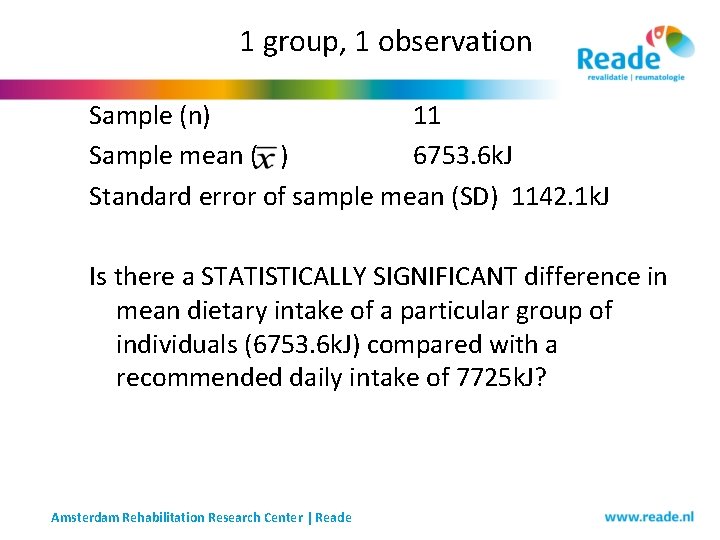
1 group, 1 observation Sample (n) 11 Sample mean ( ) 6753. 6 k. J Standard error of sample mean (SD) 1142. 1 k. J Is there a STATISTICALLY SIGNIFICANT difference in mean dietary intake of a particular group of individuals (6753. 6 k. J) compared with a recommended daily intake of 7725 k. J? Amsterdam Rehabilitation Research Center | Reade
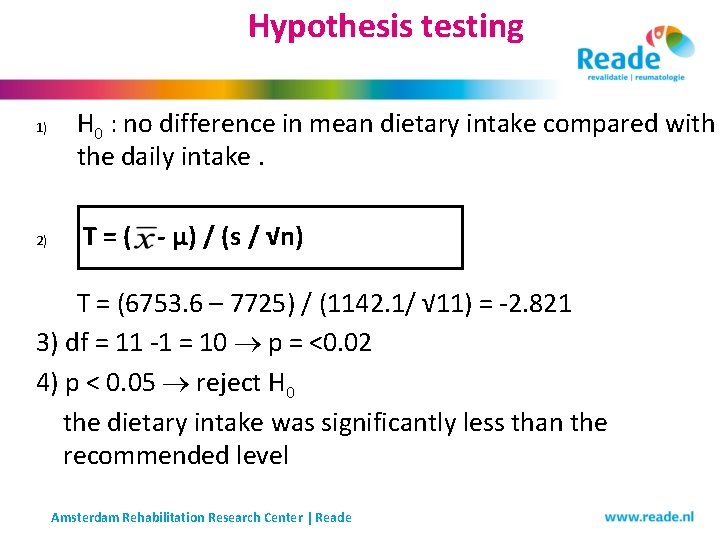
Hypothesis testing 1) 2) H 0 : no difference in mean dietary intake compared with the daily intake. T = ( - µ) / (s / √n) T = (6753. 6 – 7725) / (1142. 1/ √ 11) = -2. 821 3) df = 11 -1 = 10 p = <0. 02 4) p < 0. 05 reject H 0 the dietary intake was significantly less than the recommended level Amsterdam Rehabilitation Research Center | Reade
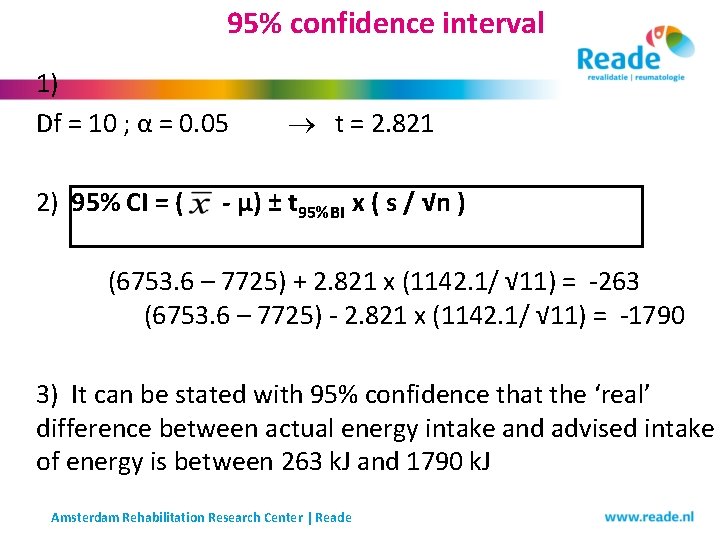
95% confidence interval 1) Df = 10 ; α = 0. 05 2) 95% CI = ( t = 2. 821 - µ) ± t 95%BI x ( s / √n ) (6753. 6 – 7725) + 2. 821 x (1142. 1/ √ 11) = -263 (6753. 6 – 7725) - 2. 821 x (1142. 1/ √ 11) = -1790 3) It can be stated with 95% confidence that the ‘real’ difference between actual energy intake and advised intake of energy is between 263 k. J and 1790 k. J Amsterdam Rehabilitation Research Center | Reade
1 group, 2 observations - Paired t-test Amsterdam Rehabilitation Research Center | Reade
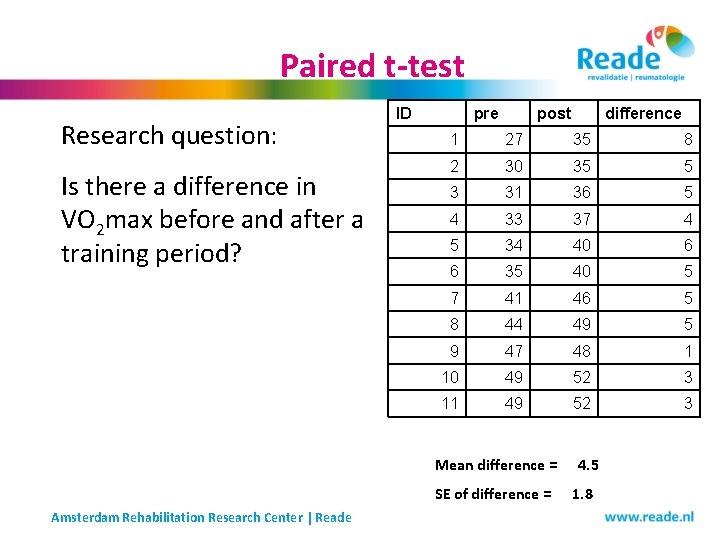
Paired t-test Research question: Is there a difference in VO 2 max before and after a training period? ID pre post 1 27 35 8 2 30 35 5 3 31 36 5 4 33 37 4 5 34 40 6 6 35 40 5 7 41 46 5 8 44 49 5 9 47 48 1 10 49 52 3 11 49 52 3 Mean difference = SE of difference = Amsterdam Rehabilitation Research Center | Reade difference 4. 5 1. 8
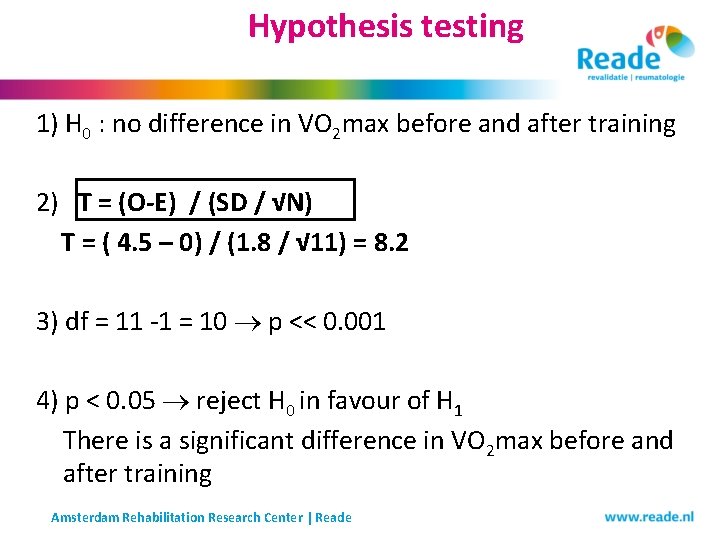
Hypothesis testing 1) H 0 : no difference in VO 2 max before and after training 2) T = (O-E) / (SD / √N) T = ( 4. 5 – 0) / (1. 8 / √ 11) = 8. 2 3) df = 11 -1 = 10 p << 0. 001 4) p < 0. 05 reject H 0 in favour of H 1 There is a significant difference in VO 2 max before and after training Amsterdam Rehabilitation Research Center | Reade
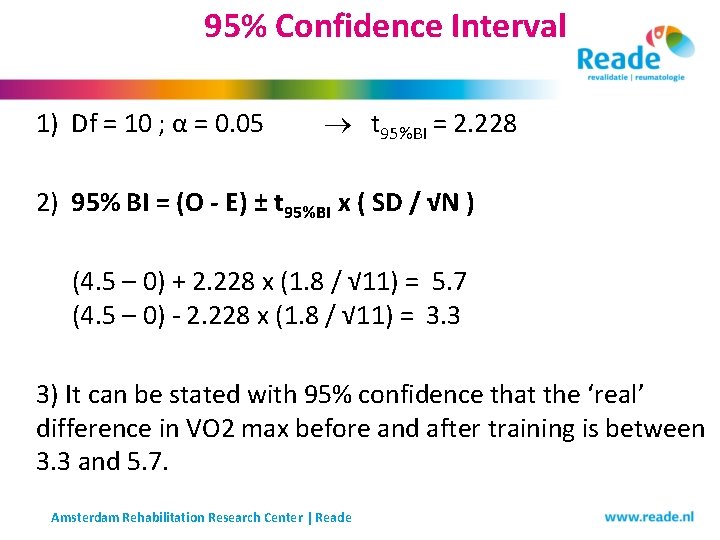
95% Confidence Interval 1) Df = 10 ; α = 0. 05 t 95%BI = 2. 228 2) 95% BI = (O - E) ± t 95%BI x ( SD / √N ) (4. 5 – 0) + 2. 228 x (1. 8 / √ 11) = 5. 7 (4. 5 – 0) - 2. 228 x (1. 8 / √ 11) = 3. 3 3) It can be stated with 95% confidence that the ‘real’ difference in VO 2 max before and after training is between 3. 3 and 5. 7. Amsterdam Rehabilitation Research Center | Reade
2 independent groups - Two sample t-test Amsterdam Rehabilitation Research Center | Reade
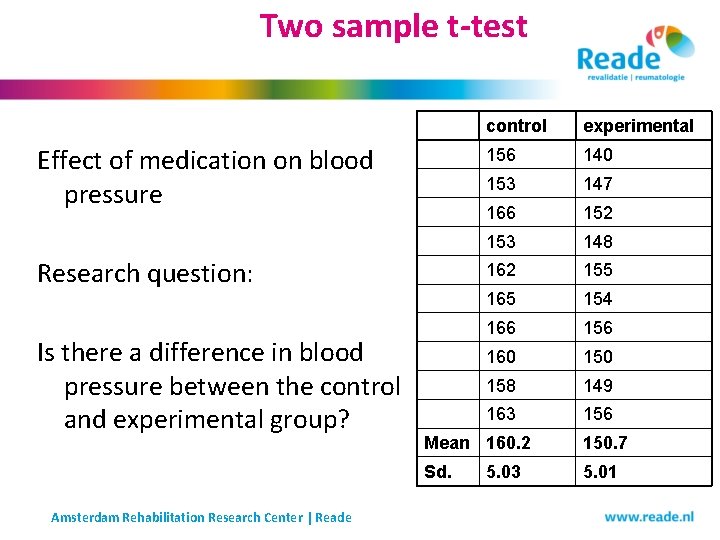
Two sample t-test Effect of medication on blood pressure Research question: Is there a difference in blood pressure between the control and experimental group? Amsterdam Rehabilitation Research Center | Reade control experimental 156 140 153 147 166 152 153 148 162 155 165 154 166 156 160 158 149 163 156 Mean 160. 2 150. 7 Sd. 5. 01 5. 03
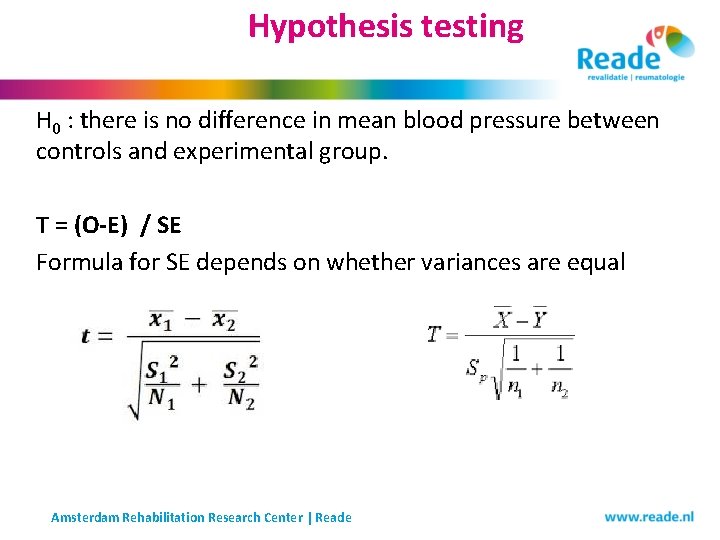
Hypothesis testing H 0 : there is no difference in mean blood pressure between controls and experimental group. T = (O-E) / SE Formula for SE depends on whether variances are equal Amsterdam Rehabilitation Research Center | Reade
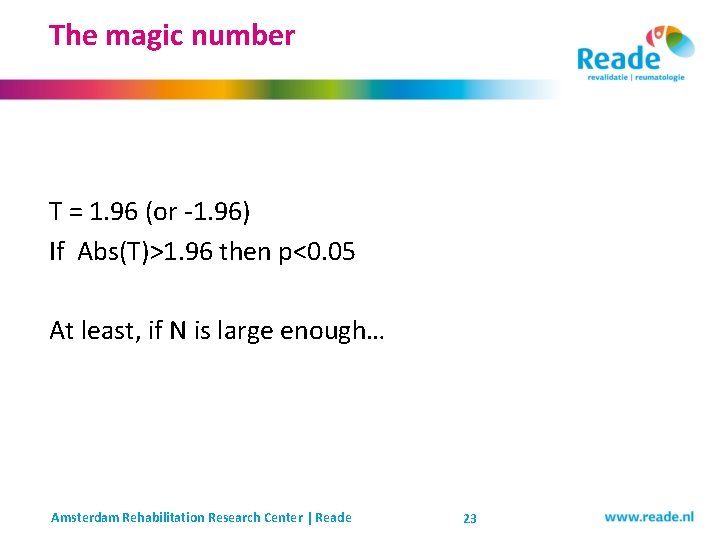
The magic number T = 1. 96 (or -1. 96) If Abs(T)>1. 96 then p<0. 05 At least, if N is large enough… Amsterdam Rehabilitation Research Center | Reade 23
> 2 groups ANOVA (Analysis of Variance) http: //www. youtube. com/watch? v=oa. Jz. Cp. I-j. Cg Amsterdam Rehabilitation Research Center | Reade
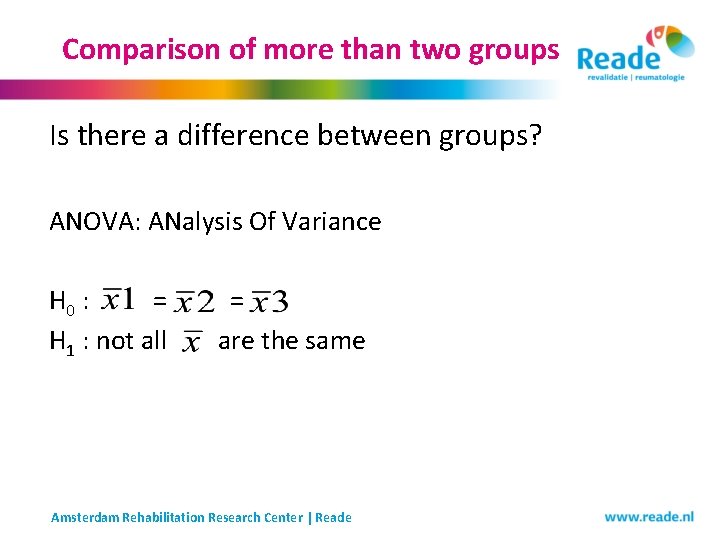
Comparison of more than two groups Is there a difference between groups? ANOVA: ANalysis Of Variance H 0 : = H 1 : not all are the same Amsterdam Rehabilitation Research Center | Reade
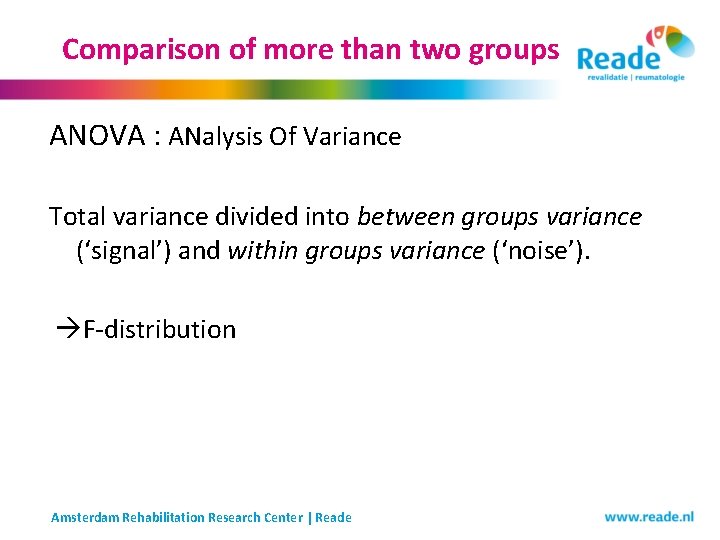
Comparison of more than two groups ANOVA : ANalysis Of Variance Total variance divided into between groups variance (‘signal’) and within groups variance (‘noise’). F-distribution Amsterdam Rehabilitation Research Center | Reade
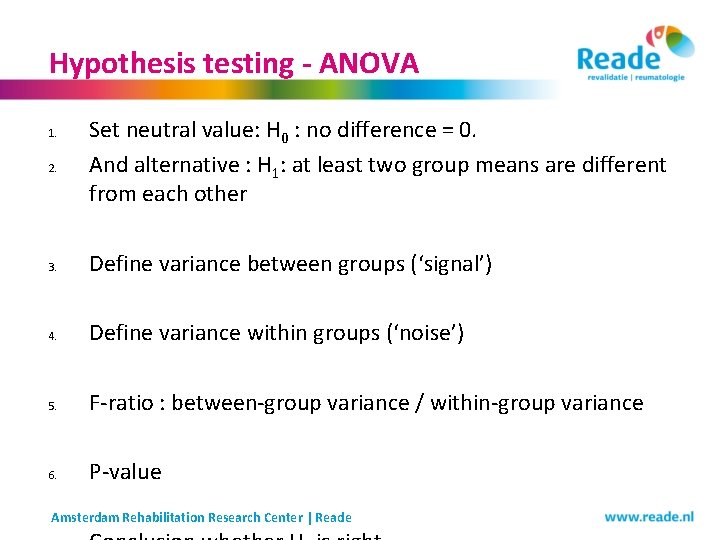
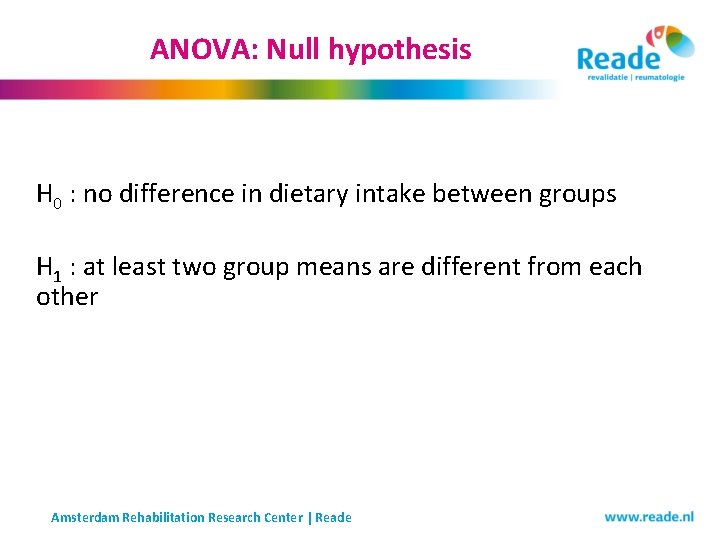
Hypothesis testing - ANOVA 1. 2. Set neutral value: H 0 : no difference = 0. And alternative : H 1: at least two group means are different from each other 3. Define variance between groups (‘signal’) 4. Define variance within groups (‘noise’) 5. F-ratio : between-group variance / within-group variance 6. P-value Amsterdam Rehabilitation Research Center | Reade
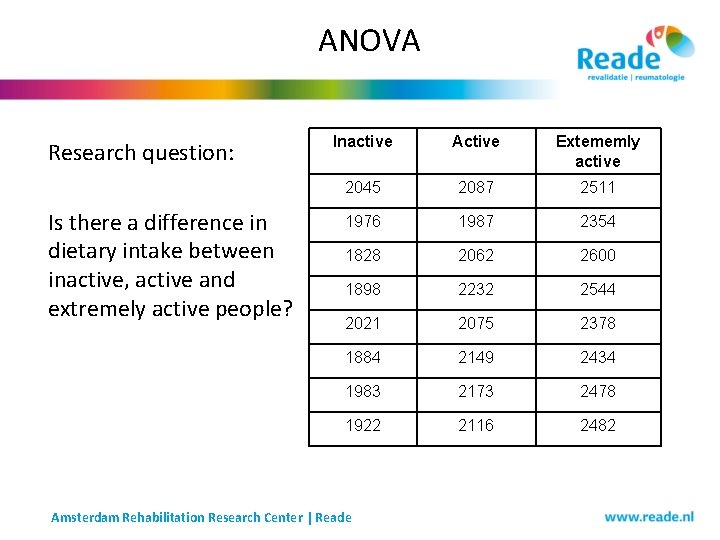
ANOVA Research question: Is there a difference in dietary intake between inactive, active and extremely active people? Inactive Active Extememly active 2045 2087 2511 1976 1987 2354 1828 2062 2600 1898 2232 2544 2021 2075 2378 1884 2149 2434 1983 2173 2478 1922 2116 2482 Amsterdam Rehabilitation Research Center | Reade
ANOVA: Null hypothesis H 0 : no difference in dietary intake between groups H 1 : at least two group means are different from each other Amsterdam Rehabilitation Research Center | Reade
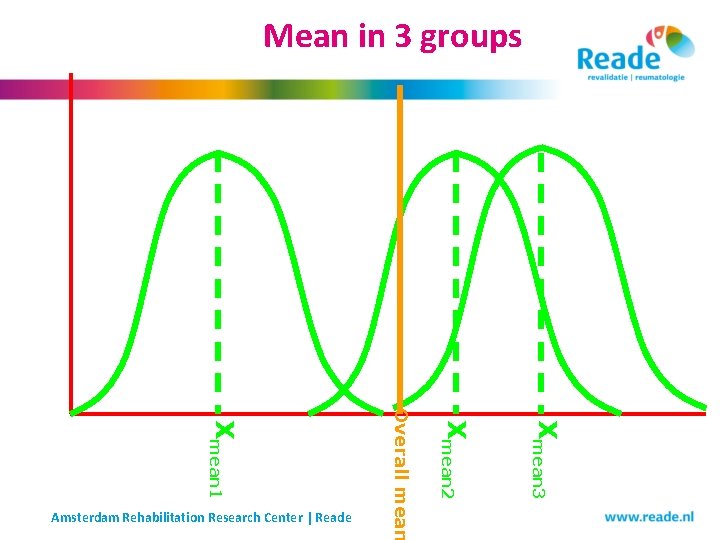
Mean in 3 groups Xmean 3 Xmean 2 Overall mean Xmean 1 Amsterdam Rehabilitation Research Center | Reade
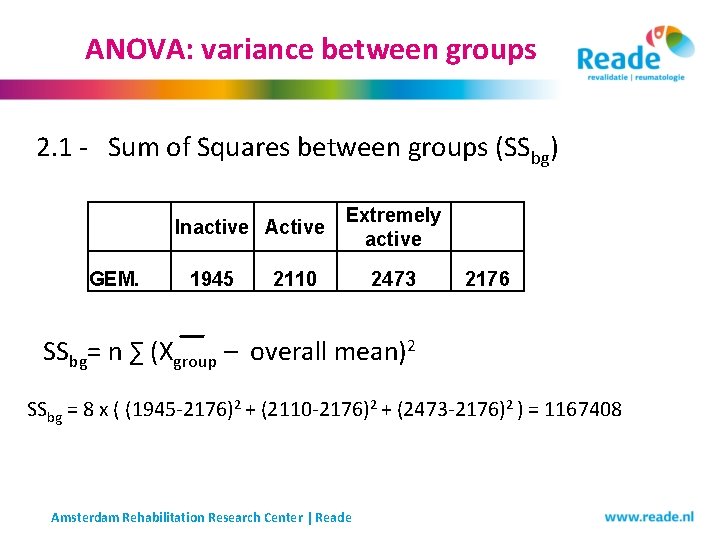
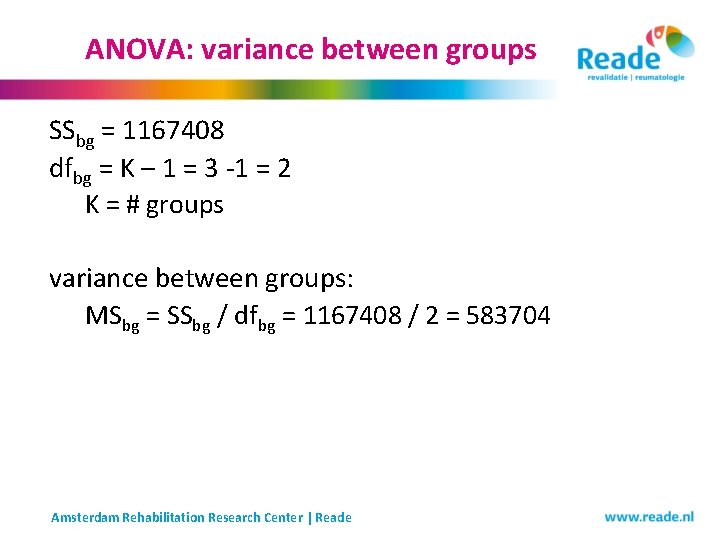
ANOVA: variance between groups 2. 1 - Sum of Squares between groups (SSbg) GEM. Inactive Active 1945 Extremely active 2110 2473 2176 SSbg= n ∑ (Xgroup – overall mean)2 SSbg = 8 x ( (1945 -2176)2 + (2110 -2176)2 + (2473 -2176)2 ) = 1167408 Amsterdam Rehabilitation Research Center | Reade
ANOVA: variance between groups SSbg = 1167408 dfbg = K – 1 = 3 -1 = 2 K = # groups variance between groups: MSbg = SSbg / dfbg = 1167408 / 2 = 583704 Amsterdam Rehabilitation Research Center | Reade
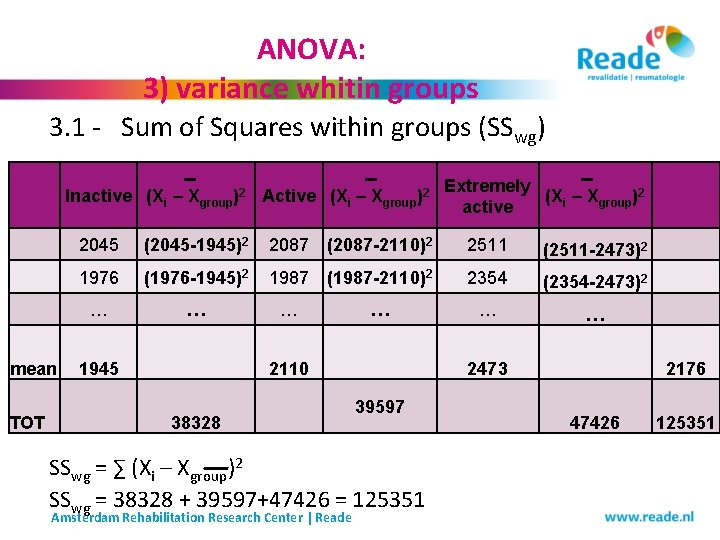
ANOVA: 3) variance whitin groups 3. 1 - Sum of Squares within groups (SSwg) Inactive (Xi – Xgroup)2 Active (Xi – Xgroup)2 Extremely (Xi – Xgroup)2 active 2045 (2045 -1945)2 2087 (2087 -2110)2 2511 (2511 -2473)2 1976 (1976 -1945)2 1987 (1987 -2110)2 2354 (2354 -2473)2 … … … 1945 2110 2473 2176 47426 125351 mean TOT 38328 39597 SSwg = ∑ (Xi – Xgroup)2 SSwg = 38328 + 39597+47426 = 125351 Amsterdam Rehabilitation Research Center | Reade
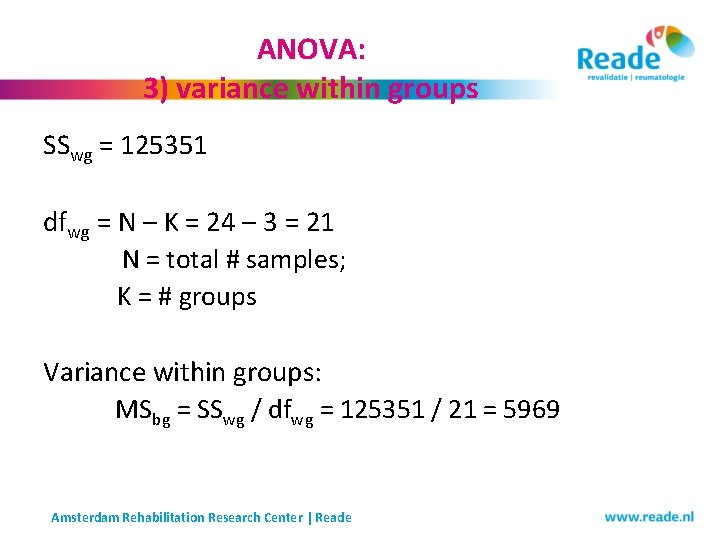
ANOVA: 3) variance within groups SSwg = 125351 dfwg = N – K = 24 – 3 = 21 N = total # samples; K = # groups Variance within groups: MSbg = SSwg / dfwg = 125351 / 21 = 5969 Amsterdam Rehabilitation Research Center | Reade
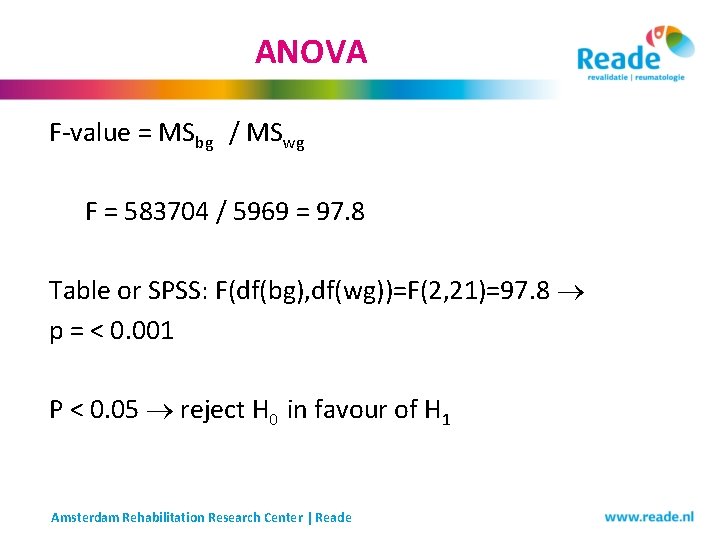
ANOVA F-value = MSbg / MSwg F = 583704 / 5969 = 97. 8 Table or SPSS: F(df(bg), df(wg))=F(2, 21)=97. 8 p = < 0. 001 P < 0. 05 reject H 0 in favour of H 1 Amsterdam Rehabilitation Research Center | Reade
Comparing groups - continous data Assumptions!! - Continuous data - Normally distributed This is not always true…. non-parametric comparison Amsterdam Rehabilitation Research Center | Reade
Non- parametric comparison Amsterdam Rehabilitation Research Center | Reade
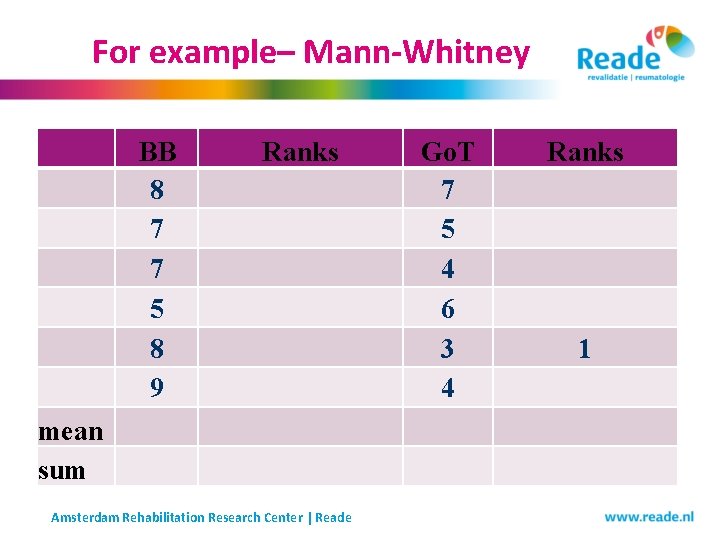
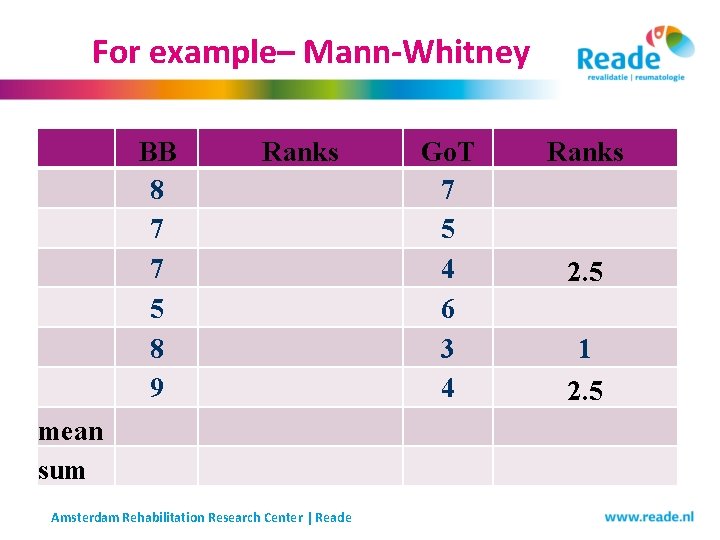
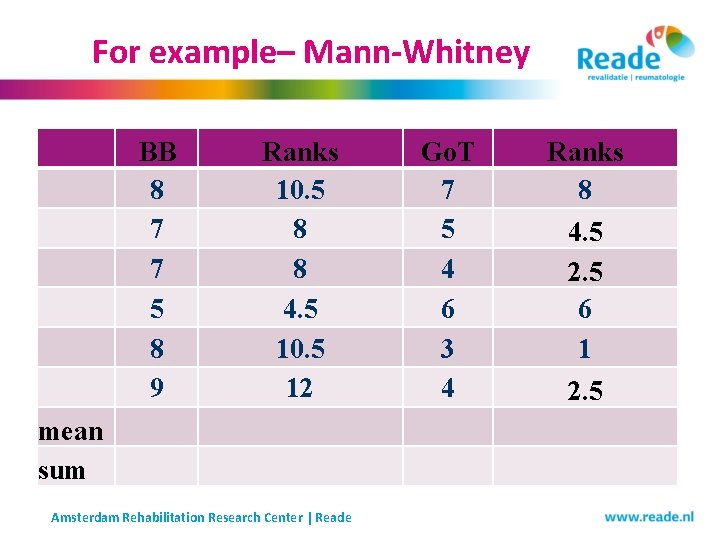
Nonparametric comparison: All observed values are ranked (lowest to highest – regardless of group) All observed values are replaced by ranking (lowest value becomes 1, highest value becomes n) Groups are analyzed based on parametric statistics on rank numbers ! P-value Amsterdam Rehabilitation Research Center | Reade 38
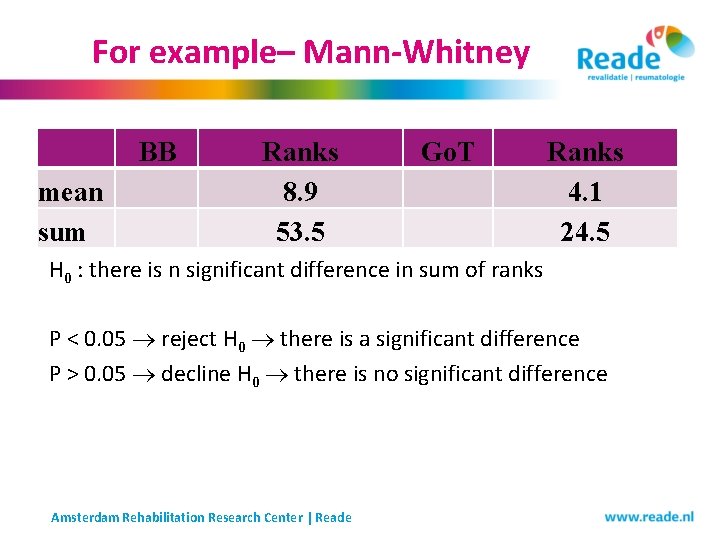
Non-parametric comparison Parametric testing based on ranks Paired t-test -> Wilcoxon Two sample t-test -> Mann-Whitney ANOVA -> Kruskal-Wallis toets (http: //www. youtube. com/watch? v=y. M 9 T 7 L 3 jq. N 8) H 0 : no difference in sum of ranks H 1 : difference in sum of ranks !! Only hypothesis testing (p-value), no 95% CI Amsterdam Rehabilitation Research Center | Reade
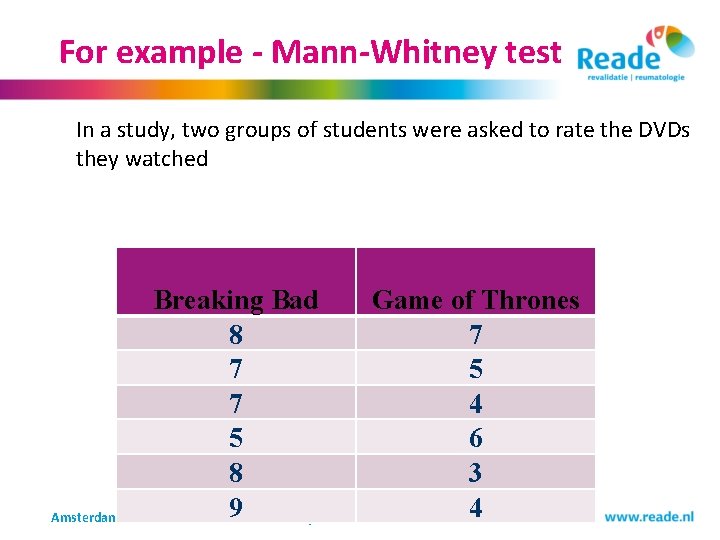
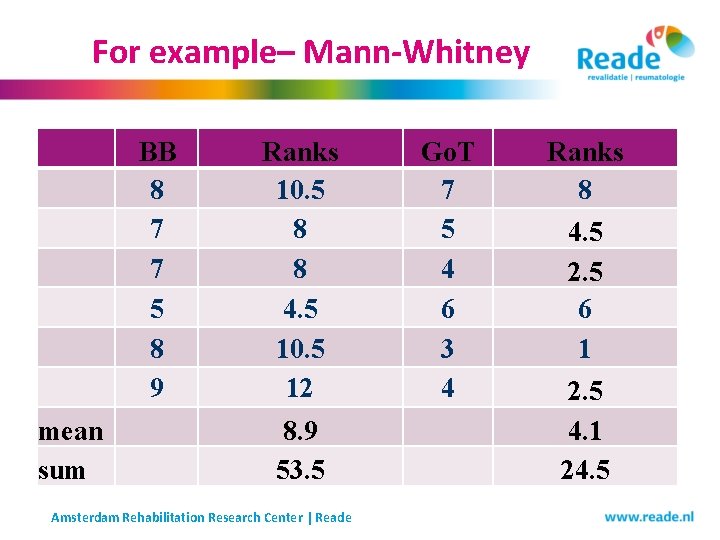
For example - Mann-Whitney test In a study, two groups of students were asked to rate the DVDs they watched Breaking Bad Game of Thrones 8 7 7 5 7 4 5 6 8 3 9 Center | Reade 4 Amsterdam Rehabilitation Research
For example– Mann-Whitney mean sum BB 8 7 7 5 8 9 Ranks Amsterdam Rehabilitation Research Center | Reade Go. T 7 5 4 6 3 4 Ranks 1
For example– Mann-Whitney mean sum BB 8 7 7 5 8 9 Ranks Amsterdam Rehabilitation Research Center | Reade Go. T 7 5 4 6 3 4 Ranks 2. 5 1 2. 5
For example– Mann-Whitney mean sum BB 8 7 7 5 8 9 Ranks 10. 5 8 8 4. 5 10. 5 12 Amsterdam Rehabilitation Research Center | Reade Go. T 7 5 4 6 3 4 Ranks 8 4. 5 2. 5 6 1 2. 5
For example– Mann-Whitney mean sum BB 8 7 7 5 8 9 Ranks 10. 5 8 8 4. 5 10. 5 12 8. 9 53. 5 Amsterdam Rehabilitation Research Center | Reade Go. T 7 5 4 6 3 4 Ranks 8 4. 5 2. 5 6 1 2. 5 4. 1 24. 5
For example– Mann-Whitney BB mean sum Ranks 8. 9 53. 5 Go. T Ranks 4. 1 24. 5 H 0 : there is n significant difference in sum of ranks P < 0. 05 reject H 0 there is a significant difference P > 0. 05 decline H 0 there is no significant difference Amsterdam Rehabilitation Research Center | Reade
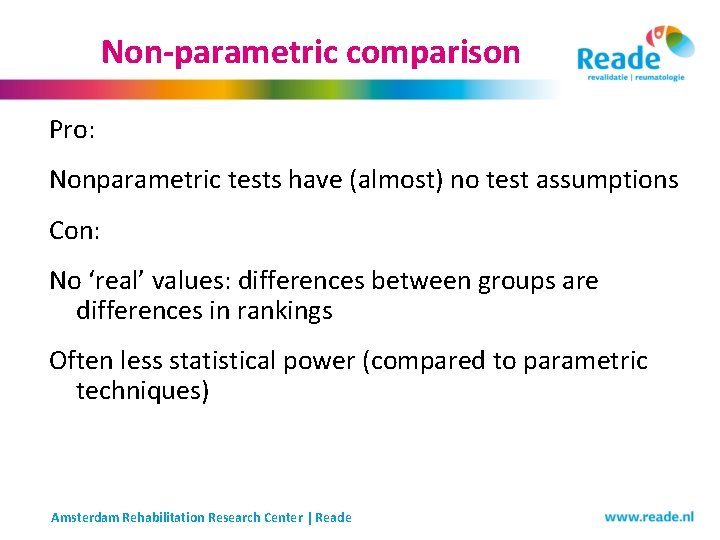
Non-parametric comparison Pro: Nonparametric tests have (almost) no test assumptions Con: No ‘real’ values: differences between groups are differences in rankings Often less statistical power (compared to parametric techniques) Amsterdam Rehabilitation Research Center | Reade
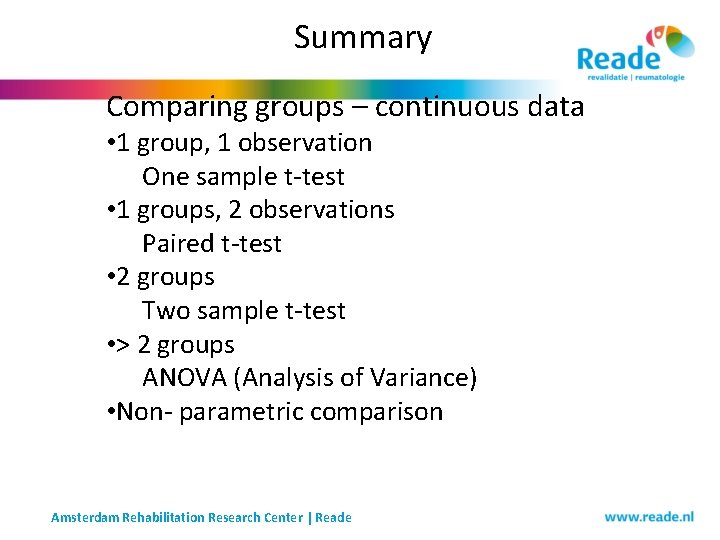
Summary Comparing groups – continuous data • 1 group, 1 observation One sample t-test • 1 groups, 2 observations Paired t-test • 2 groups Two sample t-test • > 2 groups ANOVA (Analysis of Variance) • Non- parametric comparison Amsterdam Rehabilitation Research Center | Reade
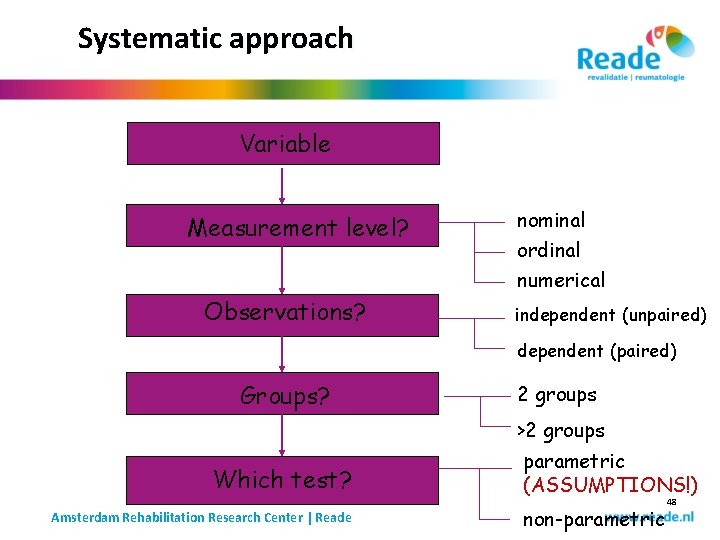
Systematic approach Variable Measurement level? nominal ordinal numerical Observations? independent (unpaired) dependent (paired) Groups? 2 groups >2 groups Which test? Amsterdam Rehabilitation Research Center | Reade parametric (ASSUMPTIONS!) non-parametric 48