Social Media Marketing Analytics Tamkang University Exploratory Factor
 1032 SMMA 06")
 週次 (Week) 日期 (Date) 內容 (Subject/Topics) 1 2015/02/27 和平紀念日補假(放假一天) 2 2015/03/06 社群網路行銷分析課程介紹")
 週次 (Week) 日期 (Date) 內容 (Subject/Topics) 10 2015/05/01 期中報告 (Midterm Presentation) 11")
 vs.")

 Source: Hair et al.")
 • Definition – Exploratory factor analysis (EFA) is an interdependence")
 • Examines the interrelationships among a large number of variables")
, Multivariate Data Analysis,")


 – is used to discover")


 Variable 1 Variable 2 Variable 3 Factor")

 Variable 1 Variable 2 Variable 3 Loyalty")
 (5: 1) (Zeithaml, Berry & Parasuraman, 1996) Say positive")
, Multivariate")
 Source: Hair et al.")
 Source: Hair et al. (2009), Multivariate")


. • The MSA")


, Multivariate Data Analysis,")


 • Varimax (simplify columns) • Equimax (combination)")


 Representing Factor Analysis In Other Analyses •")


, Multivariate Data Analysis,")

, 碁峰資訊, 2014 Source: http: //24 h. pchome. com. tw/books/prod/DJAV 0")
, 碁峰資訊, 2014 Source: http: //24 h. pchome. com. tw/books/prod/DJAV 0")
, 碁峰資訊, 2014 • 國內第一本全面介紹Smart. PLS操作、PLS-SEM結 構方程模式的實用書 • 國內第一本深入探討最新量表發展、中介和調節 變數的應用、Reflective(反映性)和 Formative(形")
, 碁峰資訊, 2014 • chapter 01 統計分析簡介與數量方法的基礎 • chapter 02 SPSS")
, 碁峰資訊, 2014 • • • chapter 11 單變量變異數分析 chapter 12")


- Slides: 75
Social Media Marketing Analytics Tamkang University 社群網路行銷分析 探索性因素分析 (Exploratory Factor Analysis) 1032 SMMA 06 TLMXJ 1 A (MIS EMBA) Fri 12, 13, 14 (19: 20 -22: 10) D 326 Min-Yuh Day 戴敏育 Assistant Professor 專任助理教授 Dept. of Information Management, Tamkang University 淡江大學 資訊管理學系 http: //mail. tku. edu. tw/myday/ 2015 -04 -24 1
課程大綱 (Syllabus) 週次 (Week) 日期 (Date) 內容 (Subject/Topics) 1 2015/02/27 和平紀念日補假(放假一天) 2 2015/03/06 社群網路行銷分析課程介紹 (Course Orientation for Social Media Marketing Analytics) 3 2015/03/13 社群網路行銷分析 (Social Media Marketing Analytics) 4 2015/03/20 社群網路行銷研究 (Social Media Marketing Research) 5 2015/03/27 測量構念 (Measuring the Construct) 6 2015/04/03 兒童節補假(放假一天) 7 2015/04/10 社群網路行銷個案分析 I (Case Study on Social Media Marketing I) 8 2015/04/17 測量與量表 (Measurement and Scaling) 9 2015/04/24 探索性因素分析 (Exploratory Factor Analysis) 2
課程大綱 (Syllabus) 週次 (Week) 日期 (Date) 內容 (Subject/Topics) 10 2015/05/01 期中報告 (Midterm Presentation) 11 2015/05/08 確認性因素分析 (Confirmatory Factor Analysis) 12 2015/05/15 社會網路分析 (Social Network Analysis) 13 2015/05/22 社群網路行銷個案分析 II (Case Study on Social Media Marketing II) 14 2015/05/29 社群運算與大數據分析 (Social Computing and Big Data Analytics) 15 2015/06/05 社群網路情感分析 (Sentiment Analysis on Social Media) 16 2015/06/12 期末報告 I (Term Project Presentation I) 17 2015/06/19 端午節補假 (放假一天) 18 2015/06/26 期末報告 II (Term Project Presentation II) 3
Outline • Seven stages of applying factor analysis • Exploratory Factor Analysis (EFA) vs. Confirmatory Factor Analysis (CFA) • Identify the differences between component analysis and common factor analysis models • How to determine the number of factors to extract • How to name a factor Source: Hair et al. (2009), Multivariate Data Analysis, 7 th Edition, Prentice Hall 4
Joseph F. Hair, William C. Black, Barry J. Babin, Rolph E. Anderson, Multivariate Data Analysis, 7 th Edition, Prentice Hall, 2009 (Hair et al. , 2009) Source: Hair et al. (2009), Multivariate Data Analysis, 7 th Edition, Prentice Hall 5
Chapter 3 Exploratory Factor Analysis (Hair et al. , 2009) Source: Hair et al. (2009), Multivariate Data Analysis, 7 th Edition, Prentice Hall 6
Exploratory Factor Analysis (EFA) • Definition – Exploratory factor analysis (EFA) is an interdependence technique whose primary purpose is to define the underlying structure among the variables in the analysis. Source: Hair et al. (2009), Multivariate Data Analysis, 7 th Edition, Prentice Hall 7
Exploratory Factor Analysis (EFA) • Examines the interrelationships among a large number of variables and then attempts to explain them in terms of their common underlying dimensions. • These common underlying dimensions are referred to as factors. • A summarization and data reduction technique that does not have independent and dependent variables, but is an interdependence technique in which all variables are considered simultaneously. Source: Hair et al. (2009), Multivariate Data Analysis, 7 th Edition, Prentice Hall 8
Correlation Matrix for Store Image Elements Source: Hair et al. (2009), Multivariate Data Analysis, 7 th Edition, Prentice Hall 9
Correlation Matrix of Variables After Grouping Using Factor Analysis Shaded areas represent variables likely to be grouped together by factor analysis. Source: Hair et al. (2009), Multivariate Data Analysis, 7 th Edition, Prentice Hall 10
Application of Factor Analysis to a Fast-Food Restaurant Variables Factors Waiting Time Cleanliness Service Quality Friendly Employees Taste Temperature Food Quality Freshness Source: Hair et al. (2009), Multivariate Data Analysis, 7 th Edition, Prentice Hall 11
Factor Analysis Decision Process • • Stage 1: Stage 2: Stage 3: Stage 4: Stage 5: Stage 6: Stage 7: Objectives of Factor Analysis Designing a Factor Analysis Assumptions in Factor Analysis Deriving Factors and Assessing Overall Fit Interpreting the Factors Validation of Factor Analysis Additional uses of Factor Analysis Results Source: Hair et al. (2009), Multivariate Data Analysis, 7 th Edition, Prentice Hall 12
Factor Analysis Decision Process 1. Objectives of Factor Analysis 2. Designing a Factor Analysis 3. Assumptions in Factor Analysis 4. Deriving Factors and Assessing Overall Fit 5. Interpreting the Factors 6. Validation of Factor Analysis 7. Additional uses of Factor Analysis Results Source: Hair et al. (2009), Multivariate Data Analysis, 7 th Edition, Prentice Hall 13
Stage 1: Objectives of Factor Analysis 1. 2. 3. 4. Is the objective exploratory or confirmatory? Specify the unit of analysis. Data summarization and/or reduction? Using factor analysis with other techniques. Source: Hair et al. (2009), Multivariate Data Analysis, 7 th Edition, Prentice Hall 14
Factor Analysis Outcomes • Data summarization – derives underlying dimensions that, when interpreted and understood, describe the data in a much smaller number of concepts than the original individual variables. • Data reduction – extends the process of data summarization by deriving an empirical value (factor score or summated scale) for each dimension (factor) and then substituting this value for the original values. Source: Hair et al. (2009), Multivariate Data Analysis, 7 th Edition, Prentice Hall 15
Types of Factor Analysis • Exploratory Factor Analysis (EFA) – is used to discover the factor structure of a construct and examine its reliability. It is data driven. • Confirmatory Factor Analysis (CFA) – is used to confirm the fit of the hypothesized factor structure to the observed (sample) data. It is theory driven. Source: Hair et al. (2009), Multivariate Data Analysis, 7 th Edition, Prentice Hall 16
Factor Analysis Decision Process 1. Objectives of Factor Analysis 2. Designing a Factor Analysis 3. Assumptions in Factor Analysis 4. Deriving Factors and Assessing Overall Fit 5. Interpreting the Factors 6. Validation of Factor Analysis 7. Additional uses of Factor Analysis Results Source: Hair et al. (2009), Multivariate Data Analysis, 7 th Edition, Prentice Hall 17
Stage 2: Designing a Factor Analysis • Three Basic Decisions: 1. Calculation of input data – R vs. Q analysis. 2. Design of study in terms of number of variables, measurement properties of variables, and the type of variables. 3. Sample size necessary. Source: Hair et al. (2009), Multivariate Data Analysis, 7 th Edition, Prentice Hall 18
Rules of Thumb 3– 1 Factor Analysis Design • Factor analysis is performed most often only on metric variables, although specialized methods exist for the use of dummy variables. A small number of “dummy variables” can be included in a set of metric variables that are factor analyzed. • If a study is being designed to reveal factor structure, strive to have at least five variables for each proposed factor. • For sample size: – the sample must have more observations than variables. – the minimum absolute sample size should be 50 observations. • Maximize the number of observations per variable, with a minimum of five and hopefully at least ten observations per variable. Source: Hair et al. (2009), Multivariate Data Analysis, 7 th Edition, Prentice Hall 19
5 Variables : 1 Factor (5: 1) Variable 1 Variable 2 Variable 3 Factor 1 Variable 4 Variable 5 Source: Hair et al. (2009), Multivariate Data Analysis, 7 th Edition, Prentice Hall 20
Customer Perceived Value, Customer Satisfaction, and Loyalty Customer Perceived Performance Customer Perceived Value Customer Satisfaction Customer Loyalty Customer Expectations Source: Philip Kotler & Kevin Lane Keller, Marketing Management, 14 th ed. , Pearson, 2012 21
5 Variables : 1 Factor (5: 1) Variable 1 Variable 2 Variable 3 Loyalty Variable 4 Variable 5 Source: Hair et al. (2009), Multivariate Data Analysis, 7 th Edition, Prentice Hall 22
Measuring Loyalty 5 Variables (Items) (5: 1) (Zeithaml, Berry & Parasuraman, 1996) Say positive things about XYZ to other people. Recommend XYZ to someone who seeks your advice. Encourage friends and relatives to do business with XYZ. Loyalty Consider XYZ your first choice to buy services. Do more business with XYZ in the next few years. Source: Valarie A. Zeithaml, Leonard L. Berry and A. Parasuraman, “The Behavioral Consequences of Service Quality, ” Journal of Marketing, Vol. 60, No. 2 (Apr. , 1996), pp. 31 -46 23
minimum absolute sample size should be 50 observations Source: Hair et al. (2009), Multivariate Data Analysis, 7 th Edition, Prentice Hall 24
Sample Size: at least ten observations per variable (1: 10) Source: Hair et al. (2009), Multivariate Data Analysis, 7 th Edition, Prentice Hall 25
Sample Size: 25 variables * 10 observations (25*10=250) Source: Hair et al. (2009), Multivariate Data Analysis, 7 th Edition, Prentice Hall 26
Factor Analysis Decision Process 1. Objectives of Factor Analysis 2. Designing a Factor Analysis 3. Assumptions in Factor Analysis 4. Deriving Factors and Assessing Overall Fit 5. Interpreting the Factors 6. Validation of Factor Analysis 7. Additional uses of Factor Analysis Results Source: Hair et al. (2009), Multivariate Data Analysis, 7 th Edition, Prentice Hall 27
Stage 3: Assumptions in Factor Analysis • Three Basic Decisions 1. Calculation of input data – R vs. Q analysis. 2. Design of study in terms of number of variables, measurement properties of variables, and the type of variables. 3. Sample size required. Source: Hair et al. (2009), Multivariate Data Analysis, 7 th Edition, Prentice Hall 28
Assumptions • Multicollinearity – Assessed using MSA (measure of sampling adequacy). • The MSA is measured by the Kaiser-Meyer-Olkin (KMO) statistic. As a measure of sampling adequacy, the KMO predicts if data are likely to factor well based on correlation and partial correlation. KMO can be used to identify which variables to drop from the factor analysis because they lack multicollinearity. • There is a KMO statistic for each individual variable, and their sum is the KMO overall statistic. KMO varies from 0 to 1. 0. Overall KMO should be. 50 or higher to proceed with factor analysis. If it is not, remove the variable with the lowest individual KMO statistic value one at a time until KMO overall rises above. 50, and each individual variable KMO is above. 50. • Homogeneity of sample factor solutions Source: Hair et al. (2009), Multivariate Data Analysis, 7 th Edition, Prentice Hall 29
Rules of Thumb 3– 2 Testing Assumptions of Factor Analysis • There must be a strong conceptual foundation to support the assumption that a structure does exist before the factor analysis is performed. • A statistically significant Bartlett’s test of sphericity (sig. <. 05) indicates that sufficient correlations exist among the variables to proceed. • Measure of Sampling Adequacy (MSA) values must exceed. 50 for both the overall test and each individual variable. Variables with values less than. 50 should be omitted from the factor analysis one at a time, with the smallest one being omitted each time. Source: Hair et al. (2009), Multivariate Data Analysis, 7 th Edition, Prentice Hall 30
Factor Analysis Decision Process 1. Objectives of Factor Analysis 2. Designing a Factor Analysis 3. Assumptions in Factor Analysis 4. Deriving Factors and Assessing Overall Fit 5. Interpreting the Factors 6. Validation of Factor Analysis 7. Additional uses of Factor Analysis Results Source: Hair et al. (2009), Multivariate Data Analysis, 7 th Edition, Prentice Hall 31
Stage 4: Deriving Factors and Assessing Overall Fit • Selecting the factor extraction method – common vs. component analysis. • Determining the number of factors to represent the data. Source: Hair et al. (2009), Multivariate Data Analysis, 7 th Edition, Prentice Hall 32
Extraction Decisions • Which method? – Principal Components Analysis – Common Factor Analysis • How to rotate? – Orthogonal or Oblique rotation Source: Hair et al. (2009), Multivariate Data Analysis, 7 th Edition, Prentice Hall 33
Extraction Method Determines the Types of Variance Carried into the Factor Matrix Diagonal Value Variance Unity (1) Communality Total Variance Common Specific and Error Variance extracted Variance not used Source: Hair et al. (2009), Multivariate Data Analysis, 7 th Edition, Prentice Hall 34
Principal Components vs. Common? • Two Criteria – Objectives of the factor analysis. – Amount of prior knowledge about the variance in the variables. Source: Hair et al. (2009), Multivariate Data Analysis, 7 th Edition, Prentice Hall 35
Number of Factors? • • A Priori Criterion Latent Root Criterion Percentage of Variance Scree Test Criterion Source: Hair et al. (2009), Multivariate Data Analysis, 7 th Edition, Prentice Hall 36
Eigenvalue Plot for Scree Test Criterion Source: Hair et al. (2009), Multivariate Data Analysis, 7 th Edition, Prentice Hall 37
Rules of Thumb 3– 3 Choosing Factor Models and Number of Factors • • • Although both component and common factor analysis models yield similar results in common research settings (30 or more variables or communalities of. 60 for most variables): – the component analysis model is most appropriate when data reduction is paramount. – the common factor model is best in well-specified theoretical applications. Any decision on the number of factors to be retained should be based on several considerations: – use of several stopping criteria to determine the initial number of factors to retain. – Factors With Eigenvalues greater than 1. 0. – A pre-determined number of factors based on research objectives and/or prior research. – Enough factors to meet a specified percentage of variance explained, usually 60% or higher. – Factors shown by the scree test to have substantial amounts of common variance (i. e. , factors before inflection point). – More factors when there is heterogeneity among sample subgroups. Consideration of several alternative solutions (one more and one less factor than the initial solution) to ensure the best structure is identified. Source: Hair et al. (2009), Multivariate Data Analysis, 7 th Edition, Prentice Hall 38
Processes of Factor Interpretation • • Estimate the Factor Matrix Factor Rotation Factor Interpretation Respecification of factor model, if needed, may involve. . . – Deletion of variables from analysis – Desire to use a different rotational approach – Need to extract a different number of factors – Desire to change method of extraction Source: Hair et al. (2009), Multivariate Data Analysis, 7 th Edition, Prentice Hall 39
Rotation of Factors • Factor rotation – the reference axes of the factors are turned about the origin until some other position has been reached. Since unrotated factor solutions extract factors based on how much variance they account for, with each subsequent factor accounting for less variance. The ultimate effect of rotating the factor matrix is to redistribute the variance from earlier factors to later ones to achieve a simpler, theoretically more meaningful factor pattern. Source: Hair et al. (2009), Multivariate Data Analysis, 7 th Edition, Prentice Hall 40
Two Rotational Approaches 1. Orthogonal – axes are maintained at 90 degrees. 2. Oblique – axes are not maintained at 90 degrees. Source: Hair et al. (2009), Multivariate Data Analysis, 7 th Edition, Prentice Hall 41
Orthogonal Factor Rotation Unrotated Factor II +1. 0 Rotated Factor II V 1 V 2 +. 50 -1. 0 -. 50 0 Unrotated Factor I +. 50 +1. 0 V 3 V 4 -. 50 V 5 Rotated Factor I -1. 0 Source: Hair et al. (2009), Multivariate Data Analysis, 7 th Edition, Prentice Hall 42
Oblique Factor Rotation Unrotated Factor II +1. 0 Orthogonal Rotation: Factor II Oblique Rotation: Factor II V 1 V 2 +. 50 -1. 0 -. 50 0 Unrotated Factor I +. 50 +1. 0 V 3 V 4 -. 50 V 5 Oblique Rotation: Factor I Orthogonal Rotation: Factor I -1. 0 Source: Hair et al. (2009), Multivariate Data Analysis, 7 th Edition, Prentice Hall 43
Orthogonal Rotation Methods • Quartimax (simplify rows) • Varimax (simplify columns) • Equimax (combination) Source: Hair et al. (2009), Multivariate Data Analysis, 7 th Edition, Prentice Hall 44
Rules of Thumb 3– 4 Choosing Factor Rotation Methods • Orthogonal rotation methods – are the most widely used rotational methods. – are The preferred method when the research goal is data reduction to either a smaller number of variables or a set of uncorrelated measures for subsequent use in other multivariate techniques. • Oblique rotation methods – best suited to the goal of obtaining several theoretically meaningful factors or constructs because, realistically, very few constructs in the “real world” are uncorrelated Source: Hair et al. (2009), Multivariate Data Analysis, 7 th Edition, Prentice Hall 45
Which Factor Loadings Are Significant? • Customary Criteria = Practical Significance. • Sample Size & Statistical Significance. • Number of Factors ( = >) and/or Variables ( = <). Source: Hair et al. (2009), Multivariate Data Analysis, 7 th Edition, Prentice Hall 46
Guidelines for Identifying Significant Factor Loadings Based on Sample Size Factor Loading . 30. 35. 40. 45. 50. 55. 60. 65. 70. 75 Sample Size Needed for Significance* 350 200 150 120 100 85 70 60 50 *Significance is based on a. 05 significance level (a), a power level of 80 percent, and standard errors assumed to be twice those of conventional correlation coefficients. Source: Hair et al. (2009), Multivariate Data Analysis, 7 th Edition, Prentice Hall 47
Rules of Thumb 3– 5 Assessing Factor Loadings • While factor loadings of +. 30 to +. 40 are minimally acceptable, values greater than +. 50 are considered necessary for practical significance. • To be considered significant: – A smaller loading is needed given either a larger sample size, or a larger number of variables being analyzed. – A larger loading is needed given a factor solution with a larger number of factors, especially in evaluating the loadings on later factors. • Statistical tests of significance for factor loadings are generally very conservative and should be considered only as starting points needed for including a variable for further consideration. Source: Hair et al. (2009), Multivariate Data Analysis, 7 th Edition, Prentice Hall 48
Factor Analysis Decision Process 1. Objectives of Factor Analysis 2. Designing a Factor Analysis 3. Assumptions in Factor Analysis 4. Deriving Factors and Assessing Overall Fit 5. Interpreting the Factors 6. Validation of Factor Analysis 7. Additional uses of Factor Analysis Results Source: Hair et al. (2009), Multivariate Data Analysis, 7 th Edition, Prentice Hall 49
Stage 5: Interpreting the Factors • Selecting the factor extraction method – common vs. component analysis. • Determining the number of factors to represent the data. Source: Hair et al. (2009), Multivariate Data Analysis, 7 th Edition, Prentice Hall 50
Interpreting a Factor Matrix: 1. Examine the factor matrix of loadings. 2. Identify the highest loading across all factors for each variable. 3. Assess communalities of the variables. 4. Label the factors. Source: Hair et al. (2009), Multivariate Data Analysis, 7 th Edition, Prentice Hall 51
Rules of Thumb 3– 6 Interpreting The Factors • An optimal structure exists when all variables have high loadings only on a single factor. • Variables that cross-load (load highly on two or more factors) are usually deleted unless theoretically justified or the objective is strictly data reduction. • Variables should generally have communalities of greater than. 50 to be retained in the analysis. • Respecification of a factor analysis can include options such as: – deleting a variable(s), – changing rotation methods, and/or – increasing or decreasing the number of factors. Source: Hair et al. (2009), Multivariate Data Analysis, 7 th Edition, Prentice Hall 52
Factor Analysis Decision Process 1. Objectives of Factor Analysis 2. Designing a Factor Analysis 3. Assumptions in Factor Analysis 4. Deriving Factors and Assessing Overall Fit 5. Interpreting the Factors 6. Validation of Factor Analysis 7. Additional uses of Factor Analysis Results Source: Hair et al. (2009), Multivariate Data Analysis, 7 th Edition, Prentice Hall 53
Stage 6: Validation of Factor Analysis • Confirmatory Perspective. • Assessing Factor Structure Stability. • Detecting Influential Observations. Source: Hair et al. (2009), Multivariate Data Analysis, 7 th Edition, Prentice Hall 54
Factor Analysis Decision Process 1. Objectives of Factor Analysis 2. Designing a Factor Analysis 3. Assumptions in Factor Analysis 4. Deriving Factors and Assessing Overall Fit 5. Interpreting the Factors 6. Validation of Factor Analysis 7. Additional uses of Factor Analysis Results Source: Hair et al. (2009), Multivariate Data Analysis, 7 th Edition, Prentice Hall 55
Stage 7: Additional Uses of Factor Analysis Results • Selecting Surrogate Variables • Creating Summated Scales • Computing Factor Scores Source: Hair et al. (2009), Multivariate Data Analysis, 7 th Edition, Prentice Hall 56
Rules of Thumb 3– 7 Summated Scales • A summated scale is only as good as the items used to represent the construct. While it may pass all empirical tests, it is useless without theoretical justification. • Never create a summated scale without first assessing its unidimensionality with exploratory or confirmatory factor analysis. • Once a scale is deemed unidimensional, its reliability score, as measured by Cronbach’s alpha: – should exceed a threshold of. 70, although a. 60 level can be used in exploratory research. – the threshold should be raised as the number of items increases, especially as the number of items approaches 10 or more. • With reliability established, validity should be assessed in terms of: – convergent validity = scale correlates with other like scales. – discriminant validity = scale is sufficiently different from other related scales. – nomological validity = scale “predicts” as theoretically suggested. Source: Hair et al. (2009), Multivariate Data Analysis, 7 th Edition, Prentice Hall 57
Rules of Thumb 3– 8 Representing Factor Analysis In Other Analyses • The single surrogate variable: – Advantages: simple to administer and interpret. – Disadvantages: • does not represent all “facets” of a factor • prone to measurement error. • Factor scores: – Advantages: • represents all variables loading on the factor, • best method for complete data reduction. • Are by default orthogonal and can avoid complications caused by multicollinearity. – Disadvantages: • interpretation more difficult since all variables contribute through loadings • Difficult to replicate across studies. Source: Hair et al. (2009), Multivariate Data Analysis, 7 th Edition, Prentice Hall 58
Rules of Thumb 3– 8 (cont. ) Representing Factor Analysis In Other Analyses • Summated scales: – Advantages: • compromise between the surrogate variable and factor score options. • reduces measurement error. • represents multiple facets of a concept. • easily replicated across studies. – Disadvantages: • includes only the variables that load highly on the factor and excludes those having little or marginal impact. • not necessarily orthogonal. • Require extensive analysis of reliability and validity issues. Source: Hair et al. (2009), Multivariate Data Analysis, 7 th Edition, Prentice Hall 59
Description of HBAT Primary Database Variables Variable Description Data Warehouse Classification Variables X 1 X 2 X 3 X 4 X 5 Variable Type Customer Type Industry Type Firm Size Region Distribution System nonmetric nonmetric Performance Perceptions Variables X 6 X 7 X 8 X 9 X 10 X 11 X 12 X 13 X 14 X 15 X 16 X 17 X 18 Product Quality E-Commerce Activities/Website Technical Support Complaint Resolution Advertising Product Line Salesforce Image Competitive Pricing Warranty & Claims New Products Ordering & Billing Price Flexibility Delivery Speed metric metric metric metric Outcome/Relationship Measures X 19 X 20 X 21 X 22 X 23 Satisfaction Likelihood of Recommendation Likelihood of Future Purchase Current Purchase/Usage Level Consider Strategic Alliance/Partnership in Future Source: Hair et al. (2009), Multivariate Data Analysis, 7 th Edition, Prentice Hall metric nonmetric 60
Rotated Component Matrix “Reduced Set” of HBAT Perceptions Variables 1 Component 2 3 Communality 4 X 9 – Complaint Resolution X 18 – Delivery Speed X 16 – Order & Billing X 12 – Salesforce Image X 7 – E-Commerce Activities X 10 – Advertising X 8 – Technical Support X 14 – Warranty & Claims X 6 – Product Quality X 13 – Competitive Pricing . 933. 931. 886 Sum of Squares Percentage of Trace 2. 589 2. 216 1. 846 1. 406 8. 057 25. 893 22. 161 18. 457 14. 061 80. 572 . 898. 868. 743. 940. 933. 892 -. 730 . 890. 894. 806. 860. 780. 585. 894. 891. 798. 661 Extraction Method: Principal Component Analysis. Rotation Method: Varimax. Source: Hair et al. (2009), Multivariate Data Analysis, 7 th Edition, Prentice Hall 61
Scree Test for HBAT Component Analysis Source: Hair et al. (2009), Multivariate Data Analysis, 7 th Edition, Prentice Hall 62
Summary 1. What are the major uses of factor analysis? 2. What is the difference between component analysis and common factor analysis? 3. Is rotation of factors necessary? 4. How do you decide how many factors to extract? 5. What is a significant factor loading? 6. How and why do you name a factor? 7. Should you use factor scores or summated ratings in follow-up analyses? Source: Hair et al. (2009), Multivariate Data Analysis, 7 th Edition, Prentice Hall 63
蕭文龍, 統計分析入門與應用:SPSS中文版+PLS-SEM (Smart. PLS), 碁峰資訊, 2014 Source: http: //24 h. pchome. com. tw/books/prod/DJAV 0 S-A 82328045 64
蕭文龍, 統計分析入門與應用:SPSS中文版+PLS-SEM (Smart. PLS), 碁峰資訊, 2014 Source: http: //24 h. pchome. com. tw/books/prod/DJAV 0 S-A 82328045 65
蕭文龍, 統計分析入門與應用:SPSS中文版+PLS-SEM (Smart. PLS), 碁峰資訊, 2014 • 國內第一本全面介紹Smart. PLS操作、PLS-SEM結 構方程模式的實用書 • 國內第一本深入探討最新量表發展、中介和調節 變數的應用、Reflective(反映性)和 Formative(形 成性)指標的發展和模式的指定 • 本書適合作為統計分析和多變量分析的教科書, 也是Hair, Black, Babin, and Anderson 所撰寫的 Multivariate data analysis Multivariate Data Analysis多變量分析的最佳輔助參考書籍,更是 Hair, Hult, Ringle, and Sarstedt所撰寫的A Primer on Partial Least Squares Structural Equation Modeling(PLS-SEM)的最優輔助參考書籍。 Source: http: //24 h. pchome. com. tw/books/prod/DJAV 0 S-A 82328045 66
蕭文龍, 統計分析入門與應用:SPSS中文版+PLS-SEM (Smart. PLS), 碁峰資訊, 2014 • chapter 01 統計分析簡介與數量方法的基礎 • chapter 02 SPSS 的基本操作 • chapter 03 量表的發展,信度和效度 • chapter 04 檢視資料與敘述性統計 • chapter 05 統相關分析(Correlation Analysis) • chapter 06 卡方檢定 • chapter 07 平均數比較(t 檢定) • chapter 08 因素分析 • chapter 09 迴歸分析 • chapter 10 區別分析與邏輯迴歸 Source: http: //24 h. pchome. com. tw/books/prod/DJAV 0 S-A 82328045 68
蕭文龍, 統計分析入門與應用:SPSS中文版+PLS-SEM (Smart. PLS), 碁峰資訊, 2014 • • • chapter 11 單變量變異數分析 chapter 12 多變量變異數分析 chapter 13 典型相關 chapter 14 聯合分析、多元尺度方法和集群分析 chapter 15 結構方程模式之 Partial Least Squares(PLS) 偏最小平 方 chapter 16 Smartpls 統計分析軟體介紹 chapter 17 PLS-SEM(Smart. PLS) 結構方程模式的學習範例 chapter 18 PLS-SEM 結構方程模式實例 chapter 19 反映性 Reflective 與形成性 Formative 模式 chapter 20 交互作用、中介和調節(干擾) chapter 21 研究流程、論文結構與發表於期刊的建議 Source: http: //24 h. pchome. com. tw/books/prod/DJAV 0 S-A 82328045 69
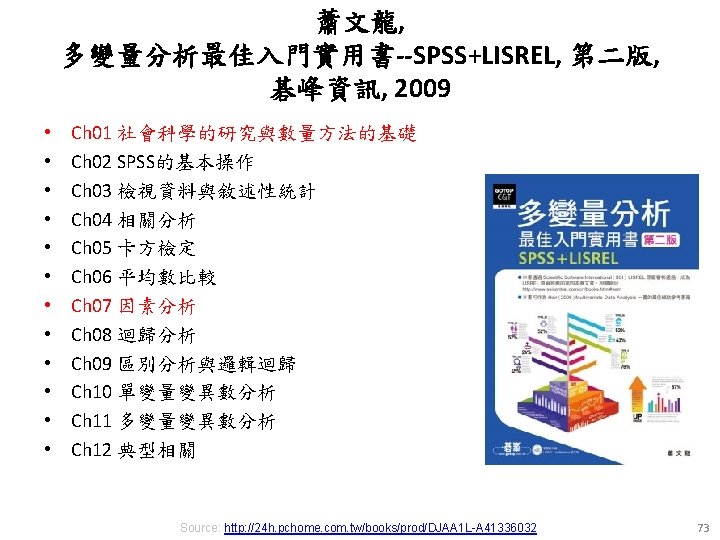
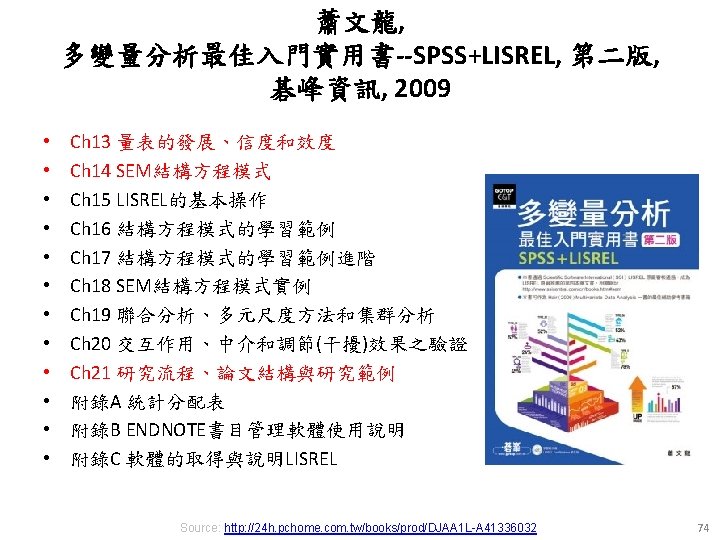
蕭文龍, 多變量分析最佳入門實用書--SPSS+LISREL, 第二版, 碁峰資訊, 2009 Source: http: //24 h. pchome. com. tw/books/prod/DJAA 1 L-A 41336032 70
蕭文龍, 多變量分析最佳入門實用書--SPSS+LISREL, 第二版, 碁峰資訊, 2009 Source: http: //24 h. pchome. com. tw/books/prod/DJAA 1 L-A 41336032 71
References • Joseph F. Hair, William C. Black, Barry J. Babin, Rolph E. Anderson (2009), Multivariate Data Analysis, 7 th Edition, Prentice Hall • Valarie A. Zeithaml, Leonard L. Berry and A. Parasuraman (1996), “The Behavioral Consequences of Service Quality, ” Journal of Marketing, Vol. 60, No. 2 (Apr. , 1996), pp. 31 -46 • 蕭文龍 (2014), 統計分析入門與應用:SPSS中文版+PLS-SEM (Smart. PLS), 碁峰資訊 • 蕭文龍 (2009), 多變量分析最佳入門實用書--SPSS+LISREL, 第 二版, 碁峰資訊 • 吳明隆 (2006), SPSS 統計應用學習實務:問卷分析與應用統 計, 三版, 知城數位科技 75