Introduction to Data Science Lecture 6 Exploratory Data


- Slides: 40
Introduction to Data Science Lecture 6 Exploratory Data Analysis CS 194 Spring 2014 Michael Franklin Dan Bruckner, Evan Sparks, Shivaram Venkataraman
Outline for this Evening • Class Lecture • Exploratory Data Analysis • Hypothesis Testing • Exercise – EDA and HT in Python (Evan: Tutorial and Lab) next week: we’ll play with “R” • Review of exercise • Time for Project Group Discussions
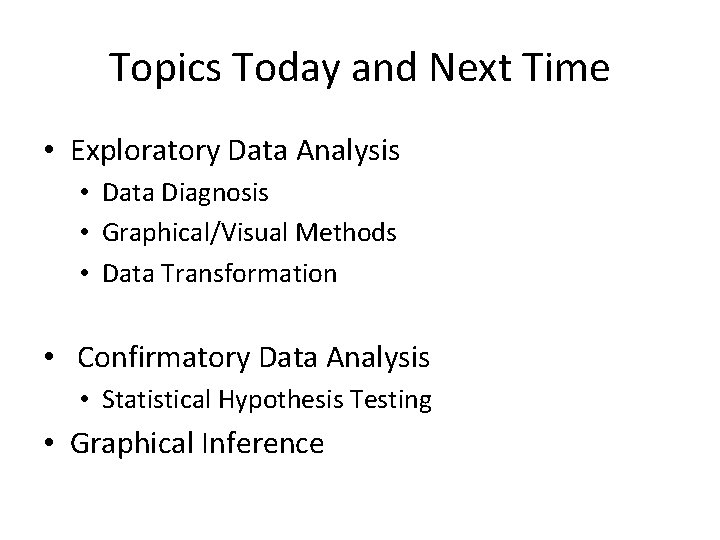
Topics Today and Next Time • Exploratory Data Analysis • Data Diagnosis • Graphical/Visual Methods • Data Transformation • Confirmatory Data Analysis • Statistical Hypothesis Testing • Graphical Inference
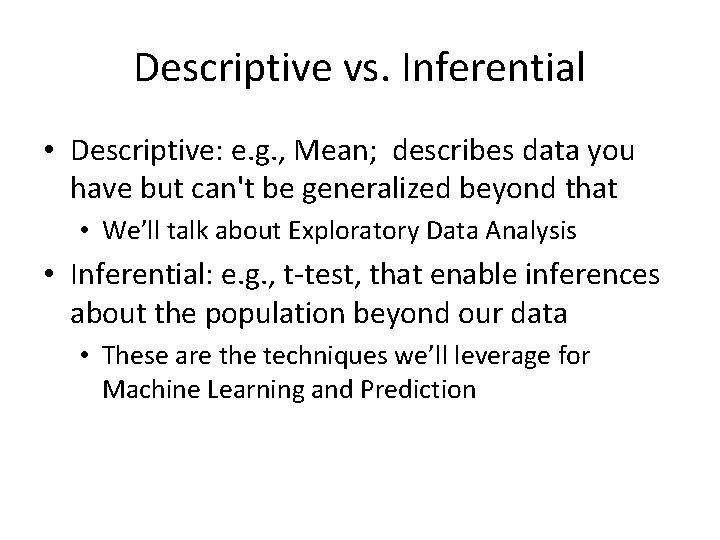
Descriptive vs. Inferential • Descriptive: e. g. , Mean; describes data you have but can't be generalized beyond that • We’ll talk about Exploratory Data Analysis • Inferential: e. g. , t-test, that enable inferences about the population beyond our data • These are the techniques we’ll leverage for Machine Learning and Prediction
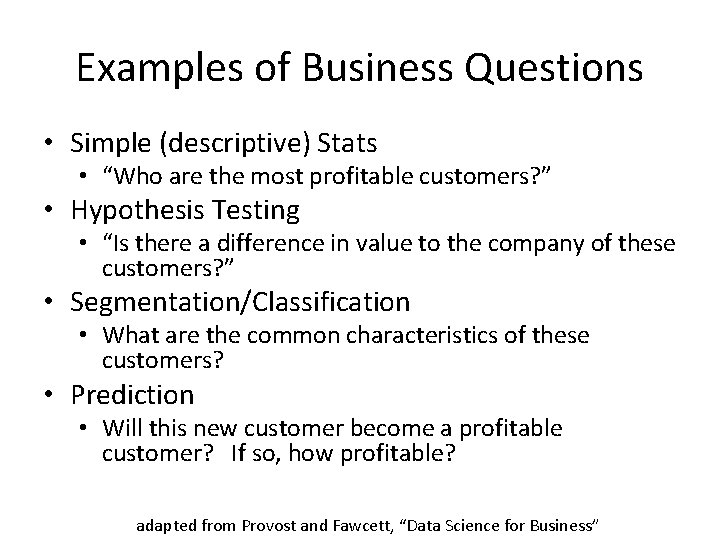
Examples of Business Questions • Simple (descriptive) Stats • “Who are the most profitable customers? ” • Hypothesis Testing • “Is there a difference in value to the company of these customers? ” • Segmentation/Classification • What are the common characteristics of these customers? • Prediction • Will this new customer become a profitable customer? If so, how profitable? adapted from Provost and Fawcett, “Data Science for Business”
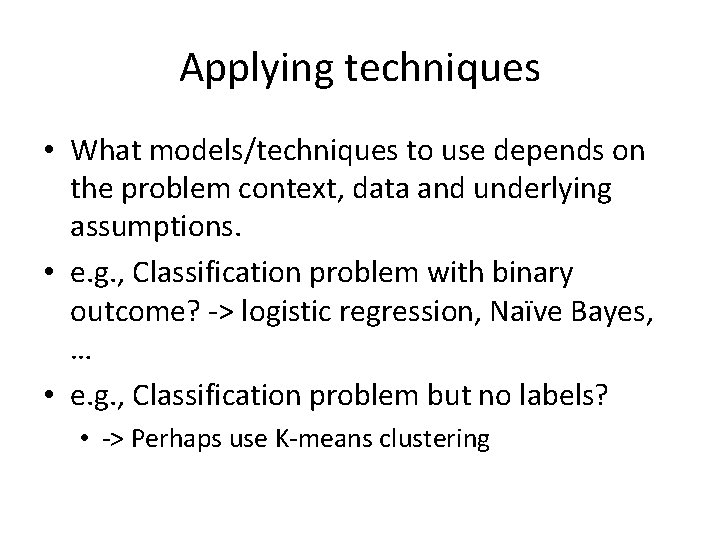
Applying techniques • What models/techniques to use depends on the problem context, data and underlying assumptions. • e. g. , Classification problem with binary outcome? -> logistic regression, Naïve Bayes, … • e. g. , Classification problem but no labels? • -> Perhaps use K-means clustering
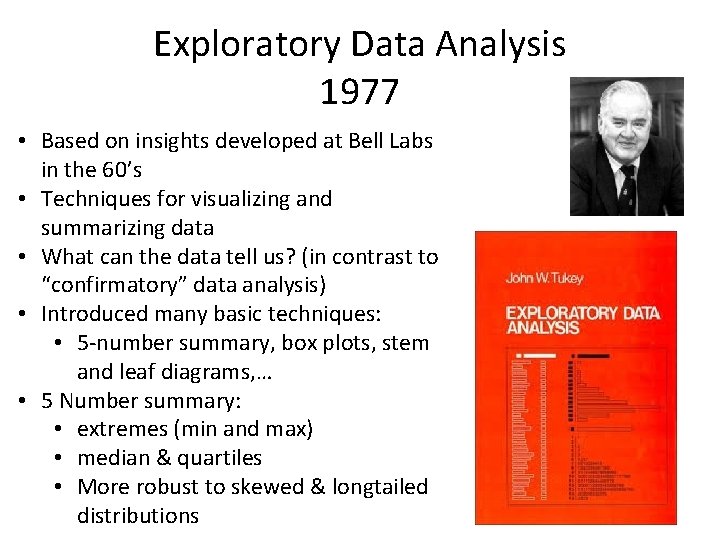
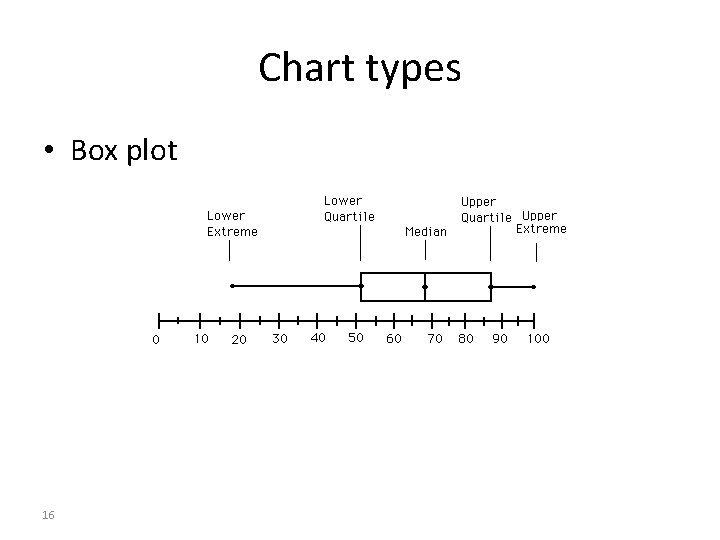
Exploratory Data Analysis 1977 • Based on insights developed at Bell Labs in the 60’s • Techniques for visualizing and summarizing data • What can the data tell us? (in contrast to “confirmatory” data analysis) • Introduced many basic techniques: • 5 -number summary, box plots, stem and leaf diagrams, … • 5 Number summary: • extremes (min and max) • median & quartiles • More robust to skewed & longtailed distributions
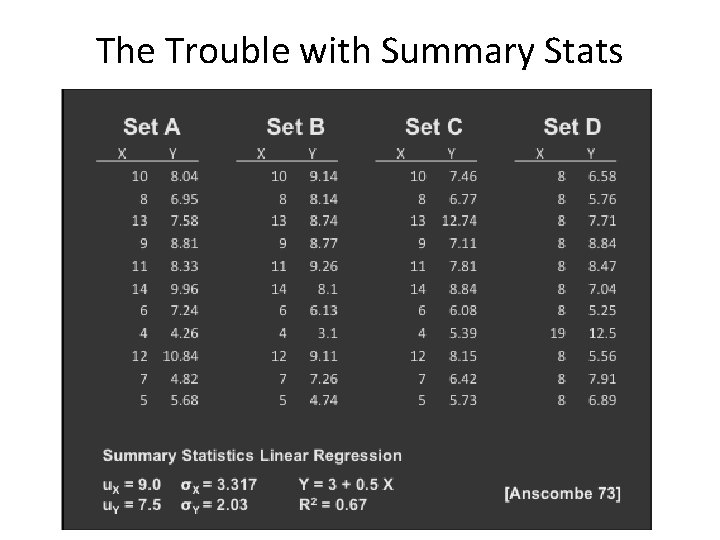
The Trouble with Summary Stats
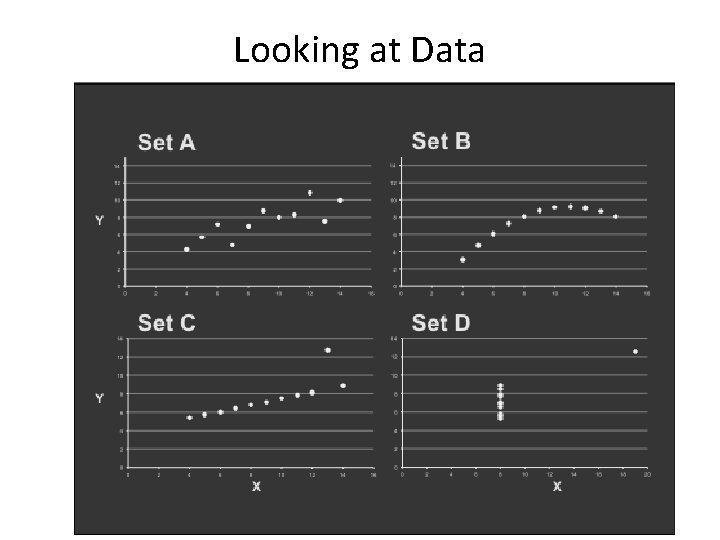
Looking at Data
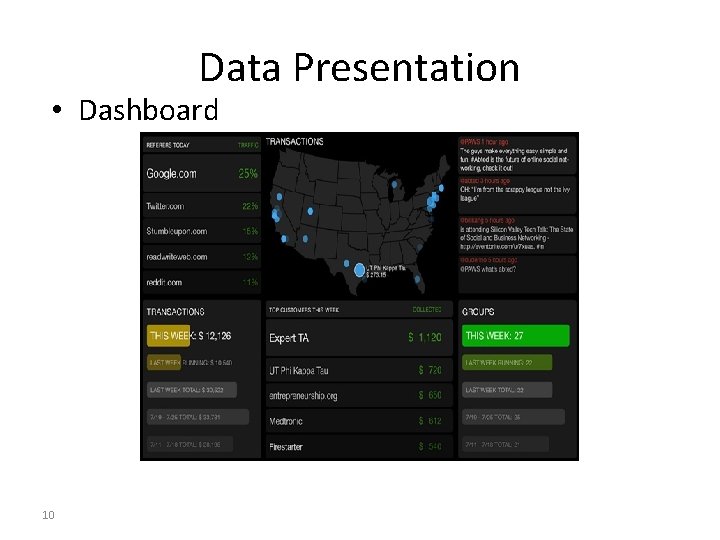
Data Presentation • Dashboard 10
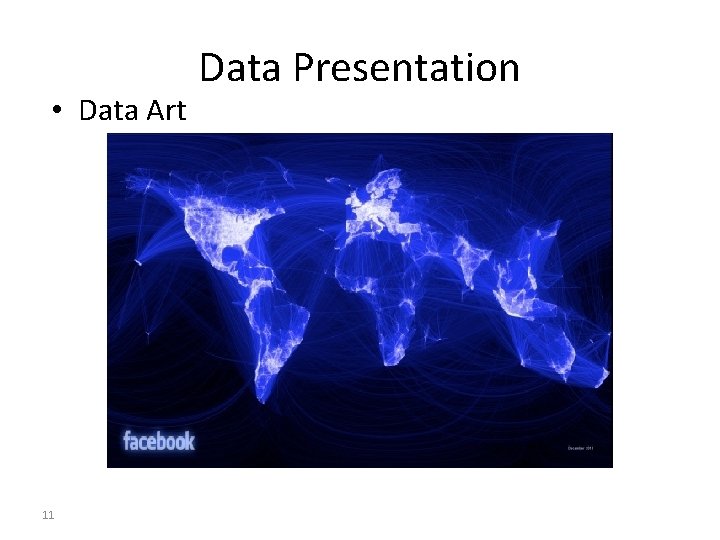
• Data Art 11 Data Presentation
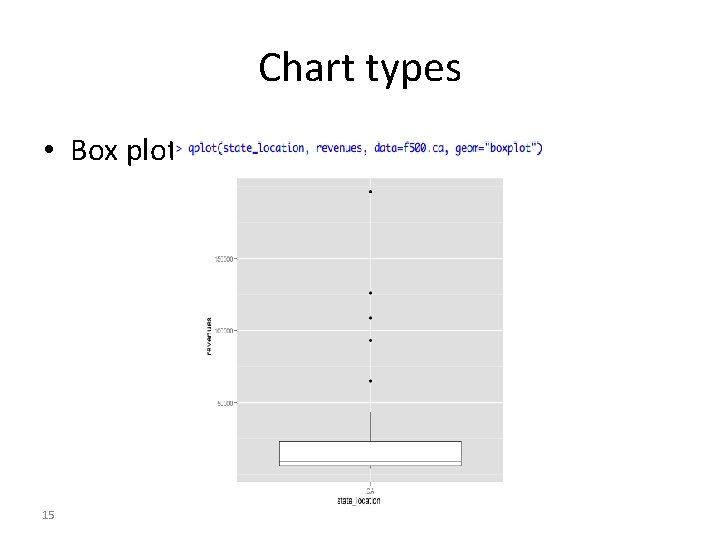
Chart types • Single variable • • • Dot plot Jitter plot Box plot Histogram Kernel density estimate Cumulative distribution function (note: examples using qplot library from R) 12 Chart examples from Jeff Hammerbacher’s 2012 CS 194 class
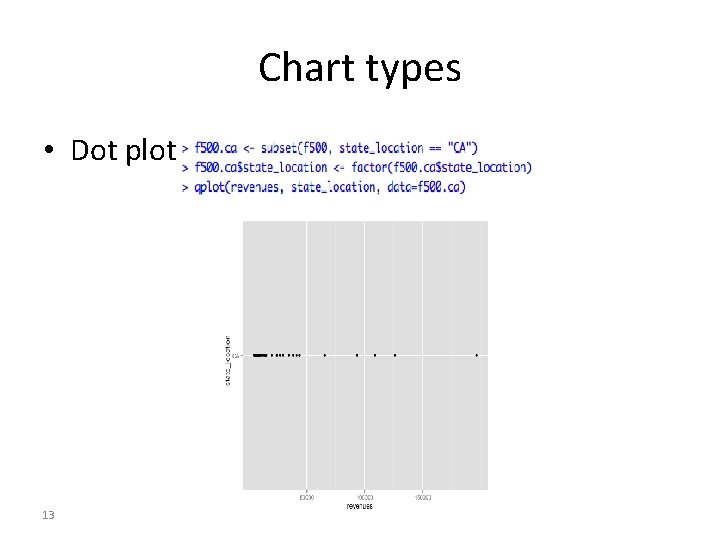
Chart types • Dot plot 13
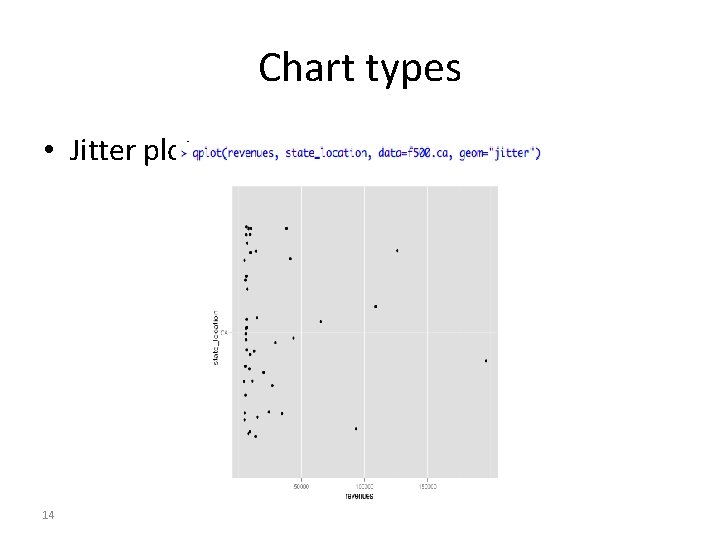
Chart types • Jitter plot 14
Chart types • Box plot 15
Chart types • Box plot 16
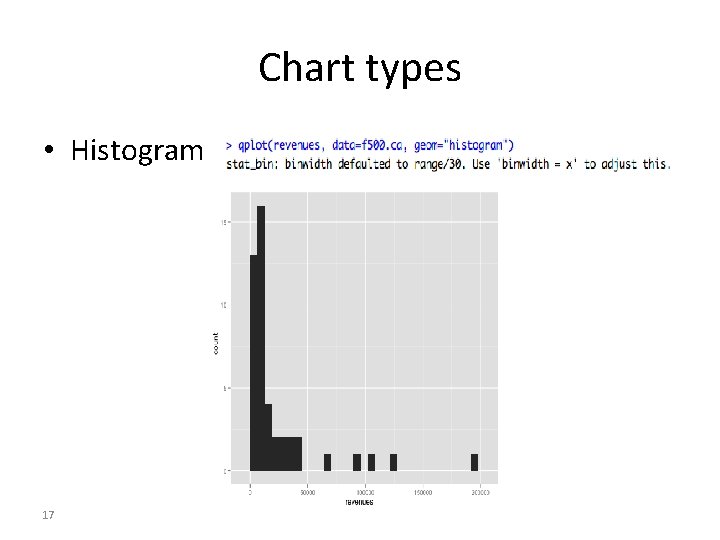
Chart types • Histogram 17
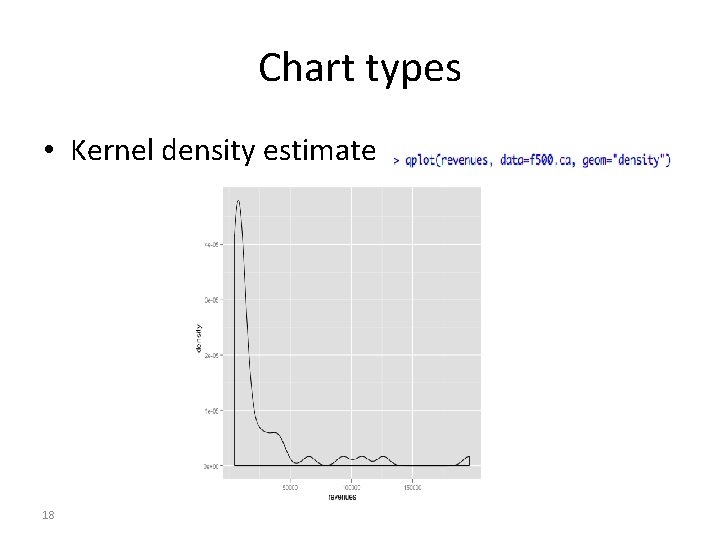
Chart types • Kernel density estimate 18
Chart types • Histogram and Kernel Density Estimates • Histogram • Proper selection of bin width is important • Outliers should be discarded • KDE • Kernel function • Box, Epanechnikov, Gaussian • Kernel bandwidth 19
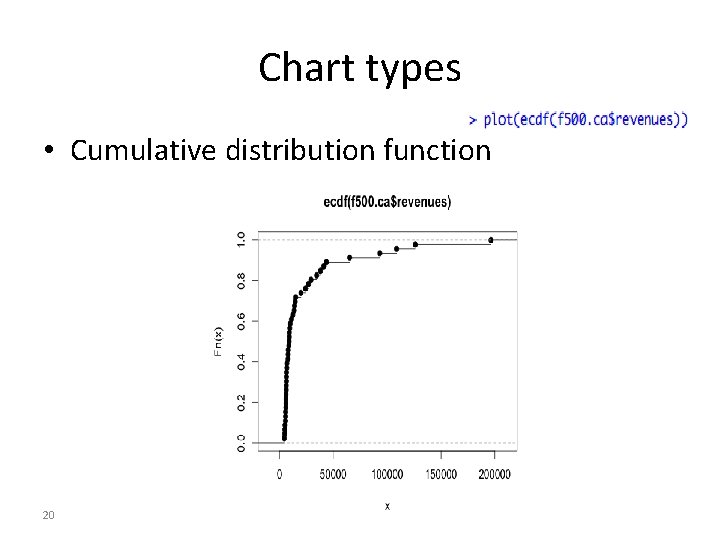
Chart types • Cumulative distribution function 20
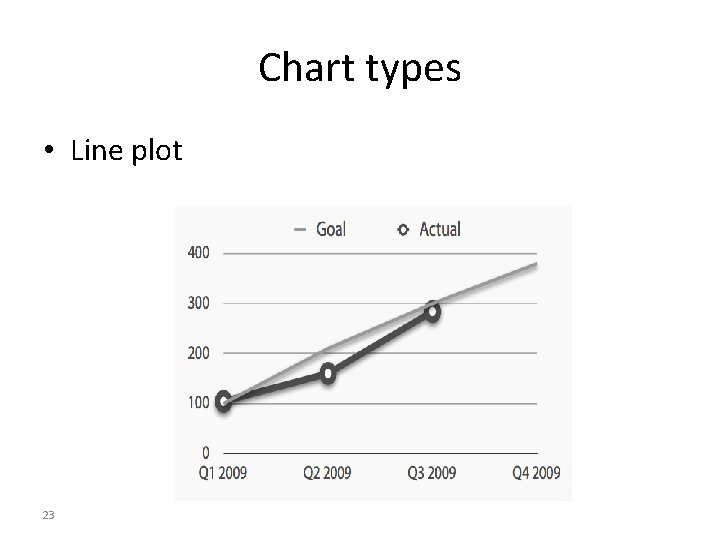
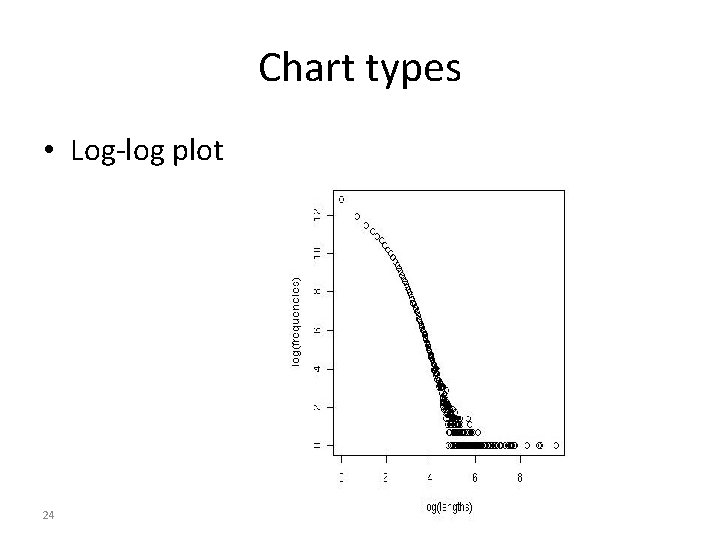
Chart types • Two variables • Scatter plot • Line plot • Log-log plot • Cut-and-stack plot • Pairs plot 21
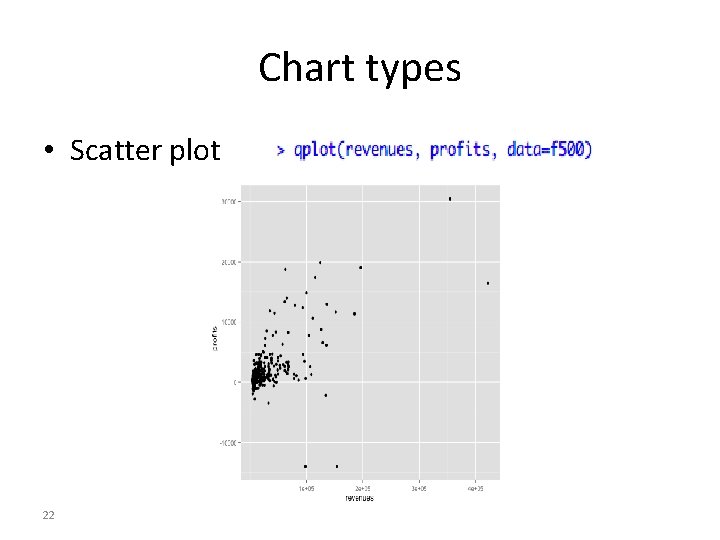
Chart types • Scatter plot 22
Chart types • Line plot 23
Chart types • Log-log plot 24
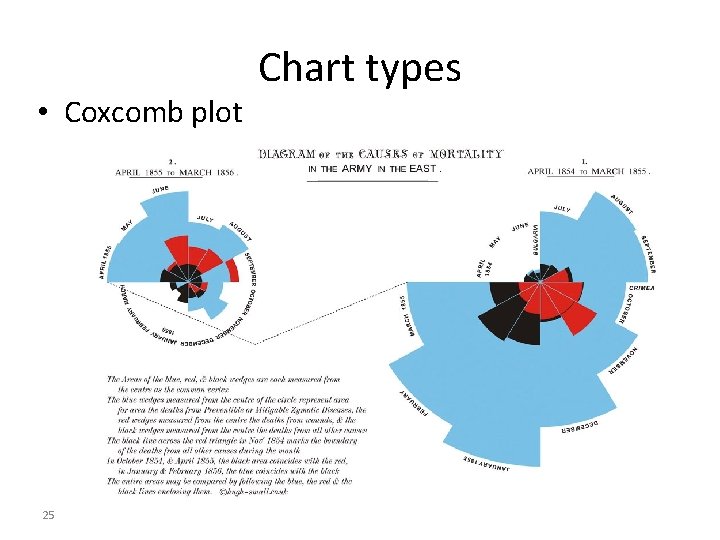
• Coxcomb plot 25 Chart types
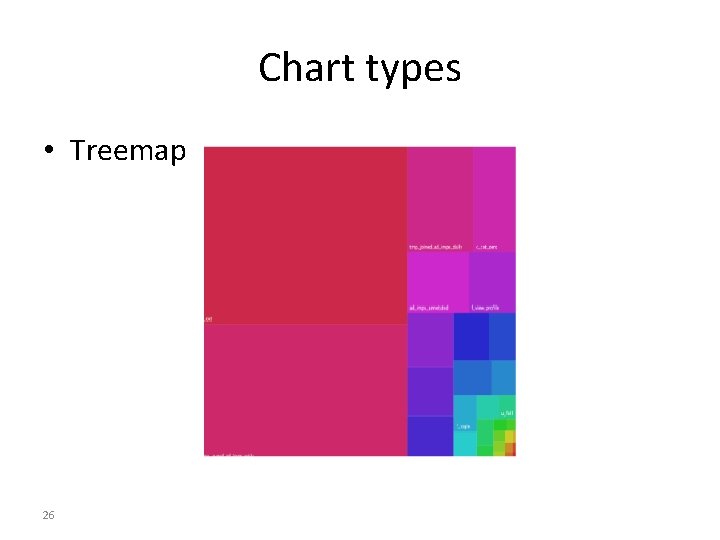
Chart types • Treemap 26
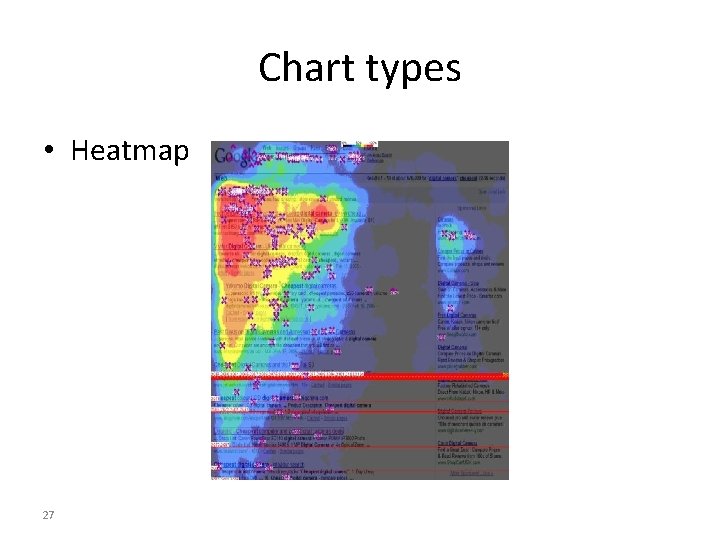
Chart types • Heatmap 27
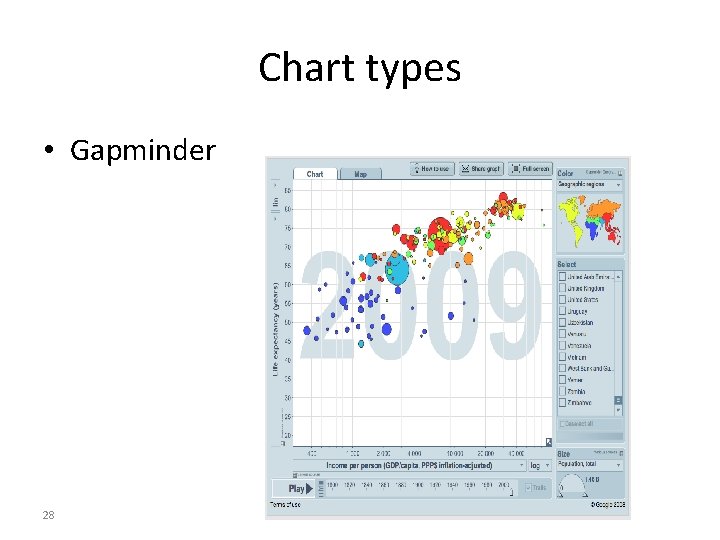
Chart types • Gapminder 28
The Need for Models “All models are wrong, but some models are useful. ” George Box • Data represents the traces of the real-world processes. • Two sources of randomness and uncertainty: 1) those underlying the process themselves 2) those associated with the data collection methods • To simplify the traces into something more comprehensible you need: • mathematical models or functions of the data -> Statistical estimators
More on Models • N is size of population • n is sample size (subset of the population) • Getting the subset (i. e. sampling) can introduce "bias" leading to incorrect conclusions
Probability Distributions • Natural processes tend to generate measurements whose empirical shape could be approximated by mathematical functions with a few parameters that could be estimated from the data.
Note on ML Algos vs. Stat Models • Techniques and underlying concepts in common • Difference in goals/use: • ML Algos – goal: predict or classify with high accuracty. • basis of many data products • Models – get at the underlying generative process • “Black box” vs. “White box” • Dealing with uncertainty (at the heart of stats) • Distributions vs. non-parametic approaches
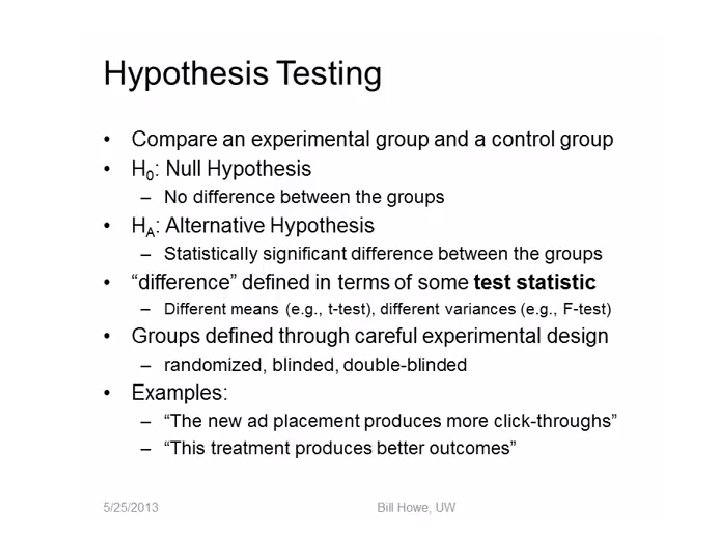
More on Hypothesis Testing • Null Hypothesis is given the benefit of the doubt (e. g. , innocent until proven guilty). • Alternative Hypothesis directly contradicts the Null Hypothesis • "Step 1: State the hypotheses. " • "Step 2: Set the criteria for a decision. " • "Step 3: Compute the test statistic. " • "Step 4: Make a decision. "
p Value • A p value is the probability of obtaining a sample outcome, given that the value stated in the null hypothesis is true. • In many cases: when the p value is less than 5% (p <. 05), we reject the null hypothesis • Note this means that 1 out of 20 times we incorrectly reject the null hypothesis • Do “green jelly beans cause acne? ” (see XKCD)
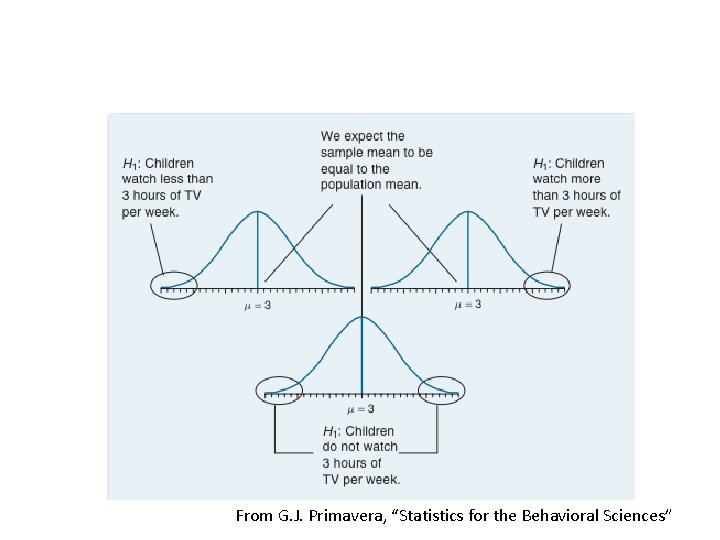
From G. J. Primavera, “Statistics for the Behavioral Sciences”
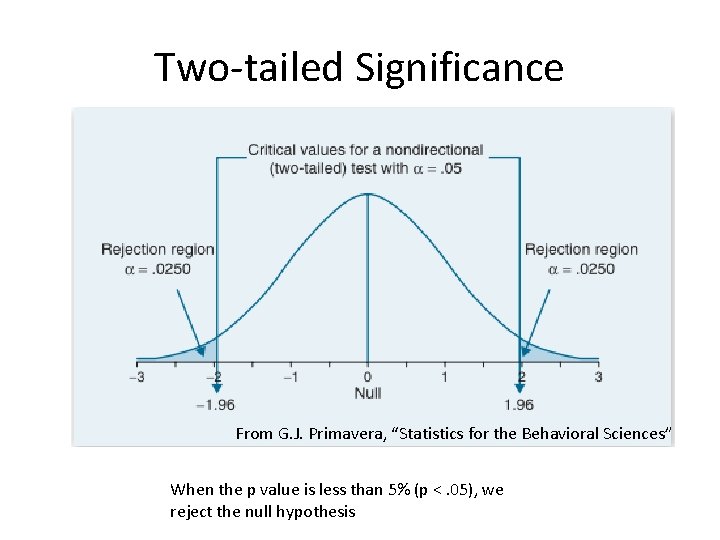
Two-tailed Significance From G. J. Primavera, “Statistics for the Behavioral Sciences” When the p value is less than 5% (p <. 05), we reject the null hypothesis
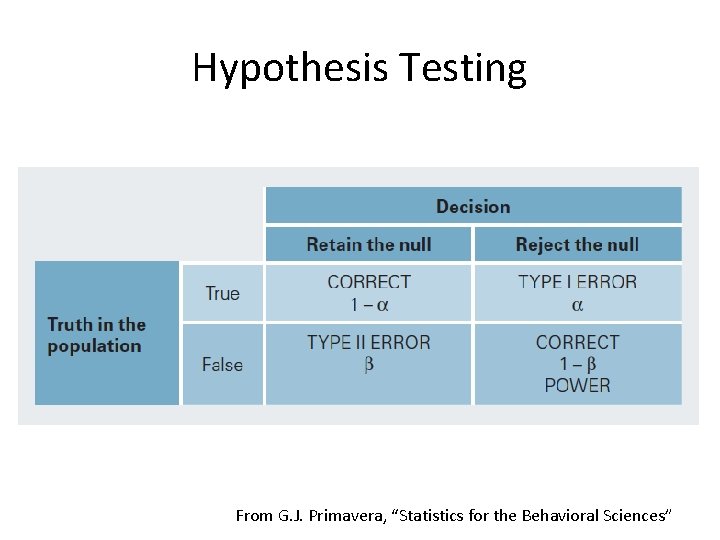
Hypothesis Testing From G. J. Primavera, “Statistics for the Behavioral Sciences”
Are Two Sets of Data Really Different? • Null Hypothesis: The differences we see are due to “chance” • For Small Sample sizes: use T-test • We’ll do this next in the lab.
Some Notes on the Class • 3/17 Intro to Supervised Learning • HW 2 coming out tomorrow night • Due after Spring Break but do it before! • FINAL PROJECTS • Group size = 3 • What’s expected – find data, build a COOL Data Product, integration & viz or good reason why not • Schedule: • Groups Formed • 1 -2 page proposal DUE 3/11 Midnight • Midway review meeting with Prof or GSIs following 1 -2 weeks • Final Presentation (Posters and/or Lightning talks) • Final Report