Chapter 14 EXPLORATORY FACTOR ANALYSIS Exploratory Factor Analysis


 o Eigenvalue o % of variance")


 n n n measure of sampling adequacy index")
 o Marvelous - - -. 90 s o Meritorious - - -.")


- Slides: 42
Chapter 14 EXPLORATORY FACTOR ANALYSIS
Exploratory Factor Analysis o Statistical technique for dealing with multiple variables o Many variables are reduced (grouped) into a smaller number of factors
Types of Factor Analysis o Exploratory o Confirmatory
Uses of Factor Analysis o Instrument Development o Theory Development o Data Reduction
Assumptions o Factor analysis is based on correlation coefficients n n n Interval level Normally distributed Linear relationships Common metric Substantial correlations among variables
Sample Size o 10 subjects per variable o 100 to 200 subjects
Matrices o Raw Data o Correlation o Factor Matrix, Unrotated o Factor Matrix, Rotated o Factor Score Matrix o Factor Correlation Matrix
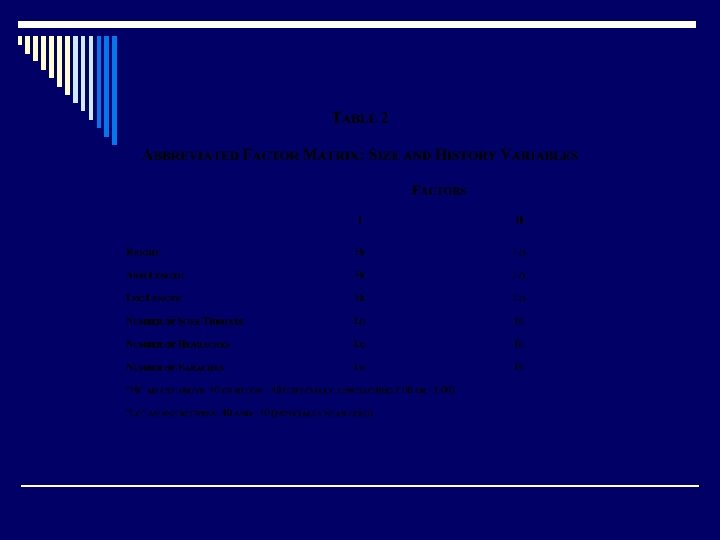
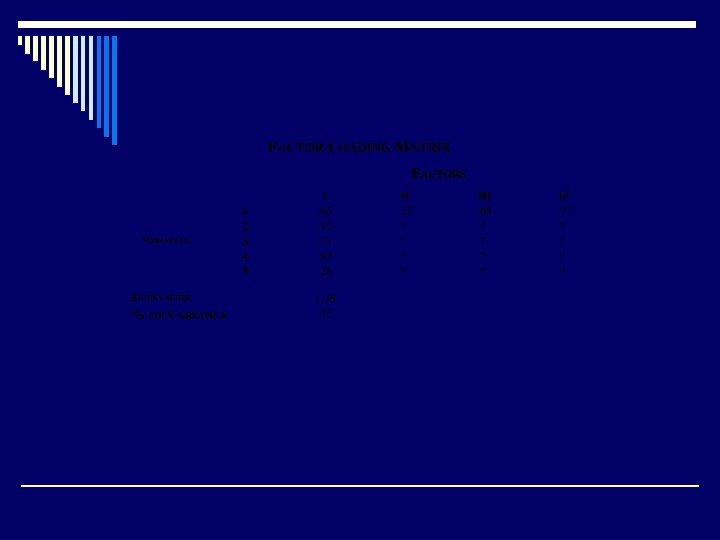
Unrotated Factor Matrix o Items are rows o Factors are columns o Loading range between -1. 0 and 1. 0 o Square of factor loading represents the proportion of variance which item and factor have in common
Factor Matrix Supplemental information o Communalities (h 2) o Eigenvalue o % of variance accounted for
Reliable Variance o Total Variance - Error variance o or o Common Variance + Specific Variance
Extraction Methods o Principal Component Analysis o Common Factor Analysis
Principal Components Analysis o Assumes all measurement error is random. o New variables are exact mathematical transformations of the original data. o All variance in the observed variables contributes to the solution. o The unities (1 s) in the diagonal of the correlation matrix are part of the variance analyzed.
Common Factor Analysis o Assumes that measurement error consists of a systematic component and a unique component. o Systematic component of measurement error may reflect common variance due to factors that are not directly measured - latent factors
Common Factor Analysis o Diagonals are altered to contain an estimate of the communalities o Analysis includes only common variance --covariance
Comparison of Extraction Models o Principal Components vs Common Factor n n n Factor loadings and eigenvalues are a little larger with Principal Components One may always obtain a solution with Principal Components Often little practical difference
Rotated Factor Matrix o Simple Structure n n n Each row should have at least one loading close to zero. Each column should have about as many variables with zero loadings as there are factors. For pairs of columns (factors), there should be several variables that load on one and not on the other.
Factor Rotation Orthogonal o Varimax n minimizes number of variables with high loadings on a factor o Quartimax n minimizes the number of factors o Equamax n combination of Varimax and Quartimax
Oblique Factor Rotation o Factor Pattern Matrix n n factor loadings generally used for interpretation o Factor Structure Matrix n correlations between factors and variables
Decisions o Principal Components vs Common Factor Analysis o Type of rotation
Principal Components o Varimax rotation o IPA items
SPSS - Factor Analysis o Principal components with Varimax rotation o ANALYZE n Data Reduction p Factor
SPSS - Factor Analysis o Statistics n univariate descriptives o Correlation matrix n n n coefficients significance levels KMO & Bartlett’s test of sphericity
Extraction o Method: Principal components o Analyze: Correlation matrix o Display n n unrotated factor solution scree plot o Extract n n eigenvalues over 1 May select number of factors
SPSS - Factor Analysis o Rotation n n Varimax rotated solution
SPSS - Factor Analysis Options o Missing values n Exclude cases listwise o Coefficient display format n n Sorted by size suppress absolute values less than. 10
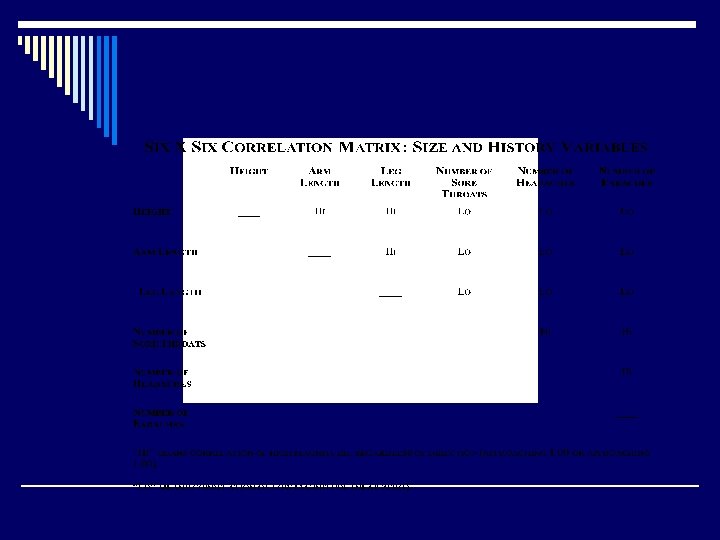
Correlation Matrix o Examine matrix n Correlations should be. 30 or higher o Kaiser-Meyer-Olkin (KMO) Measure of Sampling Adequacy o Bartlett's Test of Sphericity
Correlation Matrix o Kaiser-Meyer Olkin (KMO) n n n measure of sampling adequacy index for comparing magnitudes of observed correlation coefficients to magnitudes of partial correlation coefficients small values indicate correlations between pairs of variables cannot be explained by other variables
Kaiser-Meyer-Olkin (KMO) o Marvelous - - -. 90 s o Meritorious - - -. 80 s o Middling - - - -. 70 s o Mediocre - - - -. 60 s o Miserable - - -. 50 s o Unacceptable - - - below. 50
Correlation Matrix o Bartlett's Test of Sphericity n Tests hypothesis that correlation matrix is an identity matrix. p Diagonals are ones p Off-diagonals are zeros n Significant result indicates matrix is not an identity matrix.
Communality o h 2 o Sum of squared loadings for the variable o Proportion of item variance accounted for by the various factors o Small numbers indicate lack of shared variance
Principal Components Analysis o Possible to compute as many principal components as there are variables. o Proportion of variance accounted for by the various factors, or the communality, is 1 for each variable.
Principal Components Analysis o Linear combinations of observed variables o First principal component accounts for largest amount of variance. o Second principal component accounts for second largest amount of variance, etc.
Principal Components Analysis o Total variance explained n n Total variance for all variables is equal to number of variables. Total variance for a factor expressed as Eigenvalue. Percent of variance given for each factor. Cumulative % is sum of % by factor
Criteria For Retention Of Factors o Eigenvalue greater than 1 n Single variable has variance equal to 1 o Plot of total variance - Scree plot n Gradual trailing off of variance accounted for is called the scree. o Note cumulative % of variance of rotated factors
Interpretation of Rotated Matrix o Loadings of. 40 or higher o Name each factor based on 3 or 4 variables with highest loadings. o Do not expect perfect conceptual fit of all variables.
Alternative Methods of Factor Extraction o Principal axis o Image o Alpha o Generalized least squares o Unweighted least squares
Methods of Factor Extraction o Principal-axis factoring n n n diagonals replaced by estimates of communalities iterative process continues until negligible changes in communalities
Methods of Factor Extraction o Alpha n maximizes the alpha reliability n generalizes to universe of variables from which measured variables were sampled
Methods of Extraction o Maximum-likelihood n form of confirmatory factor analysis