Six Key Metrics to Align Asset Management Energy
- Slides: 28
Six Key Metrics to Align Asset Management & Energy Efficiency David Berger; Contributing Editor, Plant Services magazine – WMC Rod Ellsworth; Vice President Global Asset Sustainability – Infor Bruce Gheesling – Sr. V. P GAS March 20, 2007 Infor Confidential
Western Management Consultants § General management consulting, including asset management § Five offices across Canada § www. wmc. ca § David Berger 2 § Contributing Editor, Plant Services magazine § 15+ years industry experience, incl. executive roles § Founding President of PEMAC Copyright © 2001 -2007 Infor Global Solutions
Capture the Right Metrics: Benefits § Define success for your asset performance management § Move to a more planned environment § Improve control of assets § Lower operating costs and increase revenue opportunities § Measure to motivate 3 Copyright © 2001 -2007 Infor Global Solutions
Challenges in Working with Metrics § Too § few or incorrect metrics that don’t trade off Improvement in one may result in deterioration of another § Too many measurements § No focus across the organization § Expensive to collect and track § Increased likelihood of errors § Risks § of not using the right metrics Major safety, environmental or operational failures Reduced efficiency resulting in financial loss § Total plant shutdown § 4 Copyright © 2001 -2007 Infor Global Solutions
Poll – Question § OEE 5 question to viewers Copyright © 2001 -2007 Infor Global Solutions
What are the 6 Key Metrics? Maximize 5: § Availability (vs machine downtime) § Utilization (vs available but not used) § Reliability (eg. MTBF, MTTR) § Performance (ie, efficiency) § Quality of output Minimize 1: § Total Cost of Ownership (ie, lifecycle cost) 6 Copyright © 2001 -2007 Infor Global Solutions
OEE is Insufficient § OEE is “Overall Equipment Effectiveness” § OEE = Actual Output from an Asset / Theoretical Maximum Output from that Asset § OEE § The § = Availability x Performance x Quality problem with OEE: Does not explicitly capture all of the tradeoffs (eg, reliability, utilization, and total cost of ownership) § May miss the largest cost drivers (eg, energy efficiency, emissions, throwing people at a problem) 7 § Formula complicated and not easily understood – better to track the individual metrics § Obscures the root cause Copyright © 2001 -2007 Infor Global Solutions
The Bigger Picture § MRO spending: US companies spend $100 Billion annually on capital equipment and services § Energy spending: US companies spend $400 Billion annually on energy – and climbing § Next to personnel, the single highest cost for a typical manufacturing facility is energy § So why do companies maximize asset availability / performance / quality (ie, OEE) without properly understanding the two biggest cost drivers? § Would you take on the cost of a high performance limousine, that is always available, and gives you a quality ride from A to B, if it has a high purchase price, guzzles gas, requires a team of people to maintain, has a poor economic life, and is scoffed by passersby? OEE does not tell the whole story 8 Copyright © 2001 -2007 Infor Global Solutions
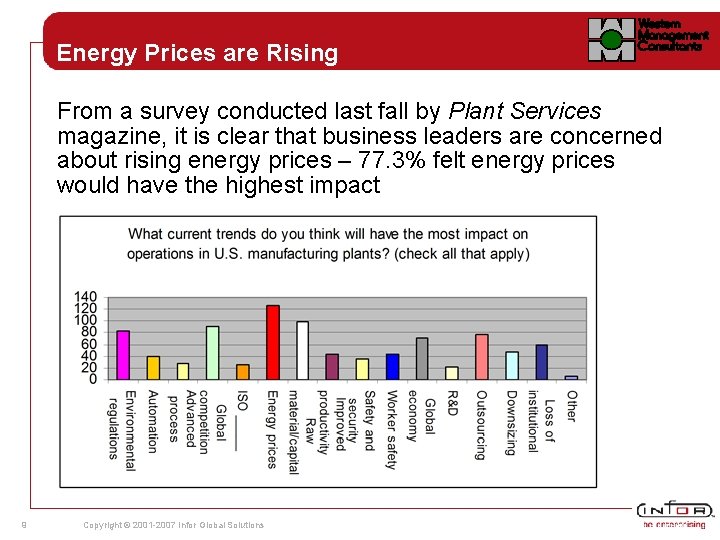
Energy Prices are Rising From a survey conducted last fall by Plant Services magazine, it is clear that business leaders are concerned about rising energy prices – 77. 3% felt energy prices would have the highest impact 9 Copyright © 2001 -2007 Infor Global Solutions
Key Asset Performance Analysis Tools 10 A. Criticality Analysis – Looking Forward based on Engineering Design B. Failure History Analysis – Looking Forward Based on History C. Predictive Maintenance Analysis – Looking Forward Based on History/Eng/Stats D. Lifecycle Analysis – Repair/Replace Decision Based on Cost History Copyright © 2001 -2007 Infor Global Solutions
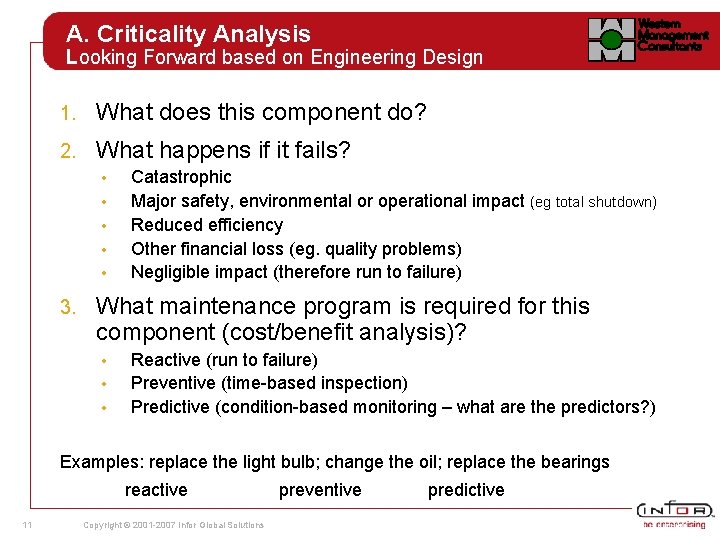
A. Criticality Analysis Looking Forward based on Engineering Design 1. What does this component do? 2. What happens if it fails? • • • 3. Catastrophic Major safety, environmental or operational impact (eg total shutdown) Reduced efficiency Other financial loss (eg. quality problems) Negligible impact (therefore run to failure) What maintenance program is required for this component (cost/benefit analysis)? • • • Reactive (run to failure) Preventive (time-based inspection) Predictive (condition-based monitoring – what are the predictors? ) Examples: replace the light bulb; change the oil; replace the bearings reactive 11 Copyright © 2001 -2007 Infor Global Solutions preventive predictive
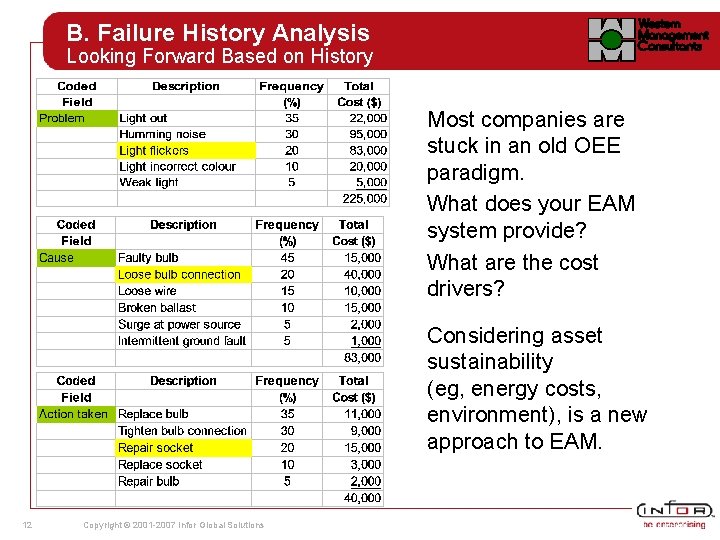
B. Failure History Analysis Looking Forward Based on History Most companies are stuck in an old OEE paradigm. What does your EAM system provide? What are the cost drivers? Considering asset sustainability (eg, energy costs, environment), is a new approach to EAM. 12 Copyright © 2001 -2007 Infor Global Solutions
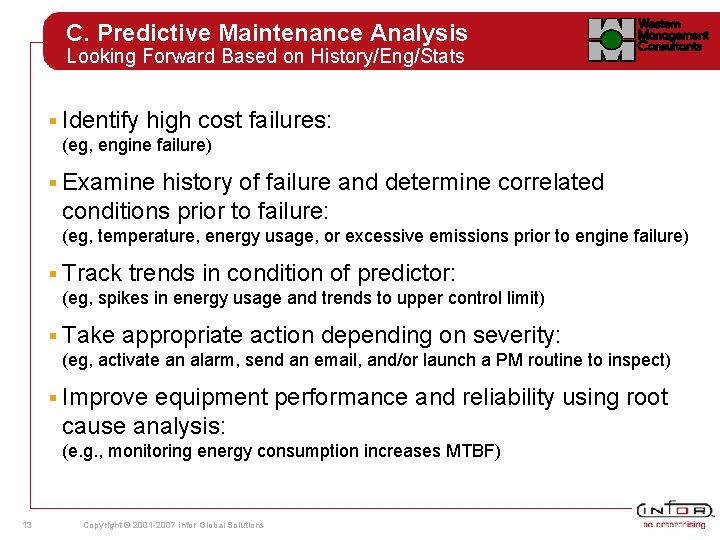
C. Predictive Maintenance Analysis Looking Forward Based on History/Eng/Stats § Identify high cost failures: (eg, engine failure) § Examine history of failure and determine correlated conditions prior to failure: (eg, temperature, energy usage, or excessive emissions prior to engine failure) § Track trends in condition of predictor: (eg, spikes in energy usage and trends to upper control limit) § Take appropriate action depending on severity: (eg, activate an alarm, send an email, and/or launch a PM routine to inspect) § Improve equipment performance and reliability using root cause analysis: (e. g. , monitoring energy consumption increases MTBF) 13 Copyright © 2001 -2007 Infor Global Solutions
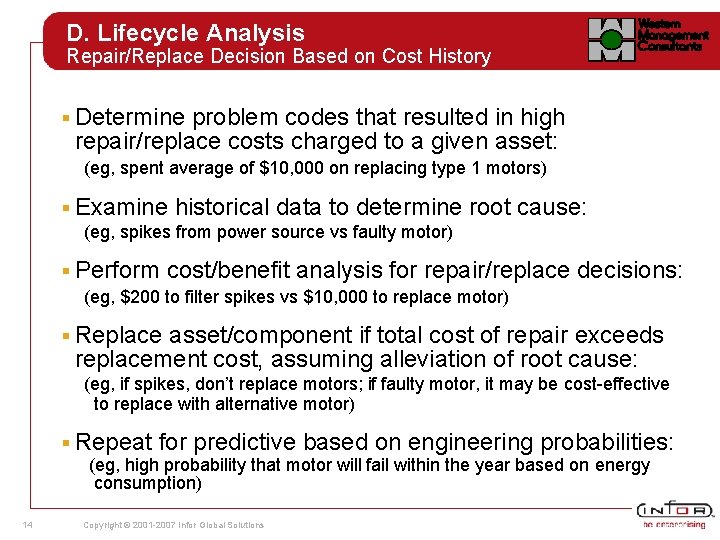
D. Lifecycle Analysis Repair/Replace Decision Based on Cost History § Determine problem codes that resulted in high repair/replace costs charged to a given asset: (eg, spent average of $10, 000 on replacing type 1 motors) § Examine historical data to determine root cause: (eg, spikes from power source vs faulty motor) § Perform cost/benefit analysis for repair/replace decisions: (eg, $200 to filter spikes vs $10, 000 to replace motor) § Replace asset/component if total cost of repair exceeds replacement cost, assuming alleviation of root cause: (eg, if spikes, don’t replace motors; if faulty motor, it may be cost-effective to replace with alternative motor) § Repeat for predictive based on engineering probabilities: (eg, high probability that motor will fail within the year based on energy consumption) 14 Copyright © 2001 -2007 Infor Global Solutions
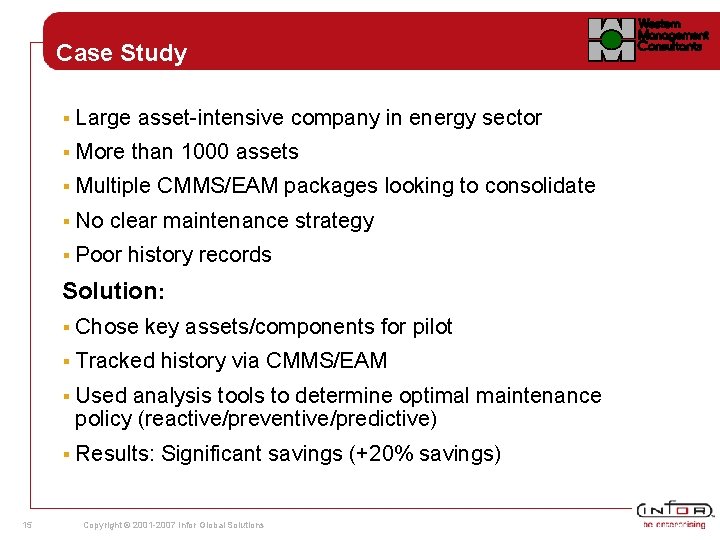
Case Study § Large asset-intensive company in energy sector § More than 1000 assets § Multiple CMMS/EAM packages looking to consolidate § No clear maintenance strategy § Poor history records Solution: 15 § Chose key assets/components for pilot § Tracked history via CMMS/EAM § Used analysis tools to determine optimal maintenance policy (reactive/preventive/predictive) § Results: Significant savings (+20% savings) Copyright © 2001 -2007 Infor Global Solutions
Six Key Metrics to Align Asset Management & Energy Efficiency Rod Ellsworth Vice President Global Asset Sustainability – Infor Bruce Gheesling – Sr. V. P GAS March 20, 2007 Infor Confidential
Poll – Question § Energy 17 Efficiency question Copyright © 2001 -2007 Infor Global Solutions
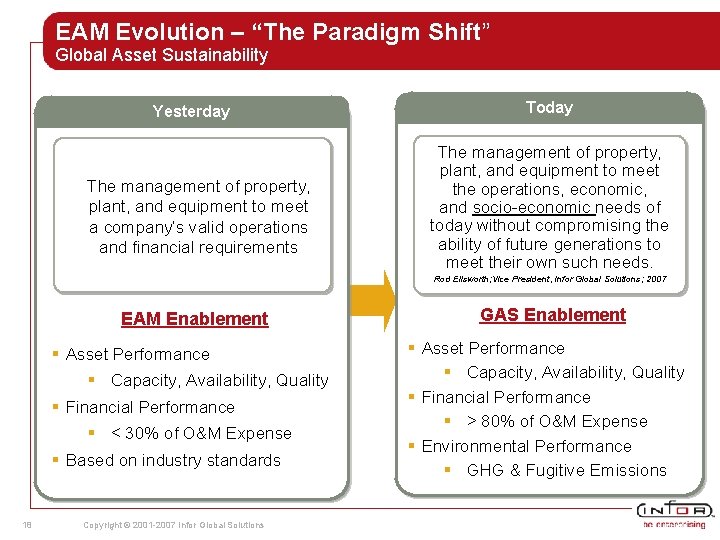
EAM Evolution – “The Paradigm Shift” Global Asset Sustainability Yesterday The management of property, plant, and equipment to meet a company’s valid operations and financial requirements Today The management of property, plant, and equipment to meet Infor Solution the operations, economic, and socio-economic needs Enriched Infor of Solution today without compromising the ability of future generations to meet their own such needs. Rod Ellsworth; Vice President, Infor Global Solutions; 2007 EAM Enablement § Asset Performance § Capacity, Availability, Quality § Financial Performance § < 30% of O&M Expense § Based on industry standards 18 Copyright © 2001 -2007 Infor Global Solutions GAS Enablement § Asset Performance § Capacity, Availability, Quality § Financial Performance § > 80% of O&M Expense § Environmental Performance § GHG & Fugitive Emissions
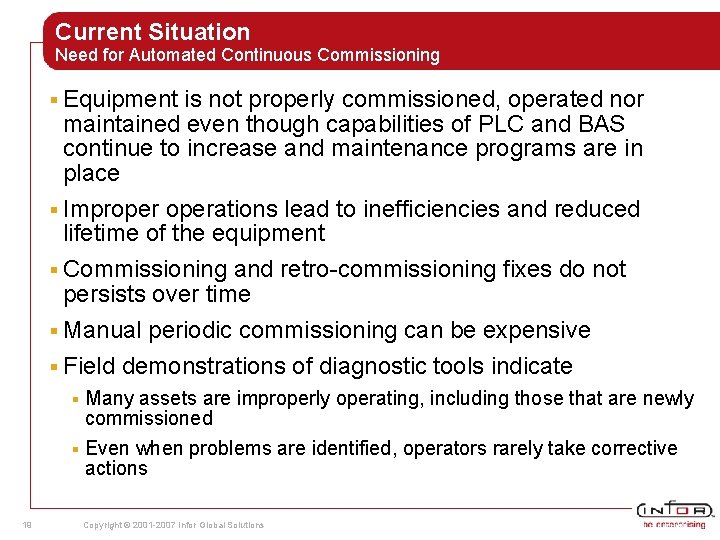
Current Situation Need for Automated Continuous Commissioning § Equipment is not properly commissioned, operated nor maintained even though capabilities of PLC and BAS continue to increase and maintenance programs are in place § Improperations lead to inefficiencies and reduced lifetime of the equipment § Commissioning and retro-commissioning fixes do not persists over time § Manual periodic commissioning can be expensive § Field demonstrations of diagnostic tools indicate Many assets are improperly operating, including those that are newly commissioned § Even when problems are identified, operators rarely take corrective actions § 19 Copyright © 2001 -2007 Infor Global Solutions
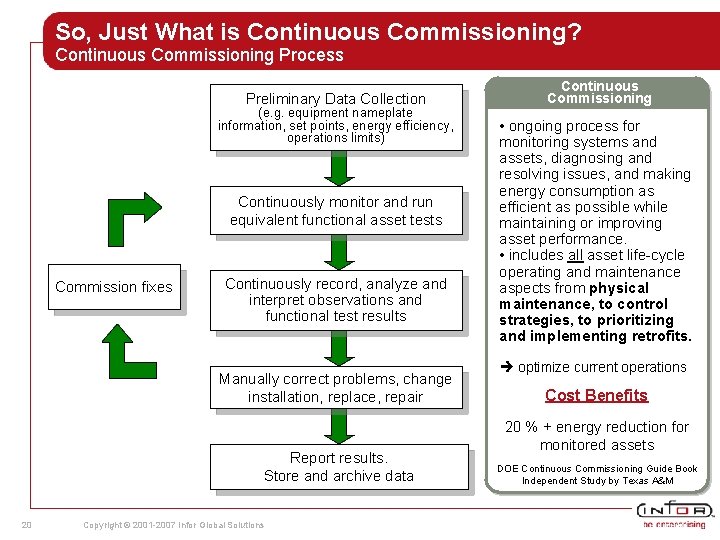
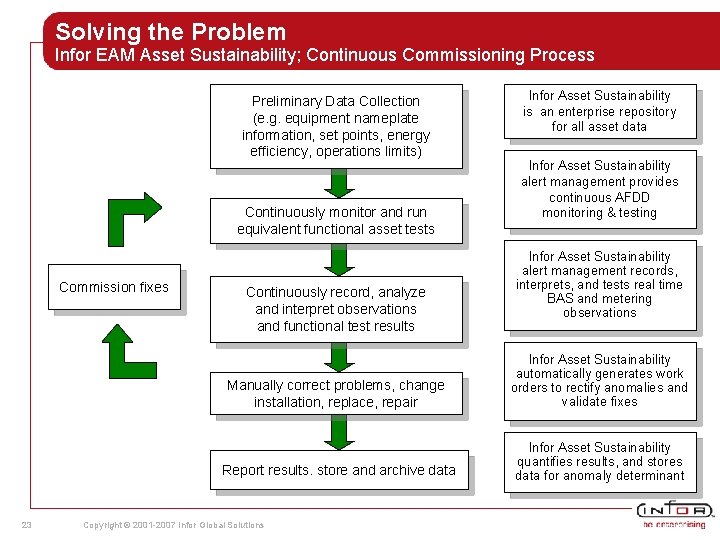
So, Just What is Continuous Commissioning? Continuous Commissioning Process Preliminary Data Collection (e. g. equipment nameplate information, set points, energy efficiency, operations limits) Continuously monitor and run equivalent functional asset tests Commission fixes Continuously record, analyze and interpret observations and functional test results Manually correct problems, change installation, replace, repair Report results. Store and archive data 20 Copyright © 2001 -2007 Infor Global Solutions Continuous Commissioning • ongoing process for monitoring systems and assets, diagnosing and resolving issues, and making energy consumption as efficient as possible while maintaining or improving asset performance. • includes all asset life-cycle operating and maintenance aspects from physical maintenance, to control strategies, to prioritizing and implementing retrofits. optimize current operations Cost Benefits 20 % + energy reduction for monitored assets DOE Continuous Commissioning Guide Book Independent Study by Texas A&M
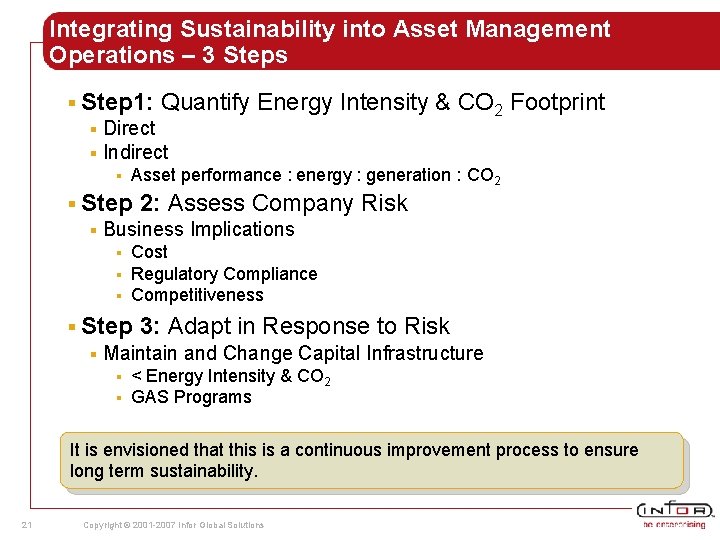
Integrating Sustainability into Asset Management Operations – 3 Steps § Step 1: Quantify § Direct § Indirect § Energy Intensity & CO 2 Footprint Asset performance : energy : generation : CO 2 § Step 2: Assess Company § Business Implications § § § Risk Cost Regulatory Compliance Competitiveness § Step 3: Adapt in Response to Risk § Maintain and Change Capital Infrastructure § § < Energy Intensity & CO 2 GAS Programs It is envisioned that this is a continuous improvement process to ensure long term sustainability. 21 Copyright © 2001 -2007 Infor Global Solutions
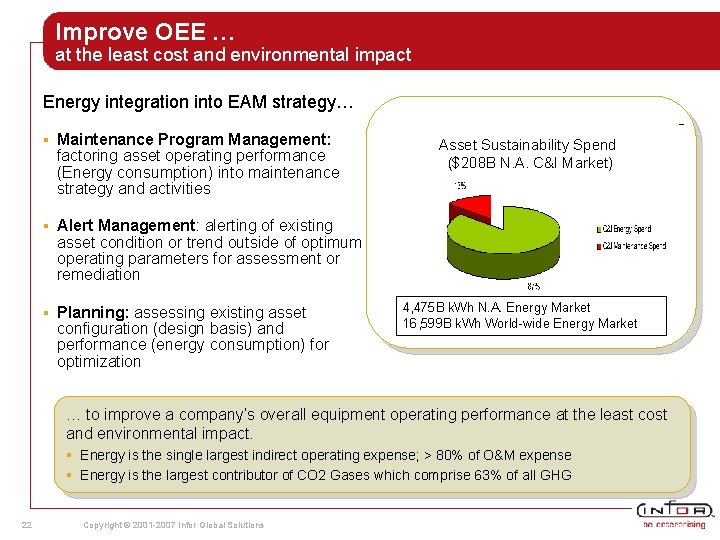
Improve OEE … at the least cost and environmental impact Energy integration into EAM strategy… § Maintenance Program Management: factoring asset operating performance (Energy consumption) into maintenance strategy and activities § Alert Management: alerting of existing asset condition or trend outside of optimum operating parameters for assessment or remediation § Planning: assessing existing asset configuration (design basis) and performance (energy consumption) for optimization Asset Sustainability Spend ($208 B N. A. C&I Market) 4, 475 B k. Wh N. A. Energy Market 16, 599 B k. Wh World-wide Energy Market … to improve a company’s overall equipment operating performance at the least cost and environmental impact. § Energy is the single largest indirect operating expense; > 80% of O&M expense § Energy is the largest contributor of CO 2 Gases which comprise 63% of all GHG 22 Copyright © 2001 -2007 Infor Global Solutions
Solving the Problem Infor EAM Asset Sustainability; Continuous Commissioning Process Preliminary Data Collection (e. g. equipment nameplate information, set points, energy efficiency, operations limits) Continuously monitor and run equivalent functional asset tests Commission fixes 23 Continuously record, analyze and interpret observations and functional test results Infor Asset Sustainability is an enterprise repository for all asset data Infor Asset Sustainability alert management provides continuous AFDD monitoring & testing Infor Asset Sustainability alert management records, interprets, and tests real time BAS and metering observations Manually correct problems, change installation, replace, repair Infor Asset Sustainability automatically generates work orders to rectify anomalies and validate fixes Report results. store and archive data Infor Asset Sustainability quantifies results, and stores data for anomaly determinant Copyright © 2001 -2007 Infor Global Solutions
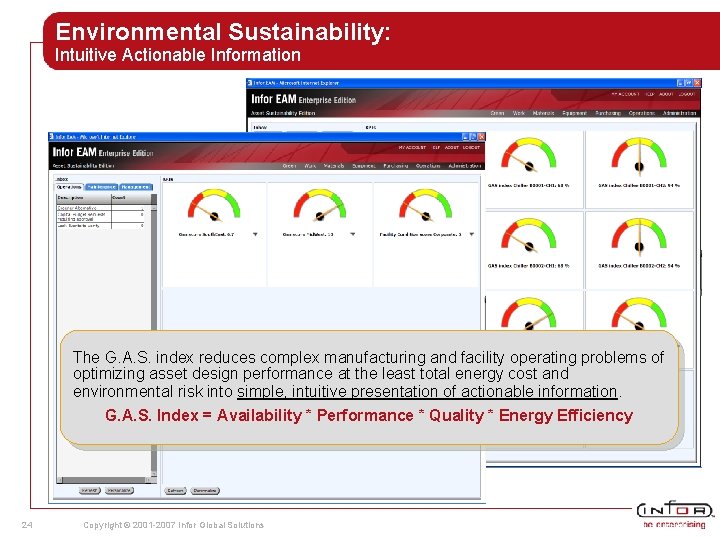
Environmental Sustainability: Intuitive Actionable Information The G. A. S. index reduces complex manufacturing and facility operating problems of optimizing asset design performance at the least total energy cost and environmental risk into simple, intuitive presentation of actionable information. G. A. S. Index = Availability * Performance * Quality * Energy Efficiency 24 Copyright © 2001 -2007 Infor Global Solutions
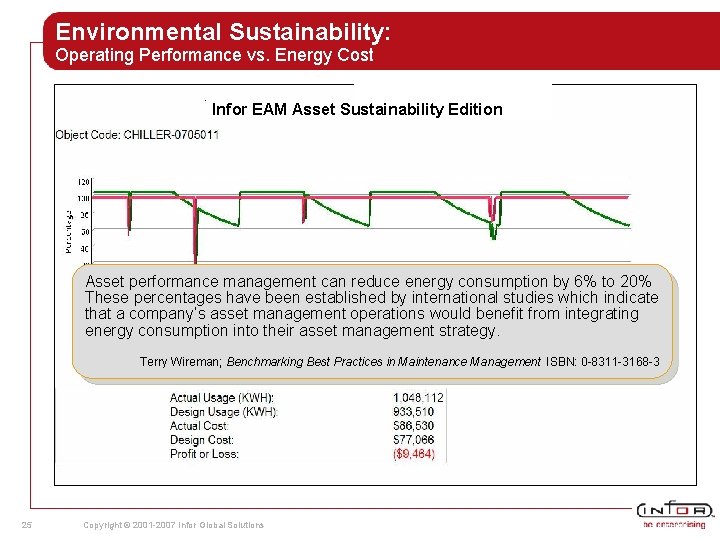
Environmental Sustainability: Operating Performance vs. Energy Cost Infor EAM Asset Sustainability Edition Asset performance management can reduce energy consumption by 6% to 20% These percentages have been established by international studies which indicate that a company’s asset management operations would benefit from integrating energy consumption into their asset management strategy. Terry Wireman; Benchmarking Best Practices in Maintenance Management ISBN: 0 -8311 -3168 -3 25 Copyright © 2001 -2007 Infor Global Solutions
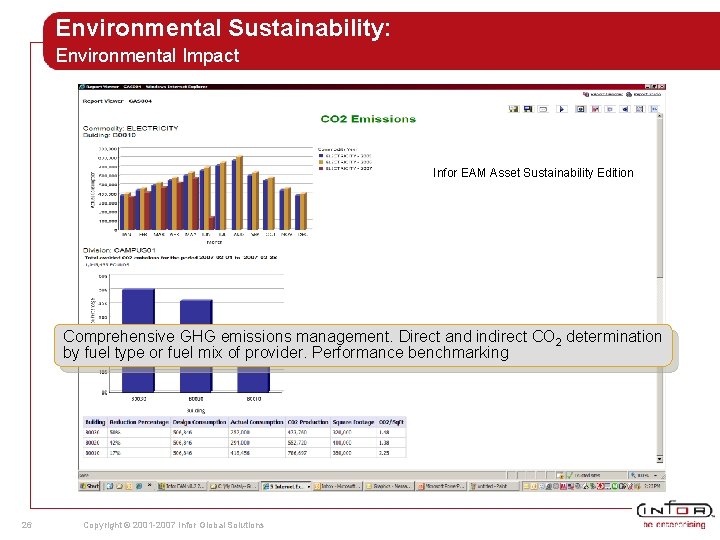
Environmental Sustainability: Environmental Impact Infor EAM Asset Sustainability Edition Comprehensive GHG emissions management. Direct and indirect CO 2 determination by fuel type or fuel mix of provider. Performance benchmarking 26 Copyright © 2001 -2007 Infor Global Solutions
In conclusion, do you know… 27 § If your asset operations performance consume more energy than it was designed to consume? § If some assets are consuming more energy than a like or comparable asset in your enterprise? § If there are more energy efficient products and if they could impact your operation and financial performance? § How energy consumption impacts your asset repair vs. replace analysis? § How your operations energy efficiency compares to industry benchmarks and guidelines ? Copyright © 2001 -2007 Infor Global Solutions
Next Step? Thank you for attending today’s Webinar on “Six Key Metrics to Align Asset Management & Energy Efficiency. ” § Contact Infor? § Call Infor at 1 -800 -2640 § Email Infor at solutions@infor. com § Next step? Take the Green Assessment: go. infor. com/green § Demo & report: http: //www. infor. com/goinggreen/solutions/greeneam/as/ § Attend the next live demo of Infor EAM Asset Sustainability Edition on June 26: http: //www. infor. com/company/events/ § 28 Copyright © 2001 -2007 Infor Global Solutions