
WRF Utility Benchmarking Workshop Integrating the EUM Benchmarking
WRF Utility Benchmarking Workshop Integrating the EUM Benchmarking Tool into Albuquerque’s Strategic Planning Process April 23, 2015 © 2015 Water Research Foundation. ALLwithout RIGHTSpermission. RESERVED. © 2015 Water Research Foundation. ALL RIGHTS RESERVED. No part of this presentation may be copied, reproduced, or otherwise utilized
2015 IWA Water Efficiency & Performance Assessment Conference Integrating the EUM Benchmarking Tool into Albuquerque’s Strategic Planning Process April 23, 2015 Frank Roth, Senior Policy Manager Albuquerque Bernalillo County Water Utility Authority New Mexico © 2015 Water Research Foundation. ALL RIGHTS RESERVED.
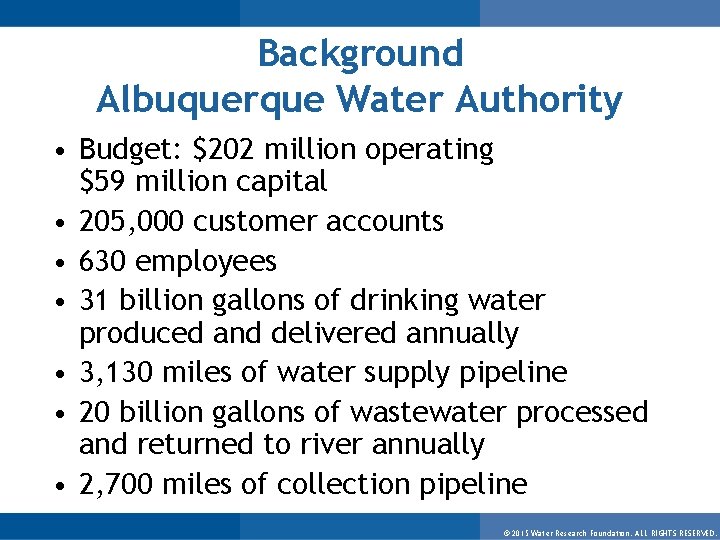
Background Albuquerque Water Authority • Budget: $202 million operating $59 million capital • 205, 000 customer accounts • 630 employees • 31 billion gallons of drinking water produced and delivered annually • 3, 130 miles of water supply pipeline • 20 billion gallons of wastewater processed and returned to river annually • 2, 700 miles of collection pipeline © 2015 Water Research Foundation. ALL RIGHTS RESERVED.
Presentation Outline • • • Background on Albuquerque Overview Strategic Planning Process Benchmarking Tool Test Phase EUM Primer Assessment Results Benchmarking Tool Integration into Strategic Planning Process © 2015 Water Research Foundation. ALL RIGHTS RESERVED.
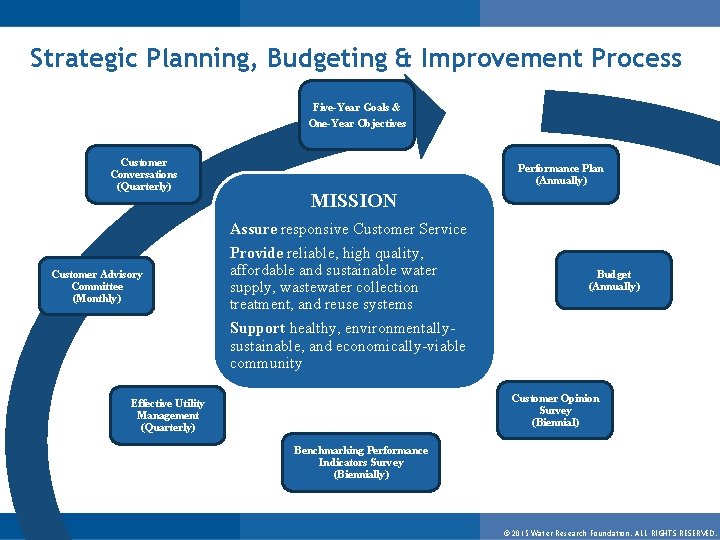
Strategic Planning, Budgeting & Improvement Process Five-Year Goals & One-Year Objectives Customer Conversations (Quarterly) Customer Advisory Committee (Monthly) Performance Plan (Annually) MISSION Assure responsive Customer Service Provide reliable, high quality, affordable and sustainable water supply, wastewater collection treatment, and reuse systems Support healthy, environmentallysustainable, and economically-viable community Budget (Annually) Customer Opinion Survey (Biennial) Effective Utility Management (Quarterly) Benchmarking Performance Indicators Survey (Biennially) © 2015 Water Research Foundation. ALL RIGHTS RESERVED.
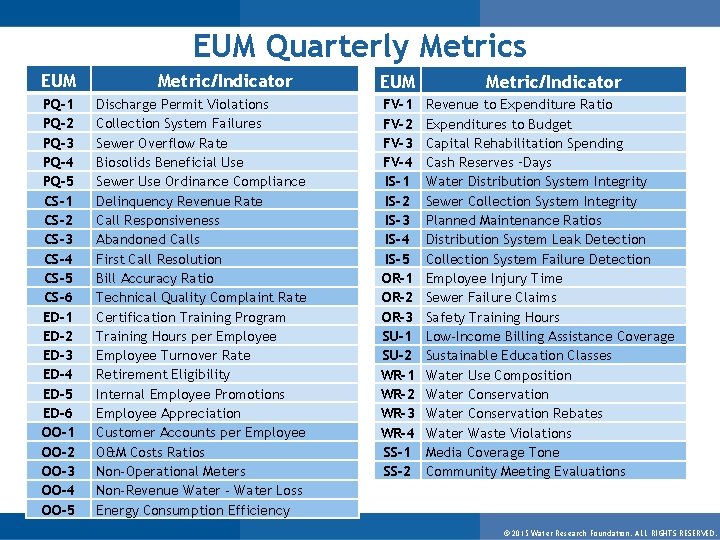
EUM Quarterly Metrics EUM PQ-1 PQ-2 PQ-3 PQ-4 PQ-5 CS-1 CS-2 CS-3 CS-4 CS-5 CS-6 ED-1 ED-2 ED-3 ED-4 ED-5 ED-6 OO-1 OO-2 OO-3 OO-4 OO-5 Metric/Indicator Discharge Permit Violations Collection System Failures Sewer Overflow Rate Biosolids Beneficial Use Sewer Use Ordinance Compliance Delinquency Revenue Rate Call Responsiveness Abandoned Calls First Call Resolution Bill Accuracy Ratio Technical Quality Complaint Rate Certification Training Program Training Hours per Employee Turnover Rate Retirement Eligibility Internal Employee Promotions Employee Appreciation Customer Accounts per Employee O&M Costs Ratios Non-Operational Meters Non-Revenue Water - Water Loss Energy Consumption Efficiency EUM Metric/Indicator FV-1 FV-2 FV-3 FV-4 IS-1 IS-2 IS-3 IS-4 IS-5 OR-1 OR-2 OR-3 SU-1 SU-2 WR-1 WR-2 WR-3 WR-4 SS-1 SS-2 Revenue to Expenditure Ratio Expenditures to Budget Capital Rehabilitation Spending Cash Reserves –Days Water Distribution System Integrity Sewer Collection System Integrity Planned Maintenance Ratios Distribution System Leak Detection Collection System Failure Detection Employee Injury Time Sewer Failure Claims Safety Training Hours Low-Income Billing Assistance Coverage Sustainable Education Classes Water Use Composition Water Conservation Rebates Water Waste Violations Media Coverage Tone Community Meeting Evaluations © 2015 Water Research Foundation. ALL RIGHTS RESERVED.
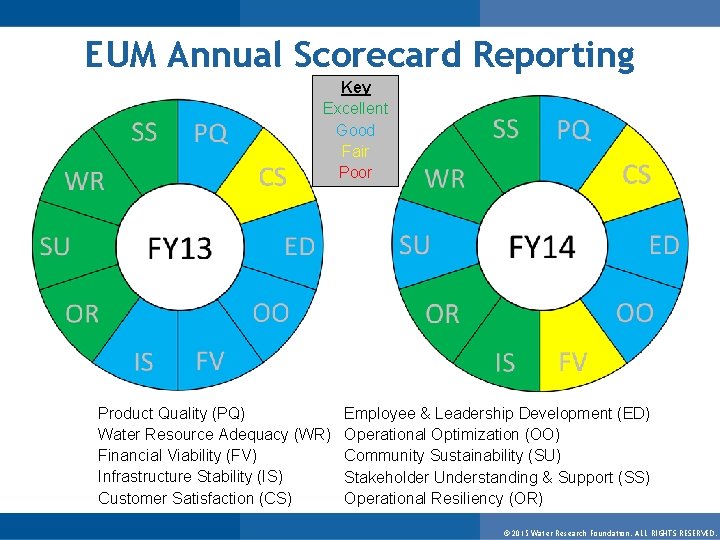
EUM Annual Scorecard Reporting Key Excellent Good Fair Poor Product Quality (PQ) Water Resource Adequacy (WR) Financial Viability (FV) Infrastructure Stability (IS) Customer Satisfaction (CS) Employee & Leadership Development (ED) Operational Optimization (OO) Community Sustainability (SU) Stakeholder Understanding & Support (SS) Operational Resiliency (OR) © 2015 Water Research Foundation. ALL RIGHTS RESERVED.
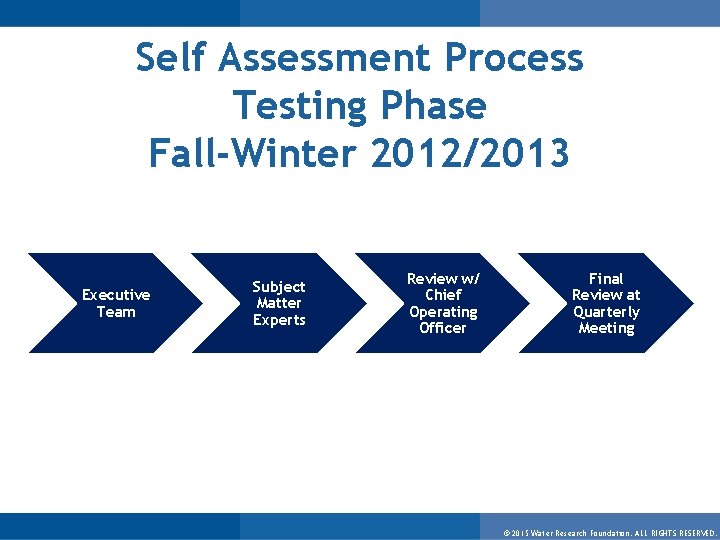
Self Assessment Process Testing Phase Fall-Winter 2012/2013 Executive Team Subject Matter Experts Review w/ Chief Operating Officer Final Review at Quarterly Meeting © 2015 Water Research Foundation. ALL RIGHTS RESERVED.
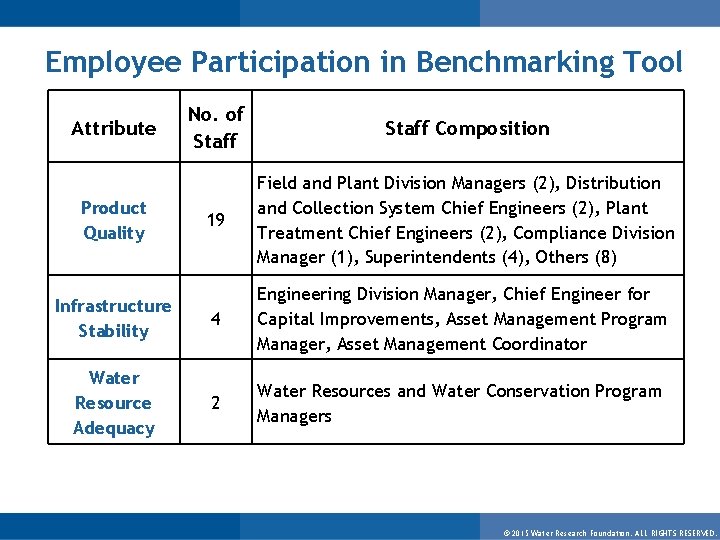
Employee Participation in Benchmarking Tool No. of Staff Composition 19 Field and Plant Division Managers (2), Distribution and Collection System Chief Engineers (2), Plant Treatment Chief Engineers (2), Compliance Division Manager (1), Superintendents (4), Others (8) Infrastructure Stability 4 Engineering Division Manager, Chief Engineer for Capital Improvements, Asset Management Program Manager, Asset Management Coordinator Water Resource Adequacy 2 Water Resources and Water Conservation Program Managers Attribute Product Quality © 2015 Water Research Foundation. ALL RIGHTS RESERVED.
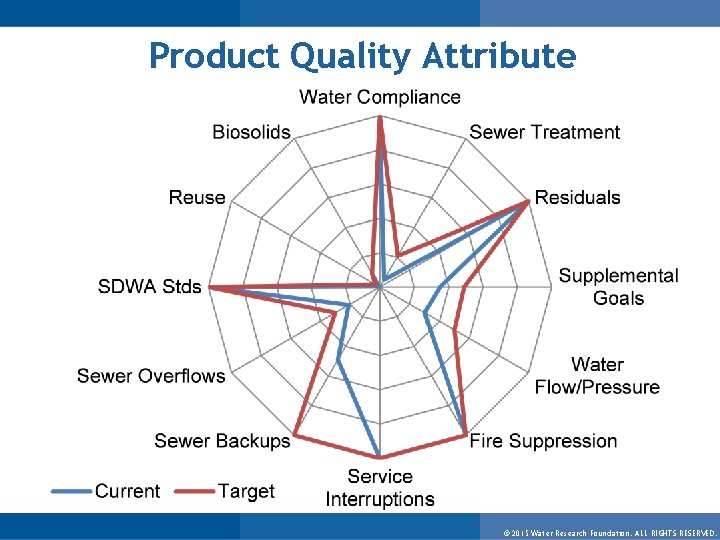
Product Quality Attribute © 2015 Water Research Foundation. ALL RIGHTS RESERVED.
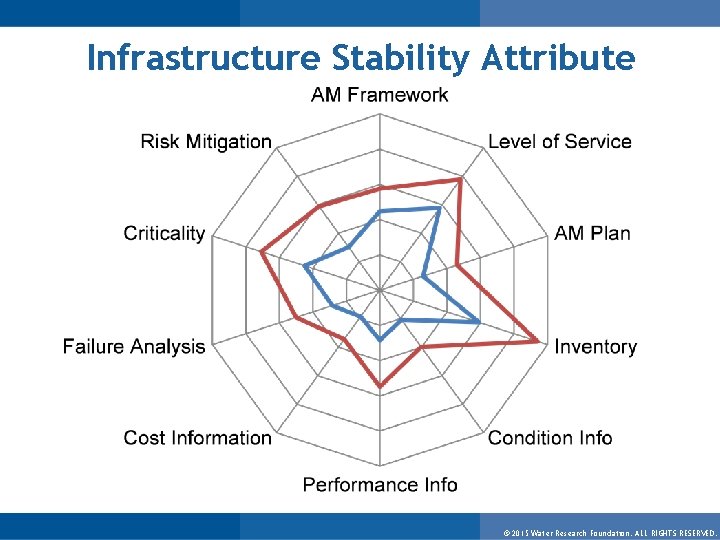
Infrastructure Stability Attribute © 2015 Water Research Foundation. ALL RIGHTS RESERVED.
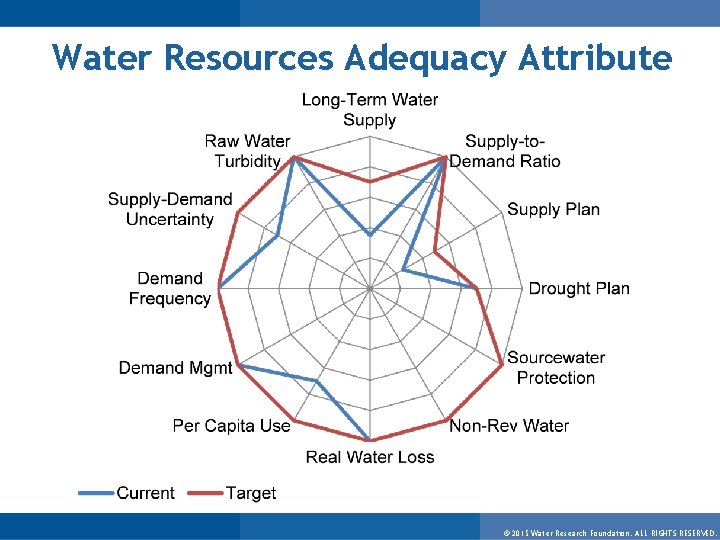
Water Resources Adequacy Attribute © 2015 Water Research Foundation. ALL RIGHTS RESERVED.
Testing Phase Key Findings • Self-Assessment Tool is a great communication tool • Many performance measures cut through the organization structure allowing for a collaborative effort • We are doing better than we thought and have made progress in last 10 years © 2015 Water Research Foundation. ALL RIGHTS RESERVED.
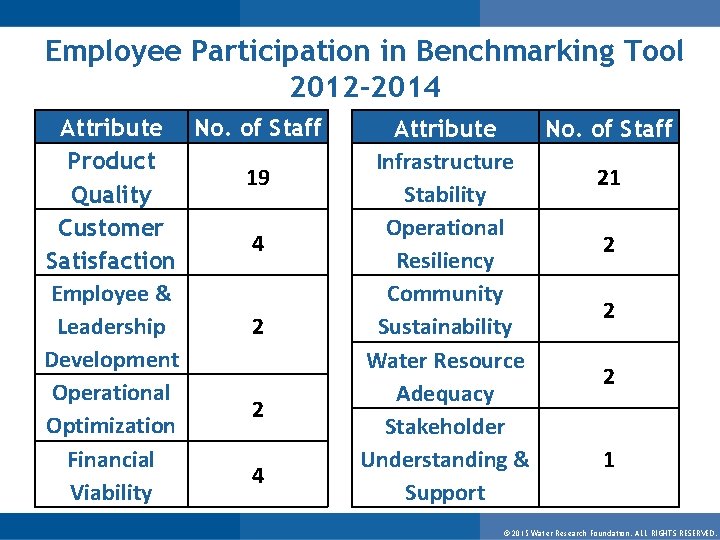
Employee Participation in Benchmarking Tool 2012 -2014 Attribute No. of Staff Product 19 Quality Customer 4 Satisfaction Employee & 2 Leadership Development Operational 2 Optimization Financial 4 Viability Attribute No. of Staff Infrastructure 21 Stability Operational 2 Resiliency Community 2 Sustainability Water Resource 2 Adequacy Stakeholder 1 Understanding & Support © 2015 Water Research Foundation. ALL RIGHTS RESERVED.
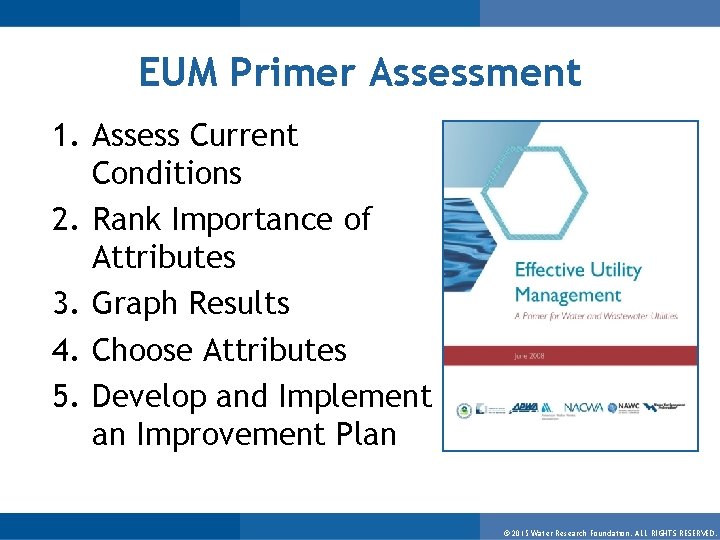
EUM Primer Assessment 1. Assess Current Conditions 2. Rank Importance of Attributes 3. Graph Results 4. Choose Attributes 5. Develop and Implement an Improvement Plan © 2015 Water Research Foundation. ALL RIGHTS RESERVED.
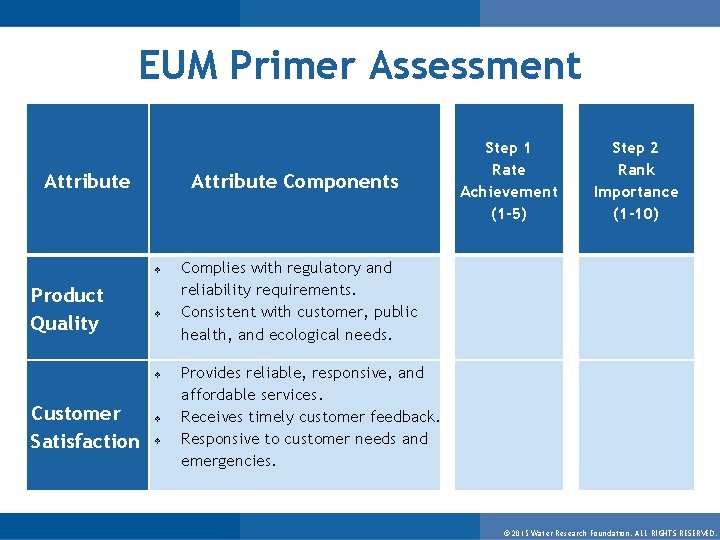
EUM Primer Assessment Attribute Components Product Quality Customer Satisfaction Step 1 Rate Achievement (1 -5) Step 2 Rank Importance (1 -10) Complies with regulatory and reliability requirements. Consistent with customer, public health, and ecological needs. Provides reliable, responsive, and affordable services. Receives timely customer feedback. Responsive to customer needs and emergencies. © 2015 Water Research Foundation. ALL RIGHTS RESERVED.
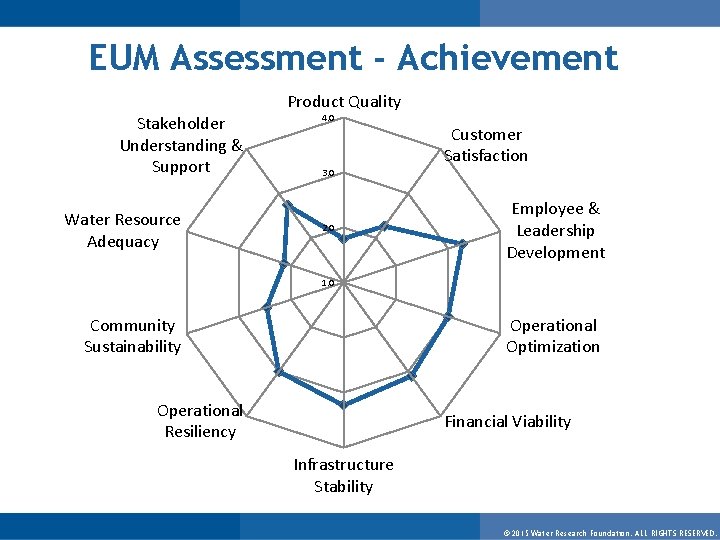
EUM Assessment - Achievement Stakeholder Understanding & Support Water Resource Adequacy Product Quality 4. 0 Customer Satisfaction 3. 0 2. 0 Employee & Leadership Development 1. 0 Community Sustainability Operational Optimization Operational Resiliency Financial Viability Infrastructure Stability © 2015 Water Research Foundation. ALL RIGHTS RESERVED.
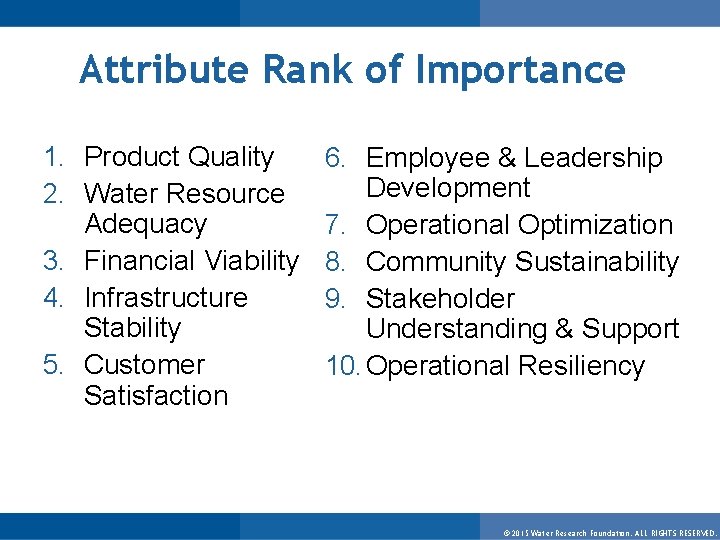
Attribute Rank of Importance 1. Product Quality 2. Water Resource Adequacy 3. Financial Viability 4. Infrastructure Stability 5. Customer Satisfaction 6. Employee & Leadership Development 7. Operational Optimization 8. Community Sustainability 9. Stakeholder Understanding & Support 10. Operational Resiliency © 2015 Water Research Foundation. ALL RIGHTS RESERVED.
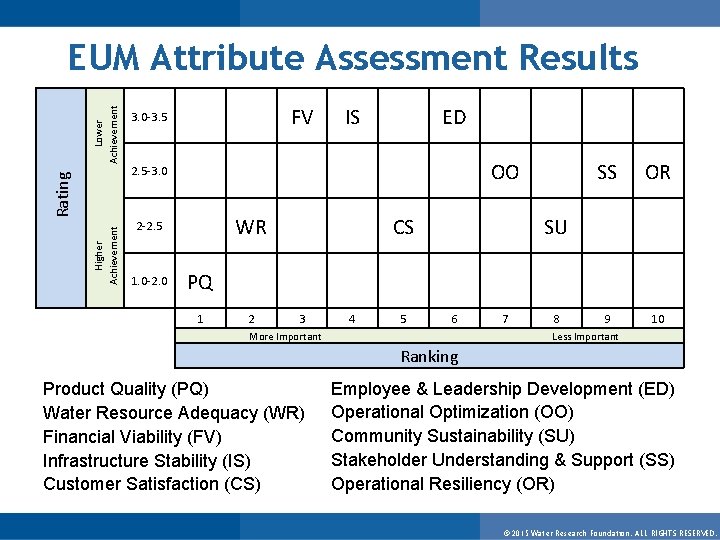
Higher Achievement Rating Lower Achievement EUM Attribute Assessment Results FV 3. 0 -3. 5 IS ED OO 2. 5 -3. 0 WR 2 -2. 5 1. 0 -2. 0 CS SS OR 9 10 SU PQ 1 2 3 4 5 6 More Important 7 8 Less Important Ranking Product Quality (PQ) Water Resource Adequacy (WR) Financial Viability (FV) Infrastructure Stability (IS) Customer Satisfaction (CS) Employee & Leadership Development (ED) Operational Optimization (OO) Community Sustainability (SU) Stakeholder Understanding & Support (SS) Operational Resiliency (OR) © 2015 Water Research Foundation. ALL RIGHTS RESERVED.
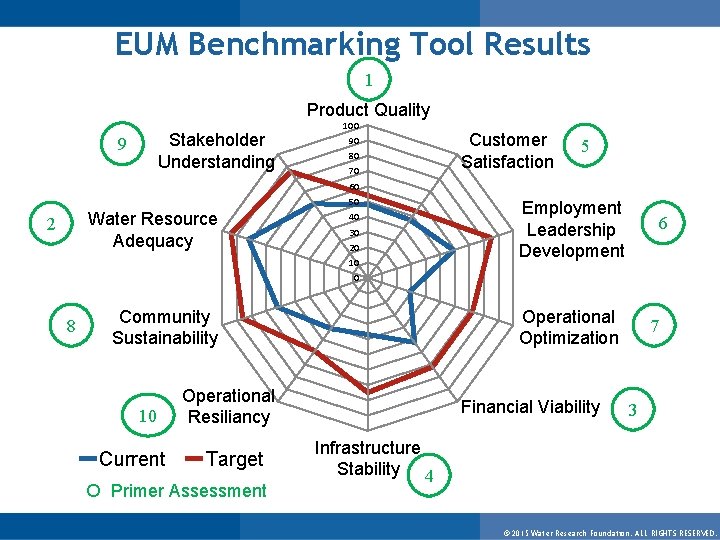
EUM Benchmarking Tool Results 1 Product Quality Stakeholder Understanding 9 100 90 80 70 Customer Satisfaction 5 60 50 Water Resource Adequacy 2 40 30 20 10 Employment Leadership Development 6 0 8 Community Sustainability 10 Current Operational Optimization Operational Resiliancy Target Primer Assessment Financial Viability 7 3 Infrastructure Stability 4 © 2015 Water Research Foundation. ALL RIGHTS RESERVED.
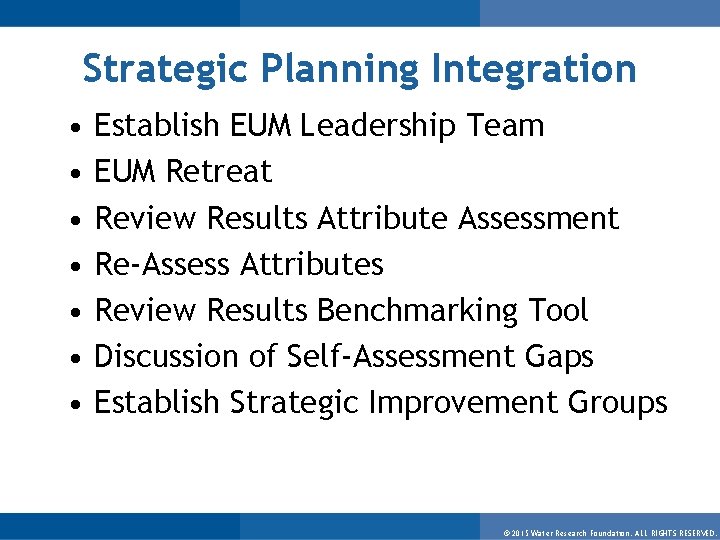
Strategic Planning Integration • • Establish EUM Leadership Team EUM Retreat Review Results Attribute Assessment Re-Assess Attributes Review Results Benchmarking Tool Discussion of Self-Assessment Gaps Establish Strategic Improvement Groups © 2015 Water Research Foundation. ALL RIGHTS RESERVED.
Thank You Comments or questions, please contact: Frank Roth Albuquerque Bernalillo County Water Utility Authority froth@abcwua. org (505) 289 -3102 For more information visit: www. waterrf. org © 2015 Water Research Foundation. ALL RIGHTS RESERVED.
- Slides: 22