
Project Control and Process Automation Software Management Disciplines
- Slides: 19
Project Control and Process Automation Software Management Disciplines (from Part III, Chapter 13 of Royce’ book)
Topics for Today • • • Seven Core Metrics Management Indicators Quality Indicators Life Cycle Expectations Pragmatic Software Metrics Automation
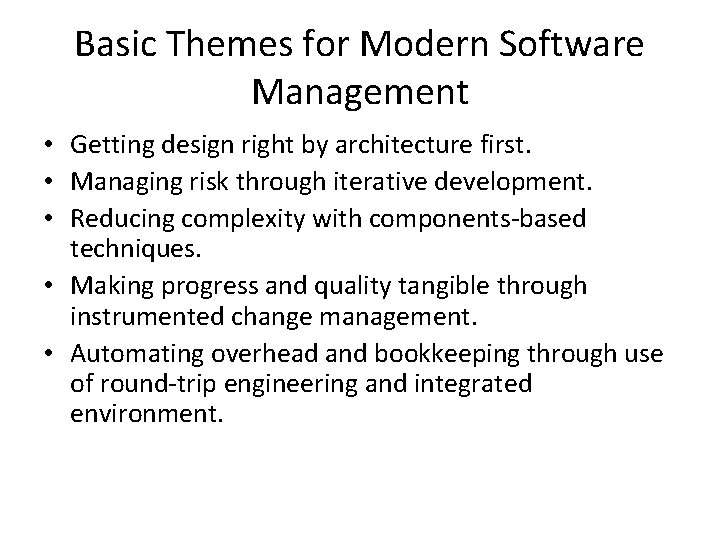
Basic Themes for Modern Software Management • Getting design right by architecture first. • Managing risk through iterative development. • Reducing complexity with components-based techniques. • Making progress and quality tangible through instrumented change management. • Automating overhead and bookkeeping through use of round-trip engineering and integrated environment.
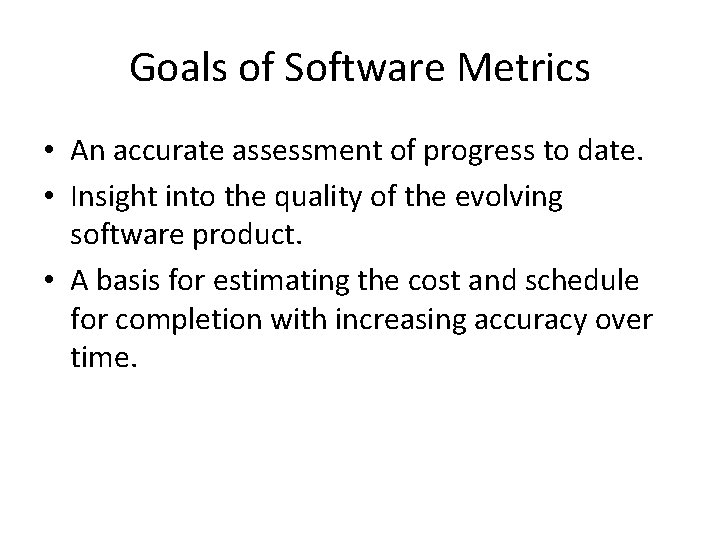
Goals of Software Metrics • An accurate assessment of progress to date. • Insight into the quality of the evolving software product. • A basis for estimating the cost and schedule for completion with increasing accuracy over time.
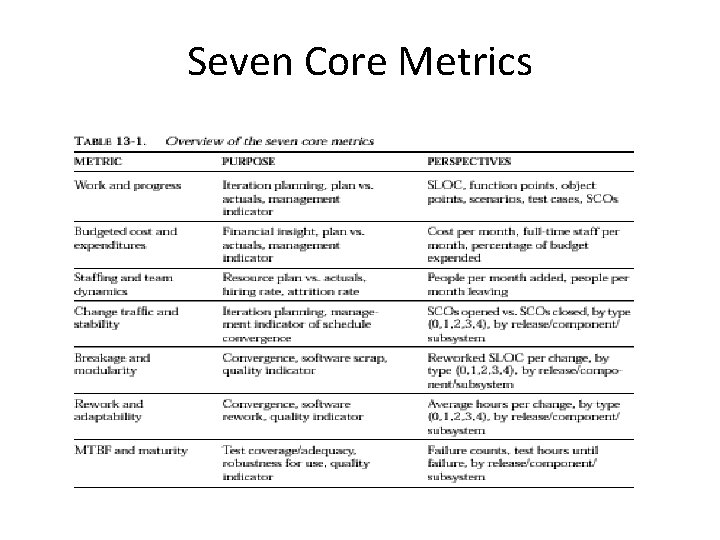
Seven Core Metrics
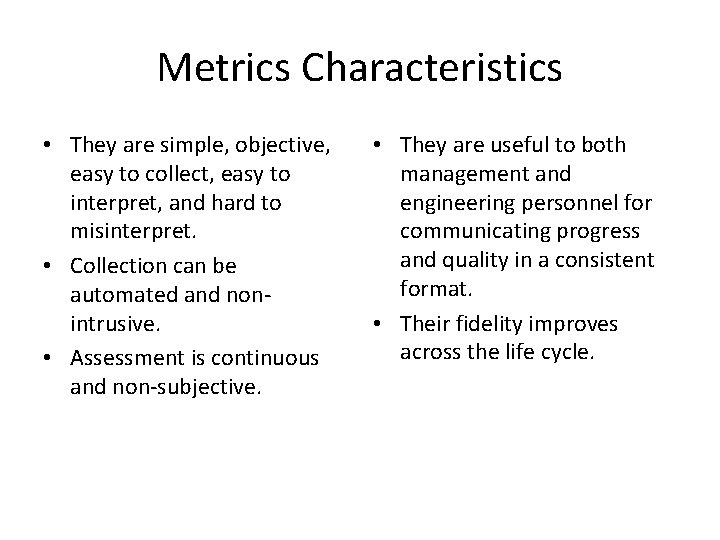
Metrics Characteristics • They are simple, objective, easy to collect, easy to interpret, and hard to misinterpret. • Collection can be automated and nonintrusive. • Assessment is continuous and non-subjective. • They are useful to both management and engineering personnel for communicating progress and quality in a consistent format. • Their fidelity improves across the life cycle.
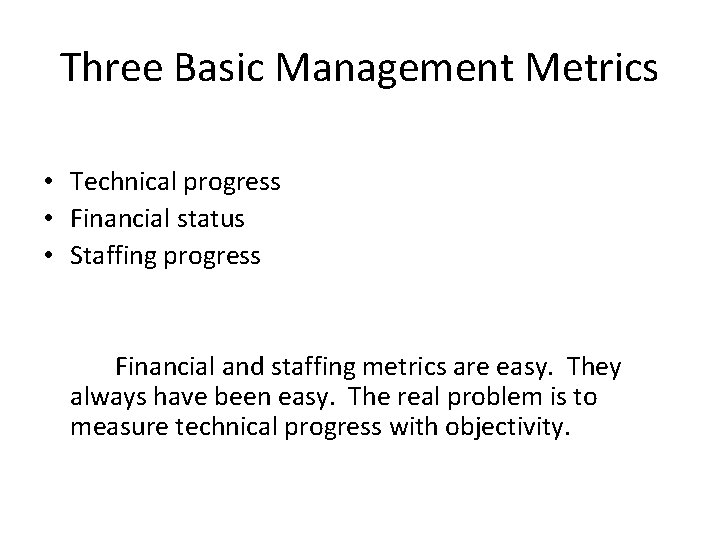
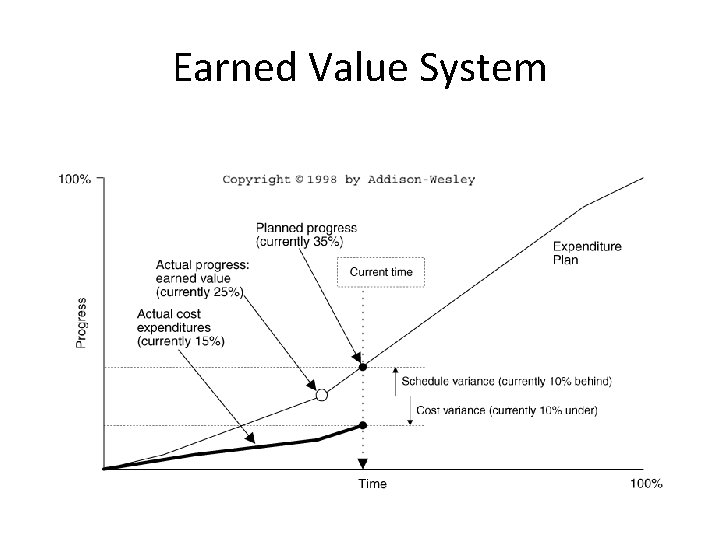
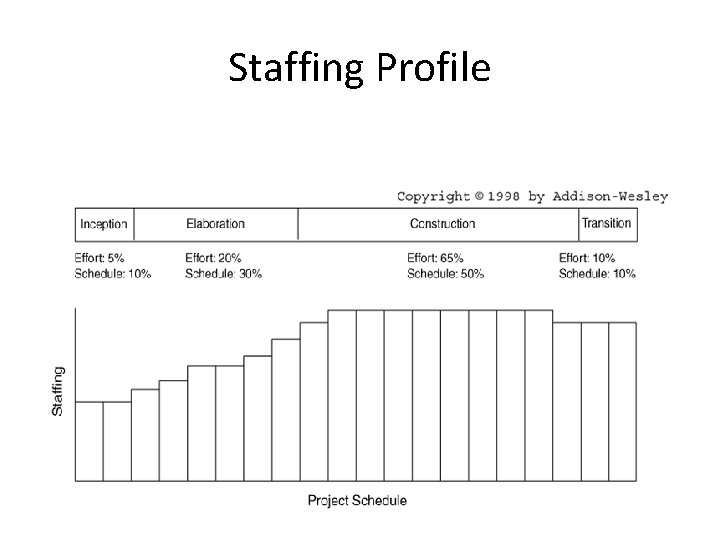
Three Basic Management Metrics • Technical progress • Financial status • Staffing progress Financial and staffing metrics are easy. They always have been easy. The real problem is to measure technical progress with objectivity.
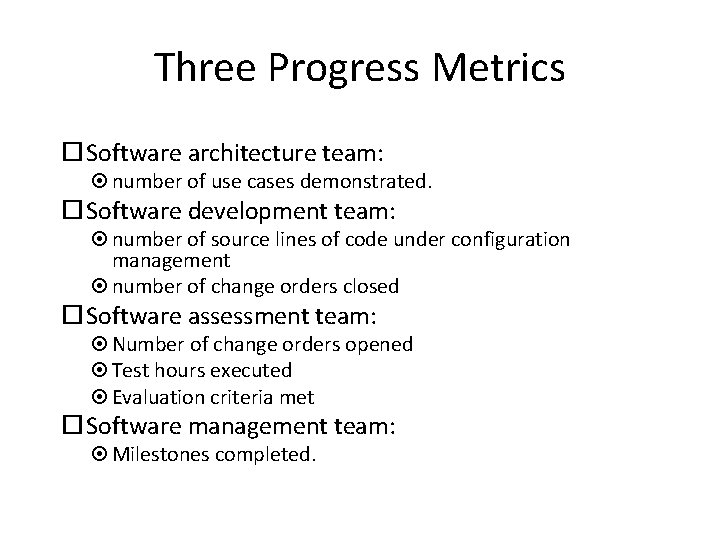
Three Progress Metrics Software architecture team: number of use cases demonstrated. Software development team: number of source lines of code under configuration management number of change orders closed Software assessment team: Number of change orders opened Test hours executed Evaluation criteria met Software management team: Milestones completed.
Earned Value System
Staffing Profile
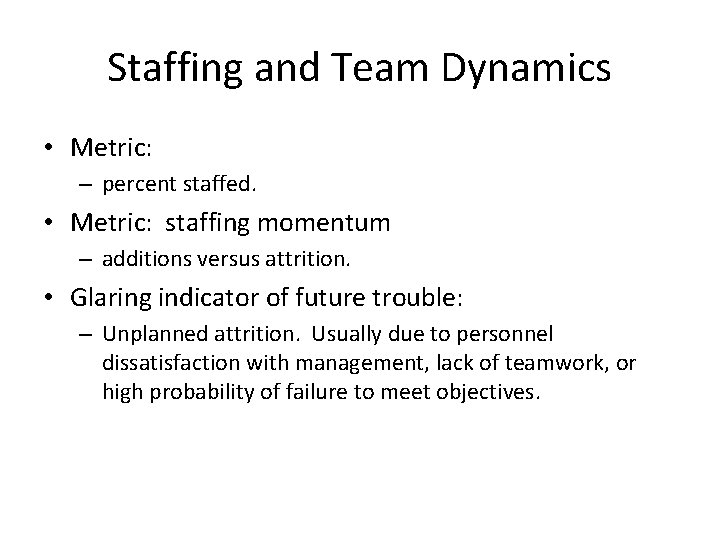
Staffing and Team Dynamics • Metric: – percent staffed. • Metric: staffing momentum – additions versus attrition. • Glaring indicator of future trouble: – Unplanned attrition. Usually due to personnel dissatisfaction with management, lack of teamwork, or high probability of failure to meet objectives.
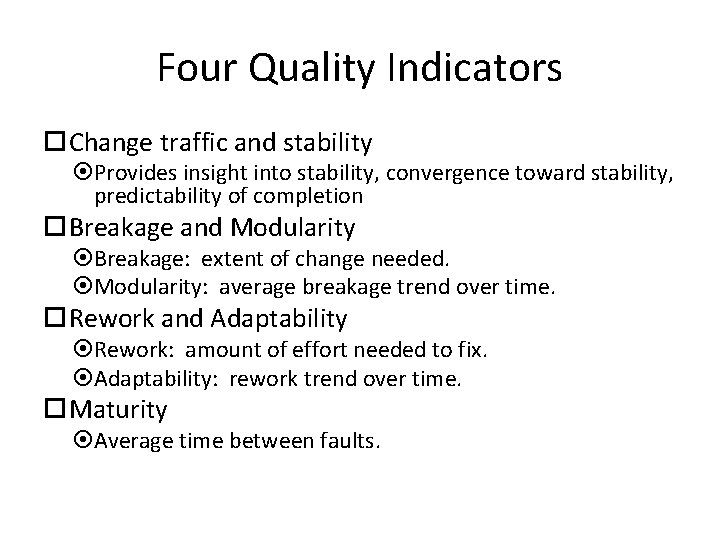
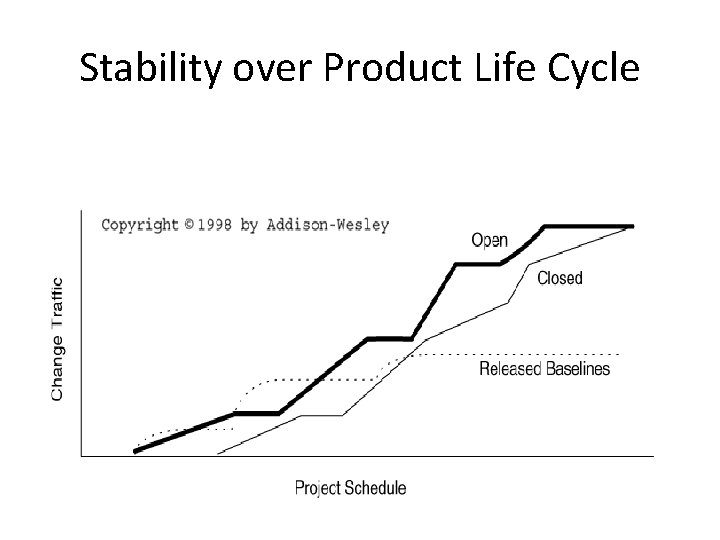
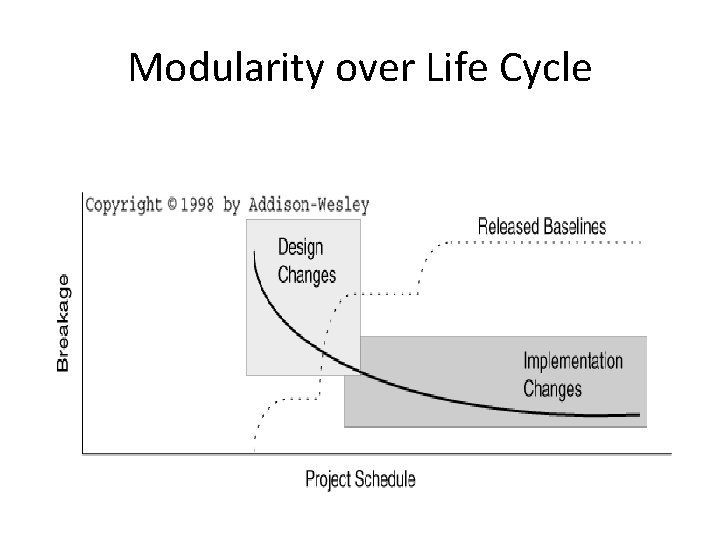
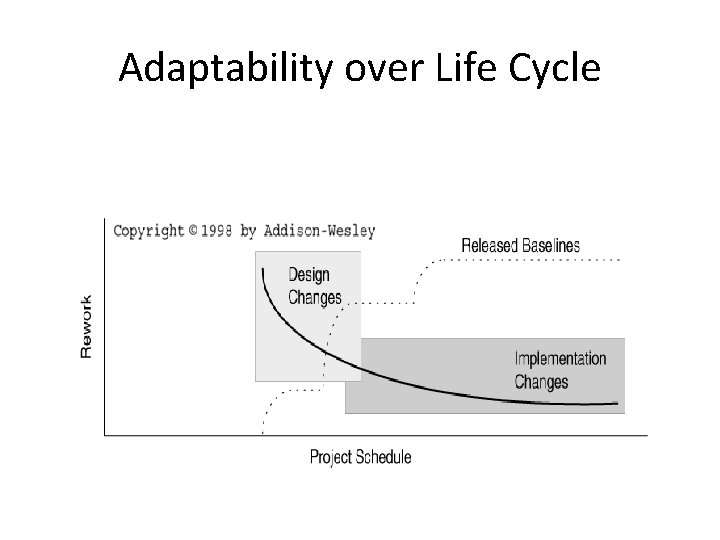
Four Quality Indicators Change traffic and stability Provides insight into stability, convergence toward stability, predictability of completion Breakage and Modularity Breakage: extent of change needed. Modularity: average breakage trend over time. Rework and Adaptability Rework: amount of effort needed to fix. Adaptability: rework trend over time. Maturity Average time between faults.
Stability over Product Life Cycle
Modularity over Life Cycle
Adaptability over Life Cycle
Quality Indicator Characteristics • They are derived from the evolving products, not other artifacts. • They provide insight into waste. • They are dynamic for an iterative process. Focus is on trends and changes in time. • Combination of current value and trends provide tangible indicators for effective management action.
Metrics Evolution over Life Cycle
Comment on Metrics • Metrics usually display the effects of problems, not the underlying causes of problems. Reasoning and synthesis are required for solution. • Although measuring is useful, it doesn’t do any thinking for the decision makers. – Value judgments can not be make by metrics; they must be left to smarter entities such as software project managers. • However, metrics can provide data to help ask the right questions, understand the context, and make objective decisions.
Metrics Automation – the Software Project Control Panel • On-line version of status of artifacts. – Display panel that integrates data. A “dashboard”. – Display for – • • project manager (overall values) test manager (status of an upcoming release) Configuration Manager (change traffic) etc.