PROPERTIES OF MEDICAL PLANTS RELATED TO NIR SPECTROSCOPY


- Slides: 25

PROPERTIES OF MEDICAL PLANTS RELATED TO NIR SPECTROSCOPY Marija Jakelić, Maja Benković, Tamara Jurina, Ana Jurinjak Tušek, Davor Valinger, Jasenka Gajdoš Kljusurić* 7 th World Congress on Healthcare & Technologies September 26 -27, 2016 London, UK

Medical plants p source of bioactive components Water extracts of medicinal plants p 6 widely spread medicinal plant extracts from botanically distinct origins p p properties of the plants p. H & d. m. p content of polyphenols & AO p Conductivity & TDS p NIR spectra p

Medical plants p Mellisa (Melissa officinalis) p Sage (Salvia officinalis) p p Garden Thyme (Thymus serpyllum) p St. John's wort (Hypericum perforatum) p Marigold (Calendula officinalis) Lavender (Lavandula)

Polyphenols

p The vast abundance of scientific data on the bioactive, especially polyphenolic fingerprints of different medicinal plants often require difficult and time-demanding pursuits

Plant material p Medicinal plants n n • originating from the north-eastern (Žumberak, Croatia) and coastal regions (Dalmatia) of Croatia collected in 2015, dried and supplied by local herbalists p The homogenicity of samples ensured by the proper sampling and adequate (large) quantity of plant material Preparation of medicinal plant extracts n simulated household preparation conditions, n a simple, conventional aqueous extraction of medicinal plants was conducted. n Extraction p was carried out by pouring V = 100 m. L of distilled water heated to T = 80 °C over m = 2 g of ground tea, for t = 30 min p filtered through a tea strainer

Properties (1) p p. H n p Extraction yield n n p measured by p. H meter expressed as the dry matter content of the extracts dry matter was determined by a standard AOAC method(AOAC, 1995) Electrical Conductivity & TDS n monitored at room temperature using a TDS/conductivity meter All measurements were done in triplicate

Properties (2) p Total phenolic content n determined following the modified method of Singleton and Rossi p p The values are expressed in mg of Gallic acid equivalents (GAE) per 100 g of fresh mass using Gallic acid standard curve (0– 500 mg/L) Antioxidant capacity as DPPH radical scavenging activity n spectrophotometric measurements, which were performed by the UV-Vis spectrophotometer 2, 2 -diphenyl-1 -picrylhydrazil radical (DPPH˙) using the method proposed by Brand-Williams et al. p Final results are expressed in mmol of TE per 1 g of mass p

Properties (3) p. Inhibition time during Briggs. Rauscher reaction n oscillating reaction is based on the reactions of three colourless solutions that are prepared and mixed as proposed by Cervelati et al. total volume of the BR mixture (15 m. L). BR reaction is potentiometrically monitored using a combined platinum electrode and the inhibition time (IT) IT linearly depends on the concentration of the added antioxidant p recalculated oscillation quenching using a standard solution (GA) –> RAC p

DPPH vs BR inhibition time

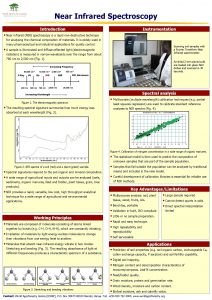
NIR measurements p Range: from 904 nm to 1699 nm n Medicinal plant extracts (V = 1 m. L) were dispensed in quartz cuvette and three consecutive runs for every extract were initially recorded across the entire spectral range at 1 nm intervals the arithmetic averages of three measurements were computed p data obtained were used to perform principal component analysis (PCA) and Partial least squares regression (PLS) p

NIR

Results

Basic properties Medical plant St. John's wort p. H T (°C) % d. m. Polyphenols (mg/g) AO (mmol/g) BR- AO (mg/g) 5. 18 24. 4 0. 4104 33. 46 0. 290 152. 61 Sage 6. 20 24. 2 0. 5344 29. 81 0. 228 218. 34 Lavender 5. 53 24. 4 0. 3964 15. 46 0. 081 320. 03 Thyme 6. 61 24. 2 0. 4340 43. 50 0. 312 264. 43 Melissa 6. 38 24. 7 0. 5021 60. 46 0. 445 344. 51 Marigold 5. 36 24. 7 0. 5038 14. 34 0. 129 128. 28

Conductivity and TDS 1000 1800 TDS 800 1600 700 1400 600 1200 500 1000 400 800 300 600 200 400 100 200 0 0 St. John's Sage wort Lavender Thyme Melissa Marigold Conductivity (µS/cm) TDS (mg/L) 900 2000

NIR spectra 3. 000 Lavender Marigold St. John's wort Thyme Melissa Sage log 1/R 2. 000 1. 000 900 1000 1100 1200 1300 1400 1500 1600 1700 (nm)

PCA Biplot (axes D 1 and D 2: 80. 99 %) 2. 000 Marigold Conductivity TDS % d. m. D 2 (39. 39 %) 1. 000 Melissa Sage p. H . 000 Thyme Lavender Polyphenols BR- AO St. John's wort -1. 000 AO T (°C) -2. 000 -2 -1 0 D 1 (41. 60 %) 1 2

NIR spectra PLS models (expected analytical parameter) Analytical data

Chemometric analysis p PCA n used for identifying patterns in data and displaying the data in order to highlight similarities and differences p n p represents the pattern of similarity of the observations and the variables by displaying them as points in maps PLSR n n which is a technique that generalizes and combines features from principal component analysis and multiple regression was used to predict and analyze a set of dependent variables from a set of independent variables or predictors. Calibration and validation p § p Its goal is to extract the important information from the data table and to express this information as a set of new orthogonal variables called principal components or factors. conducted for medical plant extract spectra respectively. As the first group of scattercorrective pre-processing method was used the Standard Normal Variate (SNV) followed by the Savitzky-Golay (SG) polynomial derivative Filter data set § divided into calibration set and validation set. PLSR model performance was assessed p R 2 ; RMSEC and RMSEP; RPD; RER

Models observed component and spectra p. H 0, 999 0, 011 0, 985 TDS (mg/L) 0, 996 2, 246 Conductivity (µs/cm) 0, 994 Dry matter (%) Calibration Prediction RPD RER 0, 065 8, 3 18, 1 0, 998 9, 705 21, 3 62, 4 29, 183 0, 994 28, 31 14, 0 42, 1 0, 999 0, 001 0, 995 0, 004 13, 7 31, 9 Polyphenols (mg/g) 0, 999 0, 175 0, 990 1, 577 10, 5 29, 2 AO (mmol/g) 0, 949 0, 027 0, 959 0, 024 5, 0 15, 1 BR- AO (mg/g) 0, 994 6, 0831 0, 993 6, 836 11, 9 28, 0 RMSECV RMSEP

FAILURE SUCCESS

3. 000 p. H T (°C) % d. m. St. John's wort 5. 18 24. 4 0. 4104 33. 46 AO (mmol/g) BR- AO (mg/g) 0. 290 152. 61 Sage 6. 20 24. 2 0. 5344 29. 81 0. 228 218. 34 Lavender 5. 53 24. 4 0. 3964 15. 46 0. 081 320. 03 Thyme 6. 61 24. 2 0. 4340 43. 50 0. 312 264. 43 Melissa 6. 38 24. 7 0. 5021 60. 46 0. 445 344. 51 Marigold 5. 36 24. 7 0. 5038 14. 34 0. 129 128. 28 Lavender Marigold St. John's wort Thyme 2. 000 Melissa log 1/R Medical plant Polyphenols (mg/g) Sage 1. 000 900 1000 1100 1200 1300 1400 1500 1600 1700 (nm) PCA, PLSR n = 805; m = 25 observed component and spectra Biplot (axes D 1 and D 2: 80. 99 %) 2. 000 Marigold Conductivity TDS % d. m. D 2 (39. 39 %) 1. 000 Melissa Sage p. H AO Polyphenols . 000 St. John's wort -1. 000 Thyme BR- AO Lavender T (°C) -2. 000 -2 -1 0 D 1 (41. 60 %) 1 2 Prediction RMSEP RPD RER p. H 0, 985 0, 065 8, 3 18, 1 TDS (mg/L) 0, 998 9, 705 21, 3 62, 4 Conductivity (µs/cm) 0, 994 28, 31 14, 0 42, 1 Dry matter (%) 0, 995 0, 004 13, 7 31, 9 Polyphenols (mg/g) 0, 990 1, 577 10, 5 29, 2 AO (mmol/g) 0, 959 0, 024 5, 0 15, 1 BR- AO (mg/g) 0, 993 6, 836 11, 9 28, 0


Conclusions p Multivariate tools n p PCA was successful n n p (NIR) spectra vs. analytical parameters PC 1 & PC 2 > 80 % correlations PLSR models were successful p p p n R 2 > 0. 95 Majority, RPD > 8 Majority, RER > 15 obtained results confirmed that NIR spectroscopy coupled with multivariate analysis is a promising technique for rapid and environmentally friendly measurements allowing good calibration, validation and possible prediction of the observed parameters

PROPERTIES OF MEDICAL PLANTS RELATED TO NIR SPECTROSCOPY Marija Jakelić, Maja Benković, Tamara Jurina, Ana Jurinjak Tušek, Davor Valinger, Jasenka Gajdoš Kljusurić* Acknowledgements p This presentation is a contribution to the project „Application of microreactors in the analysis of antioxidant activity of medicinal plants: MICRO-AA“, (HR. 3. 2. 01 -0069) n funded by the European Social Fund (ESF) through the Human Resources Development program 7 th World Congress on Healthcare & Technologies September 26 -27, 2016 London, UK
 Near infrared spectroscopy instrumentation
 Physical fitness is of two types related and related
 Skills related
 Nir shavit
 Nir ap human geography
 Nir bitansky
 What is nir
 Nir shavit
 Edo liberty
 Numéro nir
 Laboratorio standard latte
 Nir.bgazrt.hu
 Nir shafrir
 Redox ladder
 Nir taube
 Nir shavit mit
 Nir mir
 Jordens klima
 Itamar gilad
 Paranin adalah
 Nir krakauer
 Nir friedman weizmann
 Nir ailon
 Nir kshetri
 Crude birth rate ap human geography
 Cisco aci network insights
