Page Tuning What Is Page Tuning The page



- Slides: 16

Page Tuning

What Is Page Tuning? The page tuning process allows you to examine download times of each element on a page at a timing resolution of milliseconds. This enables you to tweak each element of the page to achieve a download time threshold.

What Results Are Produced? A Page Tuning test can be represented in a graphical bar chart, making it extremely easy to pick out elements that are taking more time to download.

How Is A Page Tuning Test Performed? The Page Tuning process uses e. Valid Detailed Logging functions to record each page element that is loaded into the browser.

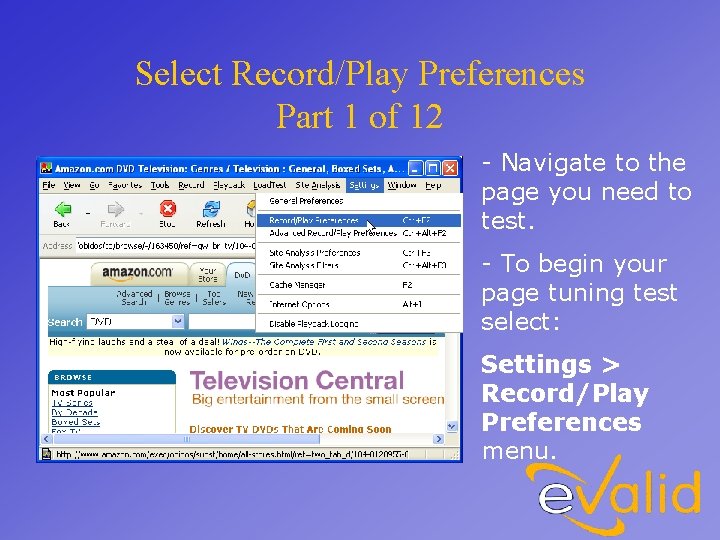
Select Record/Play Preferences Part 1 of 12 - Navigate to the page you need to test. - To begin your page tuning test select: Settings > Record/Play Preferences menu.

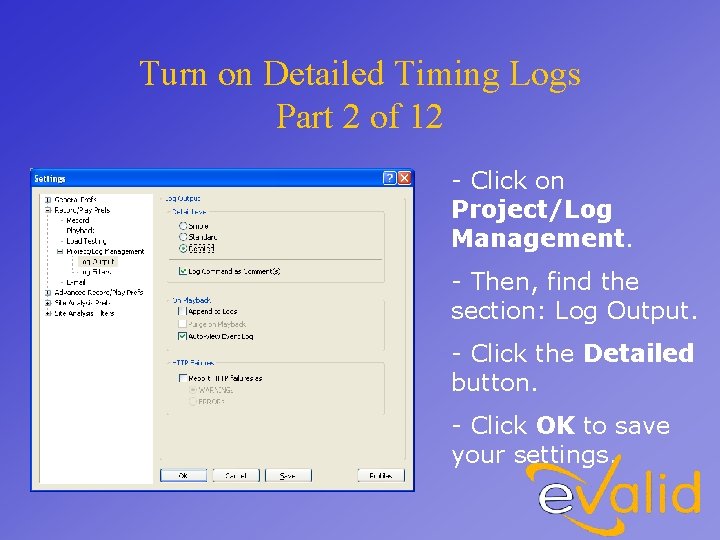
Turn on Detailed Timing Logs Part 2 of 12 - Click on Project/Log Management. - Then, find the section: Log Output. - Click the Detailed button. - Click OK to save your settings.

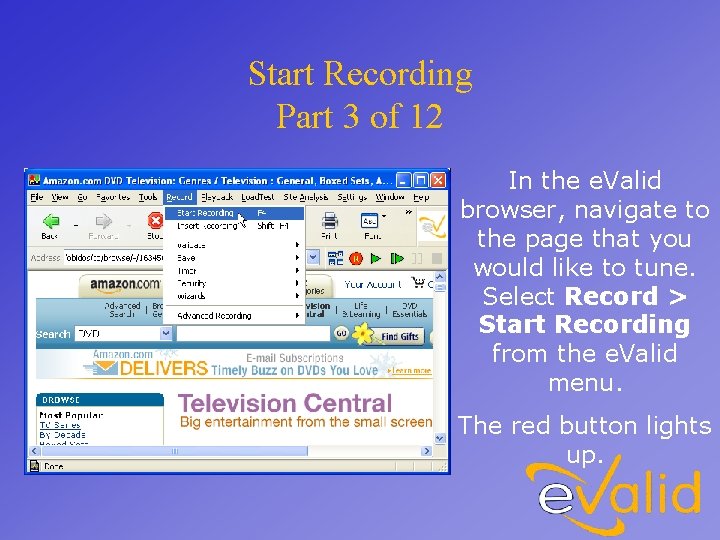
Start Recording Part 3 of 12 In the e. Valid browser, navigate to the page that you would like to tune. Select Record > Start Recording from the e. Valid menu. The red button lights up.

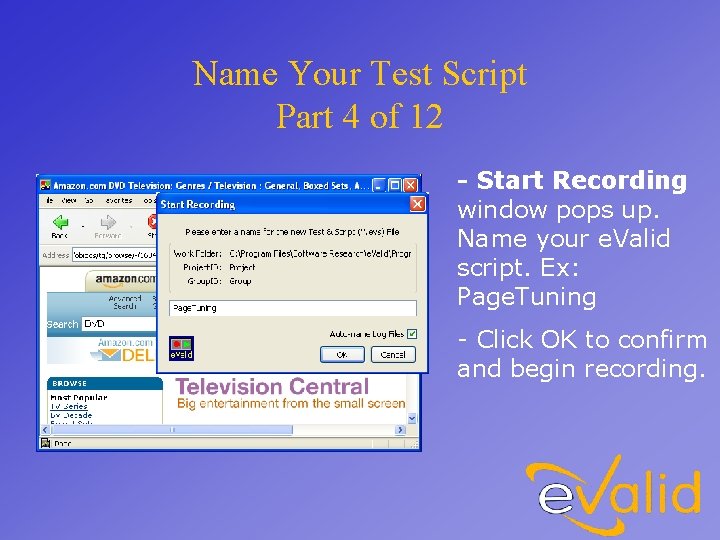
Name Your Test Script Part 4 of 12 - Start Recording window pops up. Name your e. Valid script. Ex: Page. Tuning - Click OK to confirm and begin recording.

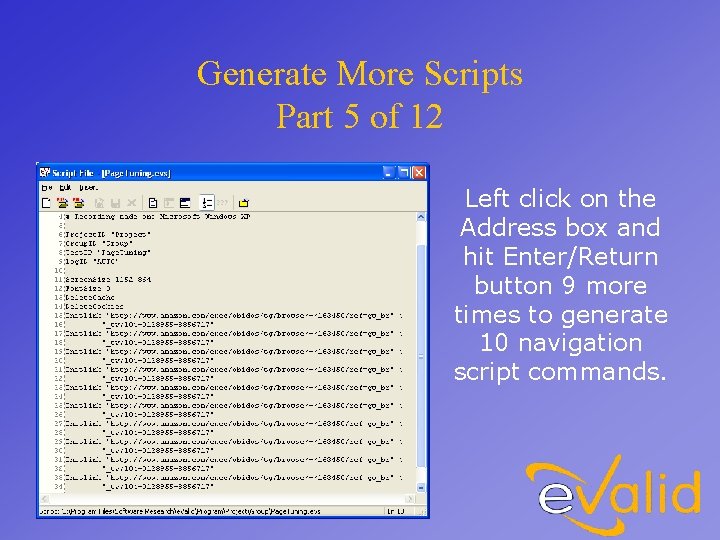
Generate More Scripts Part 5 of 12 Left click on the Address box and hit Enter/Return button 9 more times to generate 10 navigation script commands.

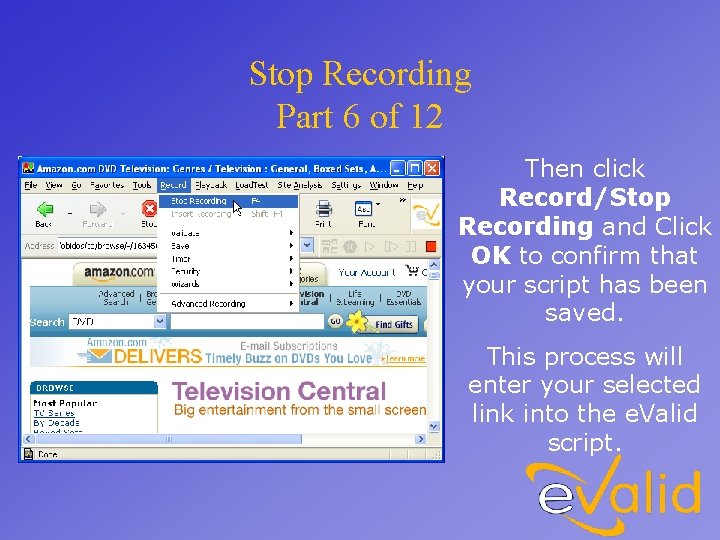
Stop Recording Part 6 of 12 Then click Record/Stop Recording and Click OK to confirm that your script has been saved. This process will enter your selected link into the e. Valid script.

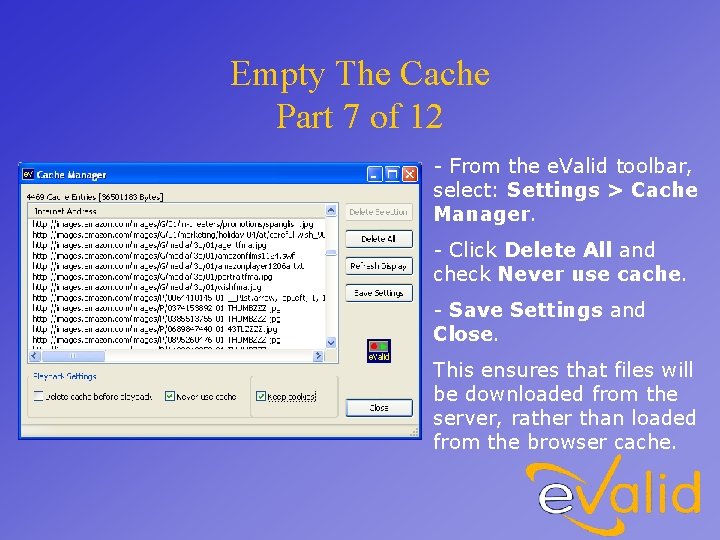
Empty The Cache Part 7 of 12 - From the e. Valid toolbar, select: Settings > Cache Manager. - Click Delete All and check Never use cache. - Save Settings and Close. This ensures that files will be downloaded from the server, rather than loaded from the browser cache.

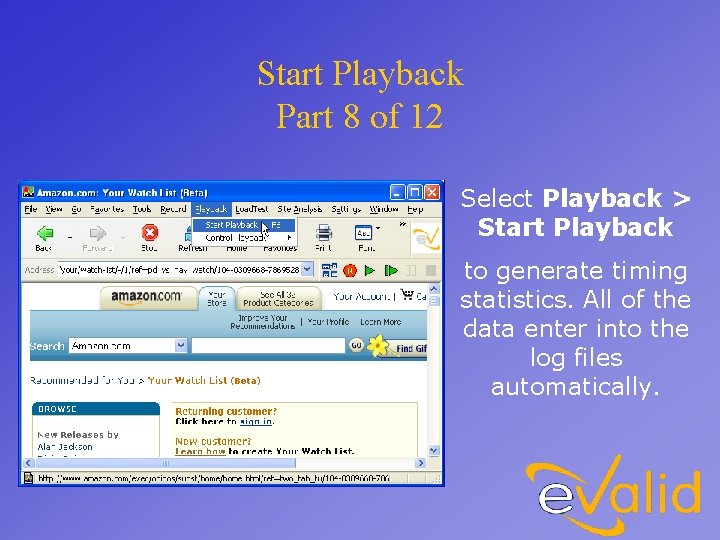
Start Playback Part 8 of 12 Select Playback > Start Playback to generate timing statistics. All of the data enter into the log files automatically.

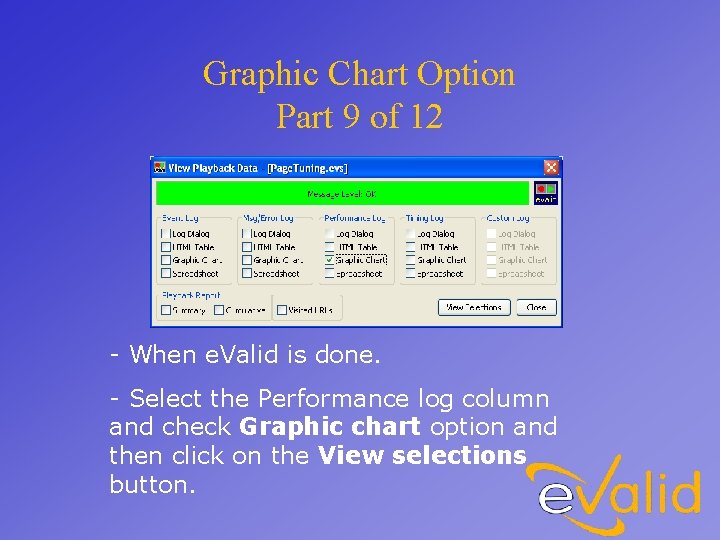
Graphic Chart Option Part 9 of 12 - When e. Valid is done. - Select the Performance log column and check Graphic chart option and then click on the View selections button.

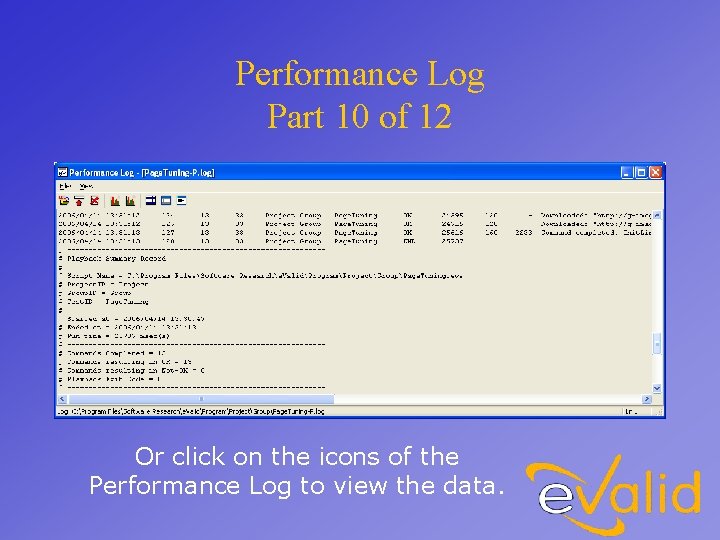
Performance Log Part 10 of 12 Or click on the icons of the Performance Log to view the data.

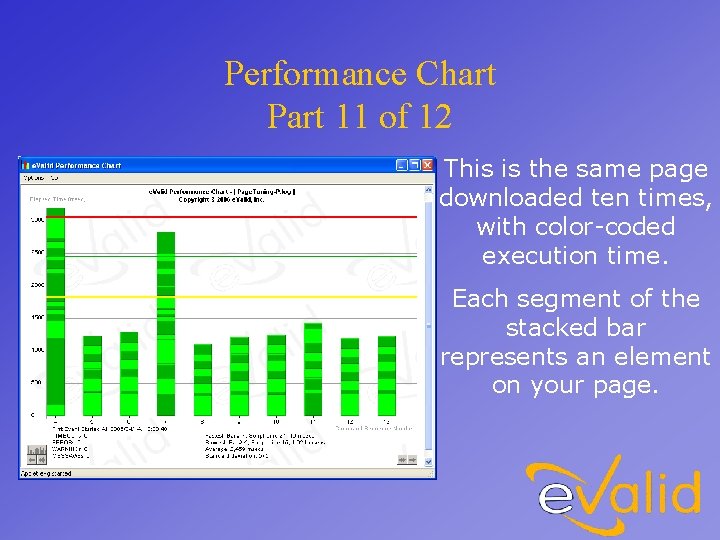
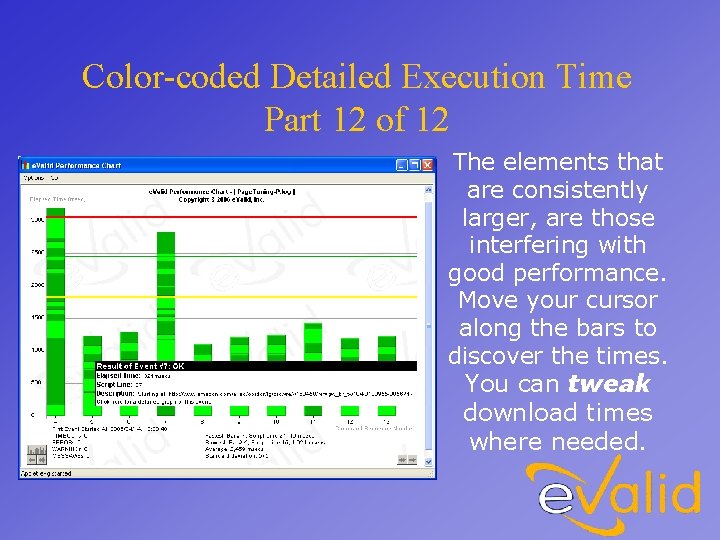
Performance Chart Part 11 of 12 This is the same page downloaded ten times, with color-coded execution time. Each segment of the stacked bar represents an element on your page.

Color-coded Detailed Execution Time Part 12 of 12 The elements that are consistently larger, are those interfering with good performance. Move your cursor along the bars to discover the times. You can tweak download times where needed.