Next Generation Solutions for Small Group Health Plans


 $9, 990 person")


")
 With level-funded plans, good risks")
 Medicare or some other reimbursement framework established by")


")
 Educate Agents and Staff Educate")


 C P D y db Co")


 • • Individual")

 Skills Health Insurance")


- Slides: 57
Next Generation Solutions for Small Group Health Plans One Hour CE Creative concepts to restore affordability 11844 s 1017
Daniel R. Meylan National Sales Director - Allied National • • Insurance Professional Since 1973 P&C and Benefits Broker Company Senior Executive Agency Principle & Senior Executive Agency Acquisitions and Valuations Self Insurance, Captives, RRGs Husband, Father, Grandfather
How Would You Define “Affordable” Health Care?
How Would You Define “Affordable” Health Care? How do We Achieve “Affordable” Health Care?
Solving the Affordability Challenge Why are health care costs increasing? 5 COST CUTTING SOLUTIONS 1. Level Funding 2. Reference Based Pricing 3. Direct Primary Care 4. Solutions for the individual market 5. The New Healthcare Adviser
What is “Trend? “Trend” is the actual annual rate of increase of the cost of health care in the United States.
2016 Milliman Study of Health Care Costs Projected Family Cost by 2020 = $31, 267
Health Care Cost Projections “Employee Only” Rate Illustration $700 $600 $500 nsur I y l l Fu A 7 AC 1 0 2 2016 hocks S Rate Trend Level-Funded Costs After refunds $400 $300 2015 ed 2016 2017 Year 2018 2019 This sample chart illustration is provided for educational purposes only. Actual results may vary and are not indicative of future performance. Allied National, Inc. l 4551 W. 107 th St. Suite 100 l Overland Park, KS 66207 l 888 -767 -7133 l sales@alliednational. com l www. alliednational. com l twitter. com/alliednational 2020
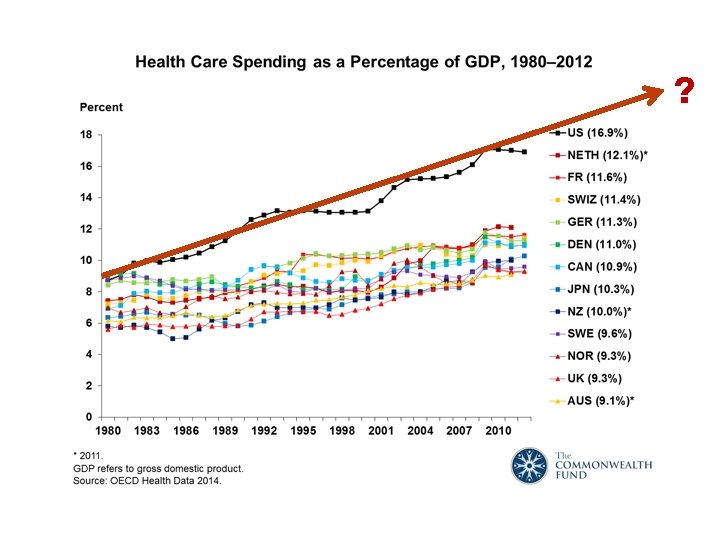
2016 Health Care Spending • • $3, 300, 000, 000 (Trillion) $9, 990 person 17. 8% of GDP Projected Annual Growth – 5. 7%
Health Care Cost Drivers 1. Business Practices – 2. Drug Costs – 3. Transparency – 4. Litigation – 5. Wellness – 6. Media Distortions – 7. Consumer Education – 8. Technology – 9. Aging Population – Marginal business practices of government, insurance companies, providers and medical vendors Mercenary pricing Lack of transparency with actual costs and appropriate profit margins The threat of litigation drives costs through redundant “defensive” medical practices and malpractice insurance costs Unhealthy lifestyles choices 10. Government – Promoting an entitlementality… “Free” is not “Free” Lack of informed medical consumers State-of-the-art medical technology prolongs life Baby boomer generation experiencing deteriorating health Cost of Compliance for ACA, EHR and additional taxes 11. Politics – Marketplace volatility driven by political uncertainty 12. Catastrophic Claims – Unlimited lifetime benefits driving cost increases
Impact of Catastrophic Claims From 2017 Forward With the elimination of maximum lifetime benefits under the ACA, catastrophic claims have become a primary driver of increasing health care costs as stop-loss carriers and reinsurers seek adequate premiums to cover these unlimited catastrophic claims. Unlimited lifetime maximums will drive much of the premium rate increases in the future. WILL LIMITED MAXIMUM LIFETIME BENEFITS COME BACK?
Small Group Plans – The Real Competitor Affordability!!! • At what point does the employer say “No more plan? ” • At what point does the employee say: “Take me off the plan? ” • At what point will the broker run out of affordable solutions for their client, the small employer?
5 Affordability Solutions!!!
Solution #1 Level Funding Fully Insured • Risk bearer is the insurance company • All RISK transfers to insurance company Self Funded & Level Funded • Employer is the risk bearer! • Claims paid from employer’s claims fund • Employer hires/assigns a claims administrator to pay claims • Employer purchases stop-loss insurance to limit risk
Why Level Funding ? Long Term – It’s the most cost effective way to finance a group health plan • Reduces insurance company profit • Eliminates state insurance premium taxes • Eliminates state benefit mandates • Allows employer to take control of group benefit plan Money not spent on claims belongs to the employer – not the insurance company Avoids many negative impacts of ACA
Level Funding for Small Employers Self Funding • The Employer’s ultimate costs are variable and unknown and based entirely on the cost of claims • Typical for employers with 100 FTES or more Level Funding • Employer’s ultimate costs are capped and limited to a specified dollar amount • Employers liability in a level-funded plan is capped at 12 monthly payments. • Available for groups as small as 2 lives
Stop-Loss Insurance Employer’s risk is limited by: Specific Stop-Loss • Claims paid by carrier when an individual’s claims exceed a set dollar amount Aggregate Stop-Loss • Claims paid by carrier when the group’s total claims exceed a set dollar amount
A Level-Funded Solution (Refund)
Level-Funded Plans are Medically Underwritten (back to the future!) With level-funded plans, good risks receive favorable rates, poor risks are declined; the best risks will have an opportunity to participate in the underwriting profits generated by their group.
Solution #2 Reference-Based Pricing (No networks!) Medicare or some other reimbursement framework established by a third party for services offered by health care providers. Bundled Rates are reimbursement rates specific to a procedure like appendectomy or hip replacement. Unique reimbursement ratesdeveloped by the plan itself, based on historical charges for health care goods and services.
Why “Reference-Based Pricing”? • • • Lower costs No network limitations All providers are “in network” Better transparency No network access fees Better actuarial predictability
Why…. ? “Not Networks” Shift to Cost-Based Reimbursement 1. Network agreements are based on a discount off of billed charges 2. Billed charges bear little relationship to actual costs 3. Employers looking to pay for true value of health care services are seeking cost based reimbursements rather than “discounts”
Billed Charges as a % of Medicare by State 200% 230% 587% 364% 256% 443% 573% 443% 240% 396% 292% 255% 514% 405% 440% 434% 472% 279% 508% 998%
Reference-Based Pricing • • Reference-Based Pricing = % of Medicare allowable Physicians =125% of Medicare allowable Hospitals and other providers =150% of Medicare allowable Employee can go to any provider No network access fee No out-of-network penalties ACA compliant
“RBP” Sample Card (Back)
Education is Critical (Consumer Driven Health Plans - CDHP) Educate Agents and Staff Educate Employers Educate Providers Educate Employees and Family
RBP Case Study #1 Bank Holding Company 3, 900 employees – 9 states Adopted RBP in 2014 120% Medicare – Physicians 150% Medicare – Institutions Notified all Physicians & Institutions Saved $850 K in network access fees Reduced claims costs in 2014 - $2. 5 M Total cost reduction Year 1 - $3. 35 M (17%)
Network vs. Bundled Rate Case Study #2 Hip Replacement Regional Hospital & Specialists Billed Charges - $145, 000; discount 60% Actual costs - $58, 000 Surgery Center of Oklahoma Bundled Price Hospital & Surgical Actual costs - $25, 000 https: //surgerycenterok. com/pricing/
RBP Multi-State Sample Rate Differential $2500 Ded HSA Plan PPO Location Columbia Wichita Falls Peoria Austin Springfield Midland St Louis Lubbock Tyler Dallas Rockford Alton Chicago San Antonio Flagstaff El Paso Houston Dayton State Mo Tx Il Tx Mo Tx Tx Tx Il Il Il Tx Az Tx Tx Oh EE 562 479 476 477 480 469 529 454 470 523 442 427 493 415 420 428 572 490 Freedom ES 1, 002 852 847 849 855 835 944 808 836 934 787 760 881 737 920 762 1, 022 1076 EC Fam 795 1, 235 678 1, 051 674 1, 045 675 1, 047 679 1, 054 665 1, 031 751 1, 166 643 997 667 1, 033 743 1, 154 627 972 605 938 699 1, 087 588 910 675 1, 175 607 941 814 1, 264 788 1374 EE 341 307 317 321 327 321 374 321 334 372 319 373 321 326 334 449 393 % Difference ES 614 554 572 581 590 581 675 581 603 673 576 672 581 726 603 811 875 EC Fam 493 766 444 691 459 714 467 727 474 737 467 727 542 843 467 727 485 754 541 842 462 719 541 840 467 727 535 935 485 754 652 1, 014 647 1129 EE -39. 3% -35. 9% -33. 4% -32. 7% -31. 9% -31. 6% -29. 3% -28. 9% -27. 8% -25. 3% -24. 3% -22. 7% -22. 4% -22. 0% -21. 5% -19. 8%
Will the “RBP” be Accepted? Increase in Medicare Eligible Next 5 Years U. S. Census Bureau 321, 418, 82 2015 Total U. S. Population 2015 Total 0 54, 048, 01 >65 - 2015 Medicare eligible 3 16. 82% 73, 117, 89 >65 - 2020 Medicare eligible 0 22. 75% 19, 069, 87 Increase 7 5. 93% By 2020, 23% of the U. S. population will be receiving medical services at a “Medicare-based” reimbursement rate.
Solution #3 Using Direct Primary Care With Level-Funded Plans Slash Costs! Increase Access! Improve Care!
Why Direct Primary Care now? • Direct Primary Care enables individuals to contract directly with a primary care physician for a monthly fee. • Very affordable!! (less than deductibles & copays) • No insurance involvement. • Contract specifies services to be performed. • 24/7 direct access to your DPC via cell phone. • DPC may offer an Rx benefit (state specific). • DPC focuses on wellness, patient relationship and health care advocacy not insurance documentation.
Why Direct Primary Care Now? ……. for the Physicians? • Better quality of life • More choices • Higher incomes – lower overhead (700 x $65 x 12 = $546, 000 annual income) • Greater professional satisfaction • Stronger patient relationships • Better health care outcomes
DPC Services Include: Annual exams Preventive screenings Urgent-care visits Basic lab work Sutures, minor injuries Routine illnesses Pediatric care Disease management (diabetes, asthma, etc. ) • Health care advocacy • •
In the United States today, the insurance card has become the gatekeeper to health care. al Fri n o i ct Primary Care Specialists and Institutions ts s Co Network Carrier Insurance Agent n B l a Employer Employee & Family io t a l e R rs e i arr
Direct Primary Care is the new gatekeeper to health care. X X X Employer Employee & Family Direct Primary Care Specialists & Institutions ts s o X X X a n io l. C ict Fr Network Insurance Company Healthcare Advisor X X X a n io lat Re X X s r e rri a B l
Small Group Level-Funded Plans With Direct Primary Care • With a contracted DPC in place lower rates can be offered for level-funded plans : • The DPC fee structure coordinates with level funding underwriting rate methodology. • • Remove the rate load for office visit costs and Rx benefits (Rx credit varies by state}) Installing larger deductibles and co-pays • Level-funded rate credits free up the dollars to help offset the cost of the DPC services
A Level-Funded Solution with DPC (With Larger Refund) C P D y db Co sts e b r o bs a Direct Primary Care New nd u Ref , 00 $30 0
DPC Sample Case Summary 23 FTEs enrolled 3 years results Standard Level-Funded Plan 3 year costs 3 -year costs after DPC discounts Rate credit applied for DPC Mo Rate/FTE $ 365, 076 $ 441 $ 317, 556 $ 384 $ (47, 520) $ (57) Cost of DPC Services $ 56, 160 3 -year total claim fund Claim fund refunds paid $ 148, 764 $ 180 $ (93, 012) $ (112) Trend increases avoided (RBP year 2&3) Net 3 -year cost $ (22, 924) $ (28) $ 257, 780 $ 311 Net Savings over 3 years % Saved Annual Savings per FTE $ (107, 296) $ (130) -29. 4% $ (1, 555) $ (130) $ 68
Level Funding + RBP + DPC = A More Affordable Solution “Employee Only” Rate Illustration $700 nsur I y l l Fu $600 $500 6 -201 ks 5 1 0 2 c Sho Rate Trend Costs After Refunds $400 Costs After LF & $300 2014 ed 2015 2016 Year 2017 RBP & DPC 2018 This sample chart illustration is provided for educational purposes only. Actual results may vary and are not indicative of future performance. Allied National, Inc. l 4551 W. 107 th St. Suite 100 l Overland Park, KS 66207 l 888 -767 -7133 l sales@alliednational. com l www. alliednational. com l twitter. com/alliednational 2019
The Compelling DPC Story • • • Higher quality health care Saves money Saves time More immediate access Personal relationships Proactive health care Active disease management Communicate with technology Catastrophic coverage
Challenges to Change! Using Level Funding, RBP & DPC • • New language (medical & insurance) New collaboration New and different story New business model New insurance model More education More moving parts! More time!
Practical Challenges • • Need a larger DPC “Community” Standardization of DPC services for multi-location employers ERISA & DOL employer compliance Employer or employee-paid DPC? Plans with and without DPC Tax deductibility of DPC
Solution #4 Individual Limited Medical Coming Soon! m co t n ia Hospitalization 365 days @ $1, 500/day ICU $3, 000/day 30 days Skilled Nursing $500/day 30 days Limited Benefit: Office visits, Xray & Lab, Surgery Benefit, In-Patient Mental & Nervous, other Pre-existing condition exclusion – varies by state pl • – • • on SAMPLE PLAN N (This example is for illustrative purposes only)
Individual Limited Medical Sample Rate (will vary by age & state) • • Individual – 35 year old Individual – 47 year old Individual & Children – 41 year old Family – 45 year old $ 96/mo $154/mo $252/mo $436/mo
Solution #5…. . YOU! The Health Care Adviser
You are now a “Health Care Adviser” (not an insurance agent) Skills Health Insurance Agent Healthcare Adviser Benefit Plan Designs X X Marketplace Options – Carriers, Networks X X Cost Comparisons X X Commissions X Compliance HIPAA, ERISA, DOL X Level Funding Structure X Medical Underwriting X Employee Education X Regulatory Reporting X Claims Analysis & Review X Reference-Based Pricing X Direct Primary Care X Long-Term Strategic Planning X Fees for Service X Time 40 Hours per account/Year 70 Hours per account/Year
Who is a Health Care Adviser? • • A trusted strategic partner Professional equivalent of attorney or CPA Management team member Technical consultant Resource for compliance Resource for communications HR leadership and planning support Insurance market access point
Are you a “Health Care Adviser”? • Technical competence – insurance, risk financing, regulations and HR compliance • Understand your client’s business issues • Have systems, processes and support • Strong communications skills • Market access and knowledge • Substantiate your value • Can you drive change?
Am I going to……………. . 1. React to change? 2. Embrace change? 3. Drive change?
Changing your perspective Salesmanship
Changing your perspective Leadership
Changing your perspective Leadership Leaders drive change and bring solutions!
Your 4 Current Realities 1. 2. 3. Your client needs you more than ever You will work harder You will earn more 4. Change is NOT optional
Thank you! Daniel R. Meylan National Sales Director Allied National Overland Park, Ks 66207 www. alliednational. com dmeylan@alliednational. com