Midterm topics Chapter 2 Data preprocessing Measures of
- Slides: 43
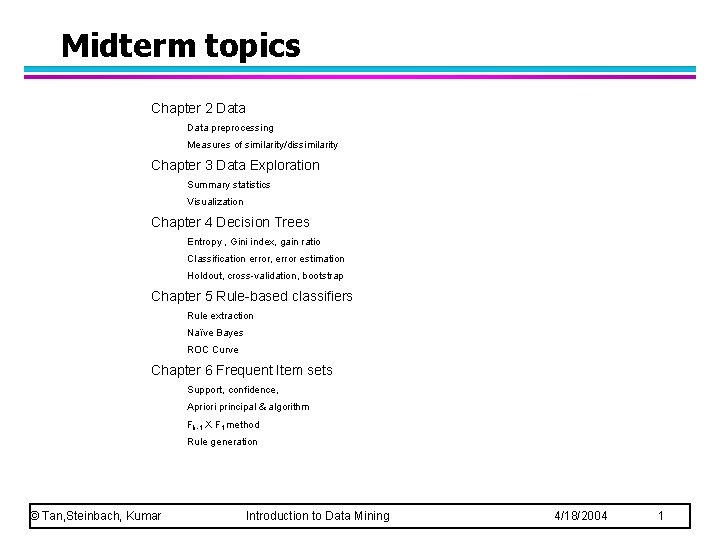
Midterm topics Chapter 2 Data preprocessing Measures of similarity/dissimilarity Chapter 3 Data Exploration Summary statistics Visualization Chapter 4 Decision Trees Entropy , Gini index, gain ratio Classification error, error estimation Holdout, cross-validation, bootstrap Chapter 5 Rule-based classifiers Rule extraction Naïve Bayes ROC Curve Chapter 6 Frequent Item sets Support, confidence, Apriori principal & algorithm Fk-1 X F 1 method Rule generation © Tan, Steinbach, Kumar Introduction to Data Mining 4/18/2004 1
Data Mining Cluster Analysis: Advanced Concepts and Algorithms Lecture Notes for Chapter 9 Introduction to Data Mining by Tan, Steinbach, Kumar © Tan, Steinbach, Kumar Introduction to Data Mining 4/18/2004 2
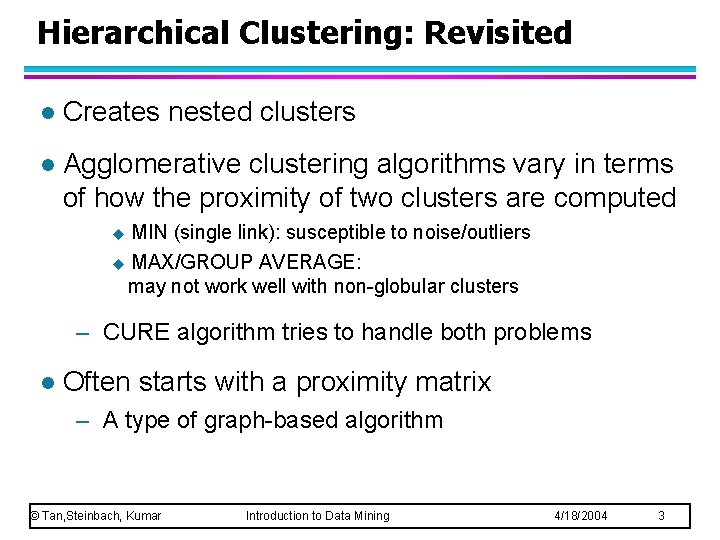
Hierarchical Clustering: Revisited l Creates nested clusters l Agglomerative clustering algorithms vary in terms of how the proximity of two clusters are computed u MIN (single link): susceptible to noise/outliers u MAX/GROUP AVERAGE: may not work well with non-globular clusters – CURE algorithm tries to handle both problems l Often starts with a proximity matrix – A type of graph-based algorithm © Tan, Steinbach, Kumar Introduction to Data Mining 4/18/2004 3
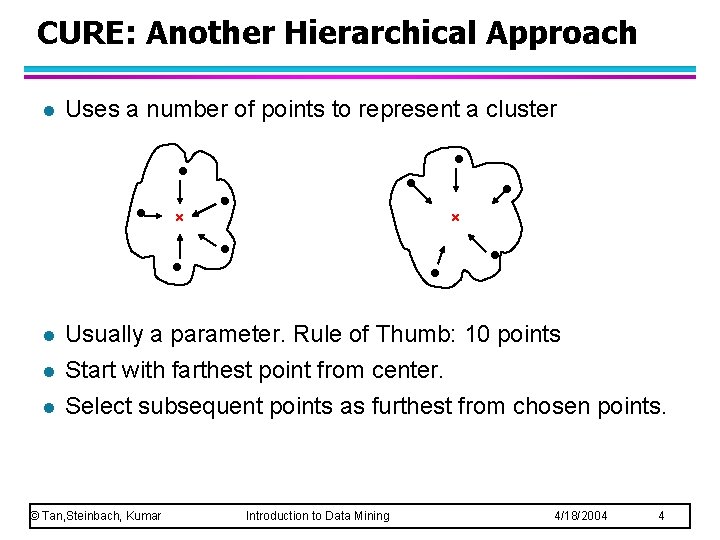
CURE: Another Hierarchical Approach l Uses a number of points to represent a cluster l l l Usually a parameter. Rule of Thumb: 10 points Start with farthest point from center. Select subsequent points as furthest from chosen points. © Tan, Steinbach, Kumar Introduction to Data Mining 4/18/2004 4
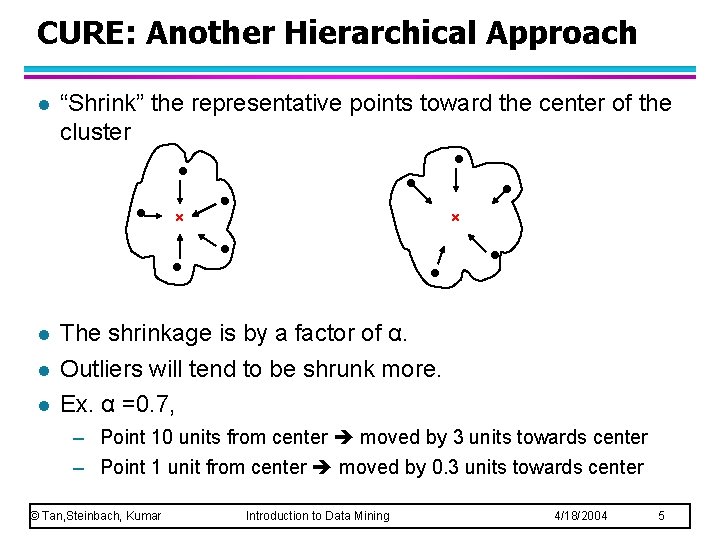
CURE: Another Hierarchical Approach l “Shrink” the representative points toward the center of the cluster l l l The shrinkage is by a factor of α. Outliers will tend to be shrunk more. Ex. α =0. 7, – Point 10 units from center moved by 3 units towards center – Point 1 unit from center moved by 0. 3 units towards center © Tan, Steinbach, Kumar Introduction to Data Mining 4/18/2004 5
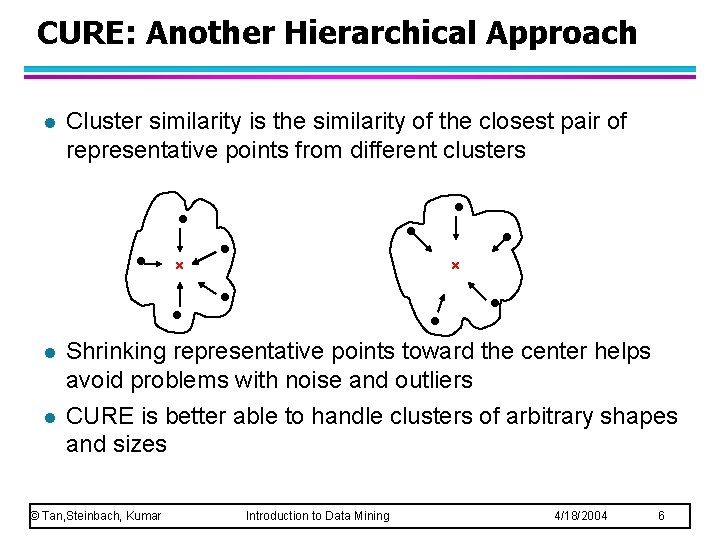
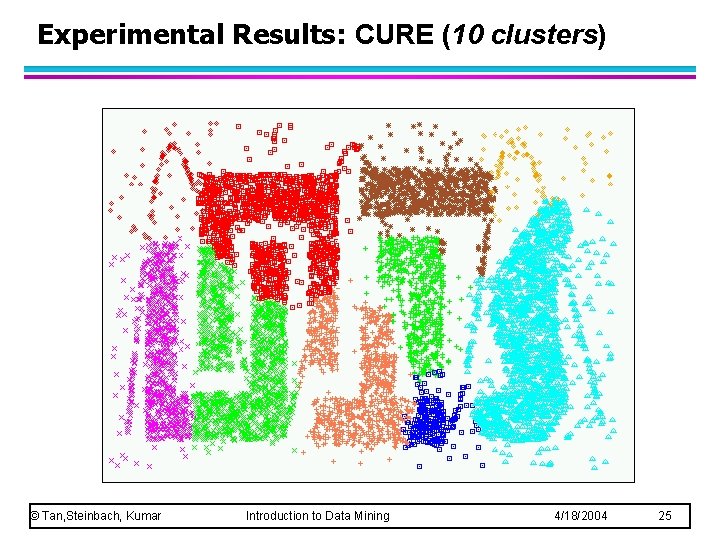
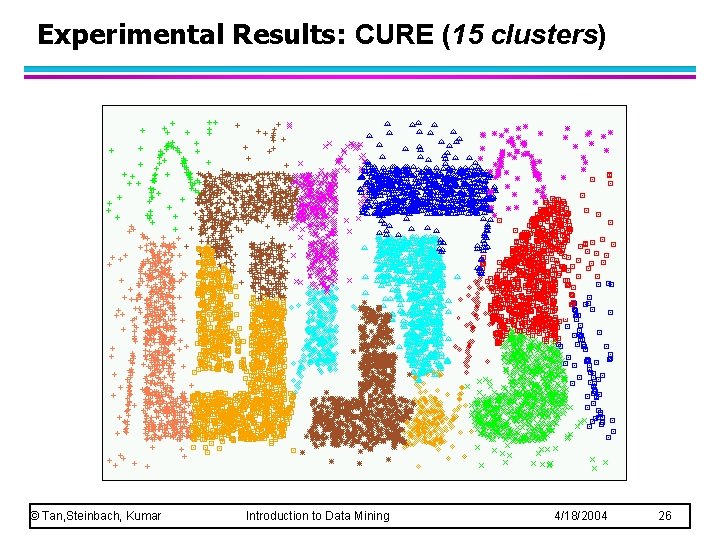
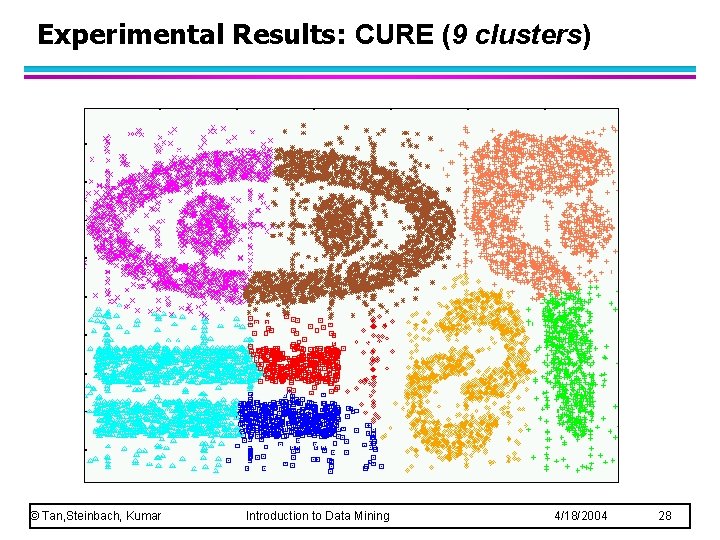
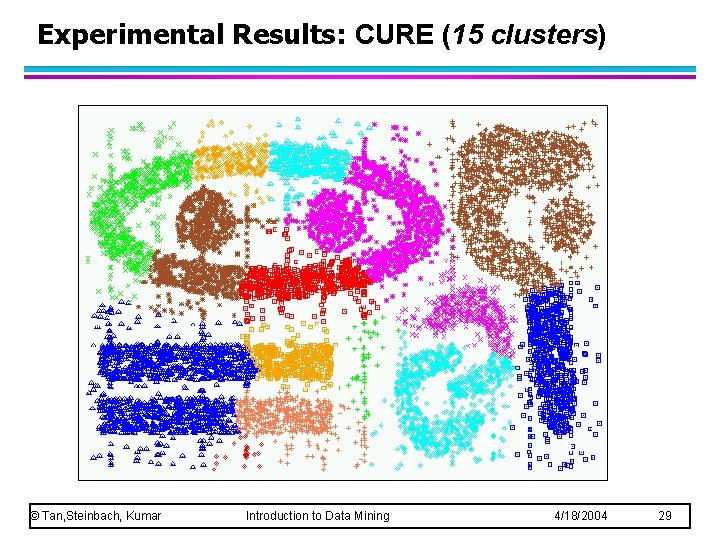
CURE: Another Hierarchical Approach l Cluster similarity is the similarity of the closest pair of representative points from different clusters l l Shrinking representative points toward the center helps avoid problems with noise and outliers CURE is better able to handle clusters of arbitrary shapes and sizes © Tan, Steinbach, Kumar Introduction to Data Mining 4/18/2004 6
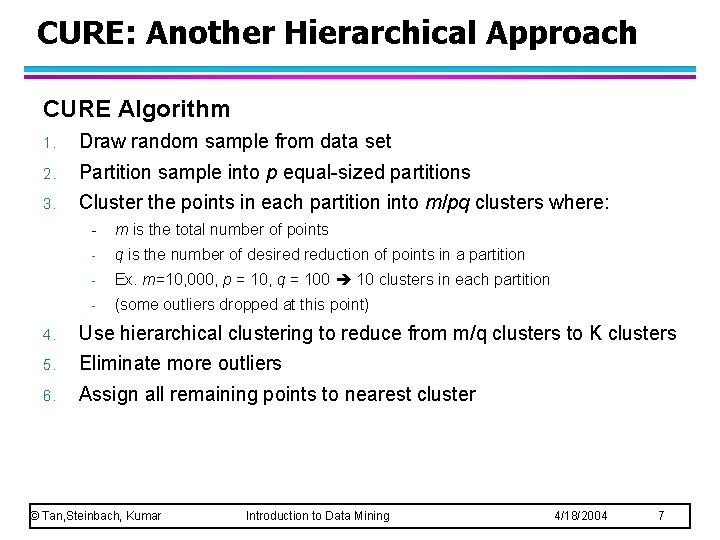
CURE: Another Hierarchical Approach CURE Algorithm 1. Draw random sample from data set 2. Partition sample into p equal-sized partitions 3. Cluster the points in each partition into m/pq clusters where: - m is the total number of points - q is the number of desired reduction of points in a partition - Ex. m=10, 000, p = 10, q = 100 10 clusters in each partition - (some outliers dropped at this point) 4. Use hierarchical clustering to reduce from m/q clusters to K clusters 5. Eliminate more outliers 6. Assign all remaining points to nearest cluster © Tan, Steinbach, Kumar Introduction to Data Mining 4/18/2004 7
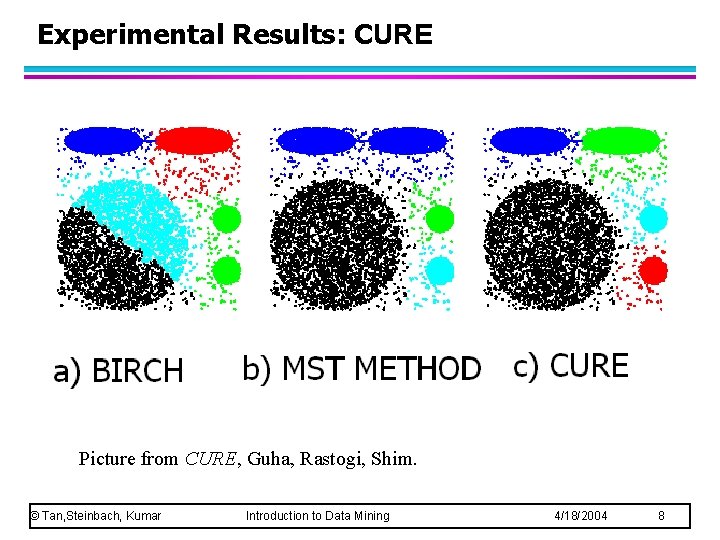
Experimental Results: CURE Picture from CURE, Guha, Rastogi, Shim. © Tan, Steinbach, Kumar Introduction to Data Mining 4/18/2004 8
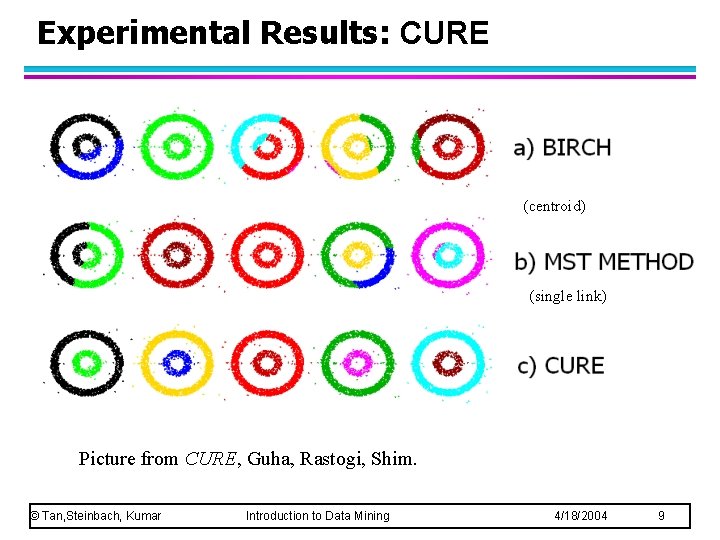
Experimental Results: CURE (centroid) (single link) Picture from CURE, Guha, Rastogi, Shim. © Tan, Steinbach, Kumar Introduction to Data Mining 4/18/2004 9
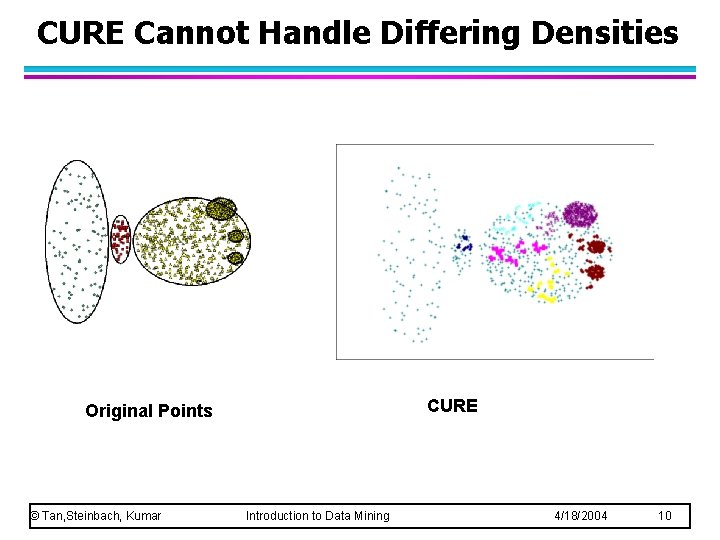
CURE Cannot Handle Differing Densities CURE Original Points © Tan, Steinbach, Kumar Introduction to Data Mining 4/18/2004 10
Graph-Based Clustering Graph-Based clustering uses the proximity graph - Start with the proximity matrix - Consider each point as a node in a graph - Edge weight = proximity between the two points - Initially the proximity graph is fully connected - MIN (single-link) and MAX (complete-link) start with this graph In the simplest case, clusters are connected components in the graph. © Tan, Steinbach, Kumar Introduction to Data Mining 4/18/2004 11
Graph-Based Clustering: Sparsification <sic>: reduce amount of data to be processed - can eliminate > 99% of the entries in a proximity matrix - reduces time required to cluster the data - increases size of problems that can be handled © Tan, Steinbach, Kumar Introduction to Data Mining 4/18/2004 12
Graph-Based Clustering: Sparsification … Clustering may work better - keep connections to the most similar (nearest) neighbors - breaks connections to less similar points - nearest neighbors belong to the same class - reduces the impact of noise and outliers - sharpens distinction between clusters facilitates use of graph partitioning algorithms – – Chameleon Hypergraph-based Clustering © Tan, Steinbach, Kumar Introduction to Data Mining 4/18/2004 13
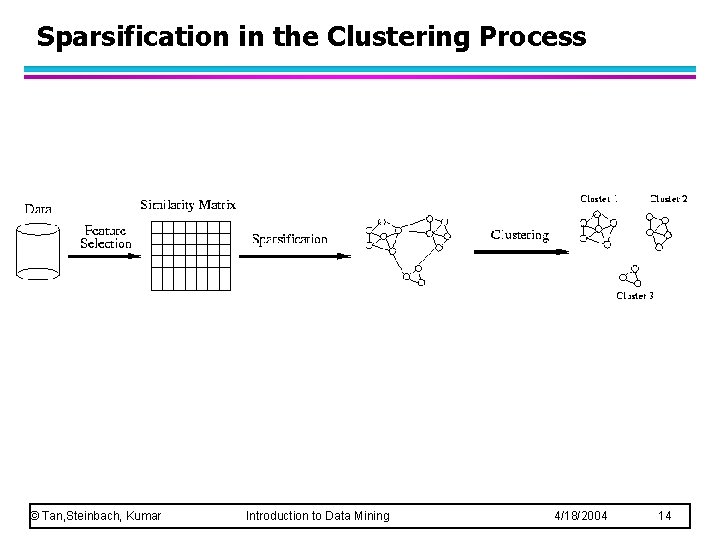
Sparsification in the Clustering Process © Tan, Steinbach, Kumar Introduction to Data Mining 4/18/2004 14
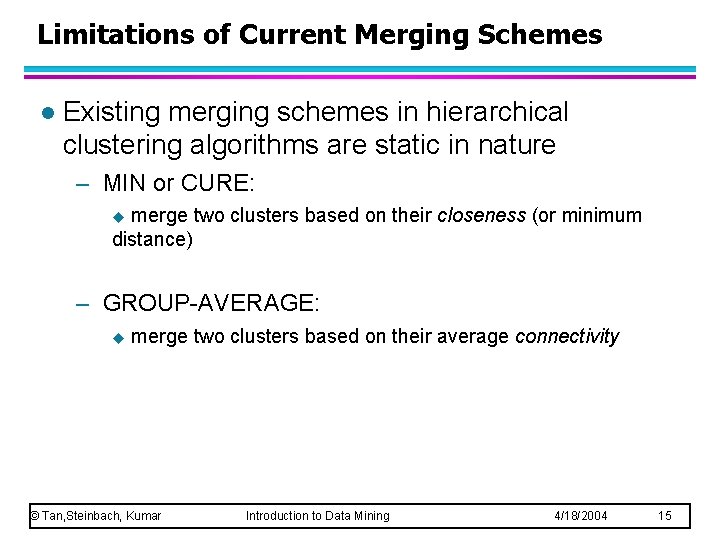
Limitations of Current Merging Schemes l Existing merging schemes in hierarchical clustering algorithms are static in nature – MIN or CURE: merge two clusters based on their closeness (or minimum distance) u – GROUP-AVERAGE: u merge two clusters based on their average connectivity © Tan, Steinbach, Kumar Introduction to Data Mining 4/18/2004 15
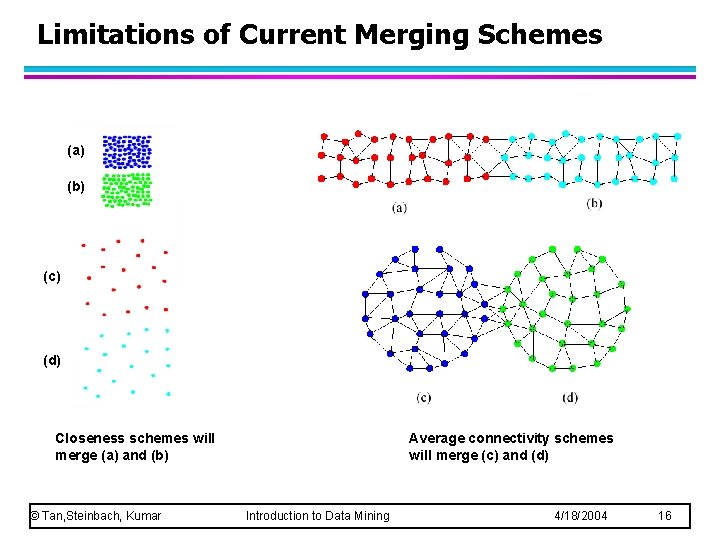
Limitations of Current Merging Schemes (a) (b) (c) (d) Closeness schemes will merge (a) and (b) © Tan, Steinbach, Kumar Average connectivity schemes will merge (c) and (d) Introduction to Data Mining 4/18/2004 16
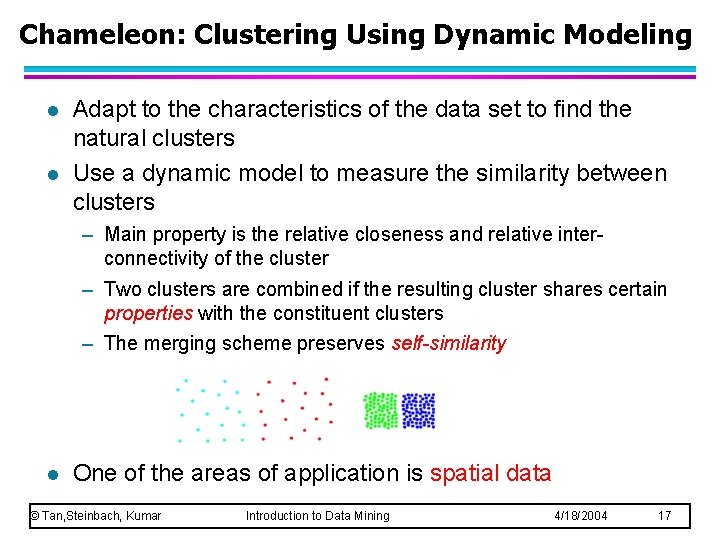
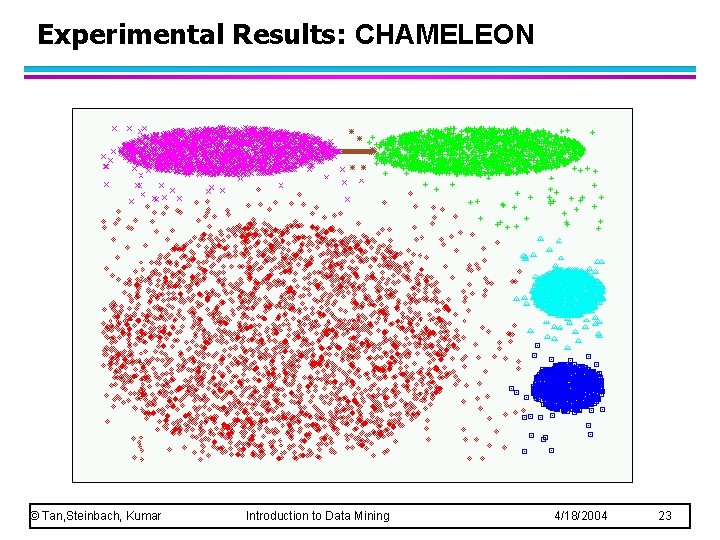
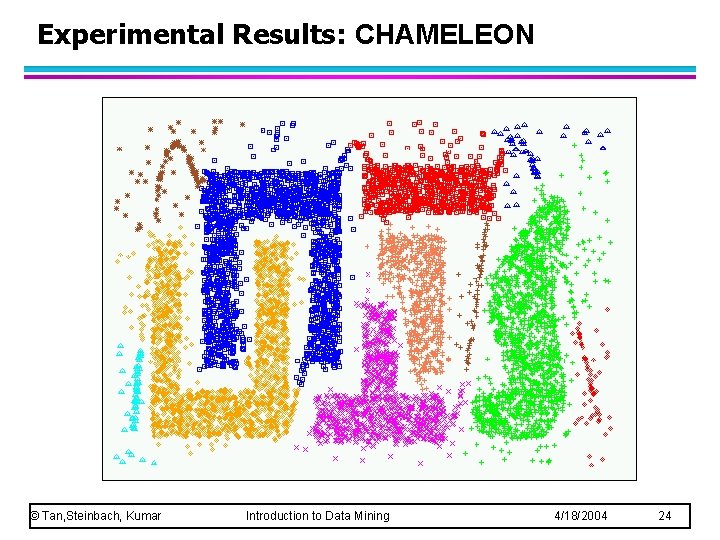
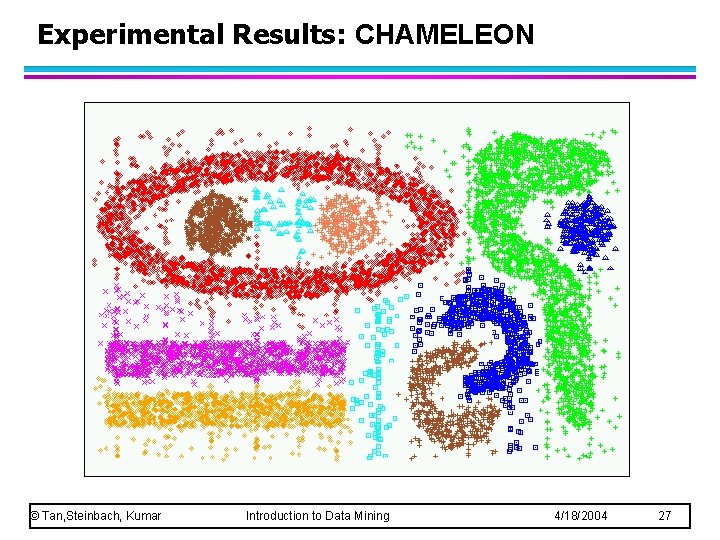
Chameleon: Clustering Using Dynamic Modeling l l Adapt to the characteristics of the data set to find the natural clusters Use a dynamic model to measure the similarity between clusters – Main property is the relative closeness and relative interconnectivity of the cluster – Two clusters are combined if the resulting cluster shares certain properties with the constituent clusters – The merging scheme preserves self-similarity l One of the areas of application is spatial data © Tan, Steinbach, Kumar Introduction to Data Mining 4/18/2004 17
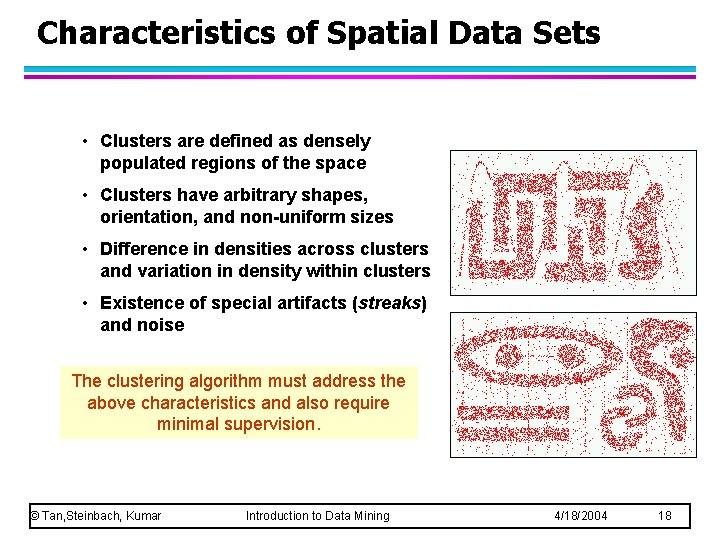
Characteristics of Spatial Data Sets • Clusters are defined as densely populated regions of the space • Clusters have arbitrary shapes, orientation, and non-uniform sizes • Difference in densities across clusters and variation in density within clusters • Existence of special artifacts (streaks) and noise The clustering algorithm must address the above characteristics and also require minimal supervision. © Tan, Steinbach, Kumar Introduction to Data Mining 4/18/2004 18
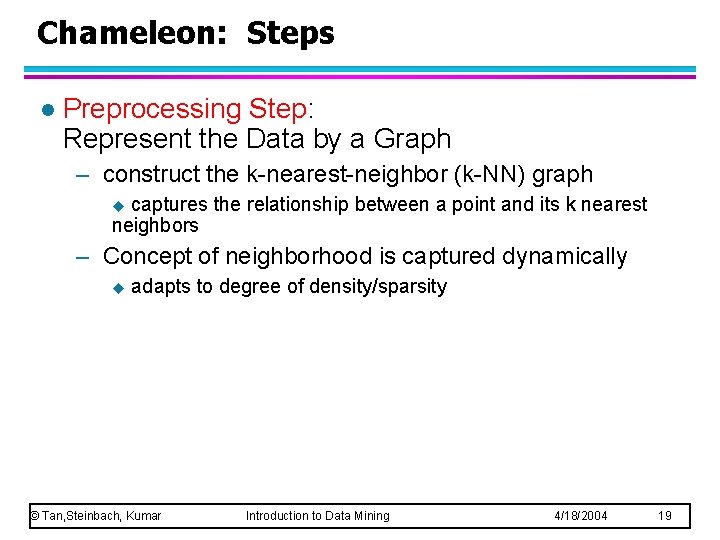
Chameleon: Steps l Preprocessing Step: Represent the Data by a Graph – construct the k-nearest-neighbor (k-NN) graph captures the relationship between a point and its k nearest neighbors u – Concept of neighborhood is captured dynamically u adapts to degree of density/sparsity © Tan, Steinbach, Kumar Introduction to Data Mining 4/18/2004 19
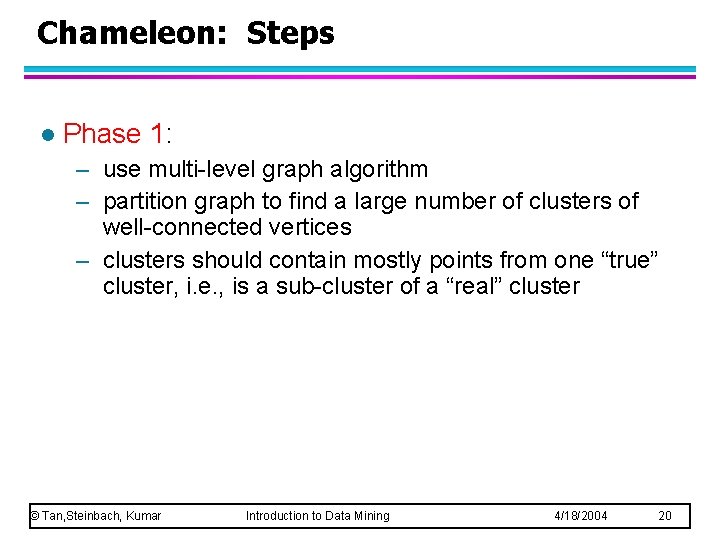
Chameleon: Steps l Phase 1: – use multi-level graph algorithm – partition graph to find a large number of clusters of well-connected vertices – clusters should contain mostly points from one “true” cluster, i. e. , is a sub-cluster of a “real” cluster © Tan, Steinbach, Kumar Introduction to Data Mining 4/18/2004 20
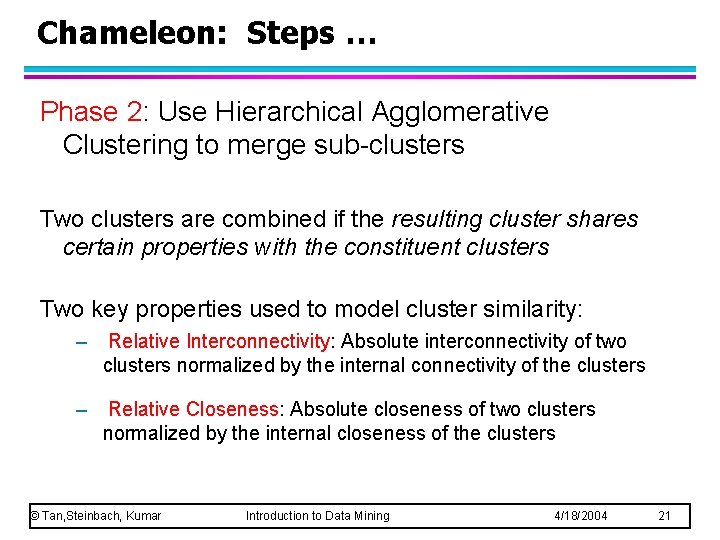
Chameleon: Steps … Phase 2: Use Hierarchical Agglomerative Clustering to merge sub-clusters Two clusters are combined if the resulting cluster shares certain properties with the constituent clusters Two key properties used to model cluster similarity: – Relative Interconnectivity: Absolute interconnectivity of two clusters normalized by the internal connectivity of the clusters – Relative Closeness: Absolute closeness of two clusters normalized by the internal closeness of the clusters © Tan, Steinbach, Kumar Introduction to Data Mining 4/18/2004 21
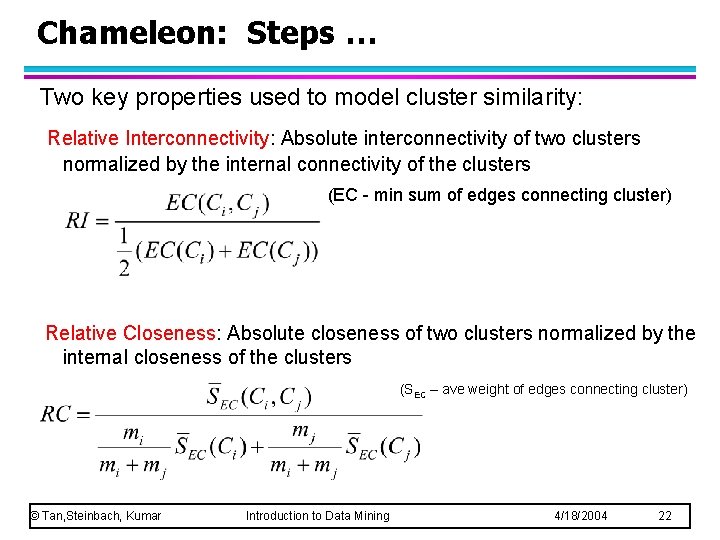
Chameleon: Steps … Two key properties used to model cluster similarity: Relative Interconnectivity: Absolute interconnectivity of two clusters normalized by the internal connectivity of the clusters (EC - min sum of edges connecting cluster) Relative Closeness: Absolute closeness of two clusters normalized by the internal closeness of the clusters (SEC – ave weight of edges connecting cluster) © Tan, Steinbach, Kumar Introduction to Data Mining 4/18/2004 22
Experimental Results: CHAMELEON © Tan, Steinbach, Kumar Introduction to Data Mining 4/18/2004 23
Experimental Results: CHAMELEON © Tan, Steinbach, Kumar Introduction to Data Mining 4/18/2004 24
Experimental Results: CURE (10 clusters) © Tan, Steinbach, Kumar Introduction to Data Mining 4/18/2004 25
Experimental Results: CURE (15 clusters) © Tan, Steinbach, Kumar Introduction to Data Mining 4/18/2004 26
Experimental Results: CHAMELEON © Tan, Steinbach, Kumar Introduction to Data Mining 4/18/2004 27
Experimental Results: CURE (9 clusters) © Tan, Steinbach, Kumar Introduction to Data Mining 4/18/2004 28
Experimental Results: CURE (15 clusters) © Tan, Steinbach, Kumar Introduction to Data Mining 4/18/2004 29
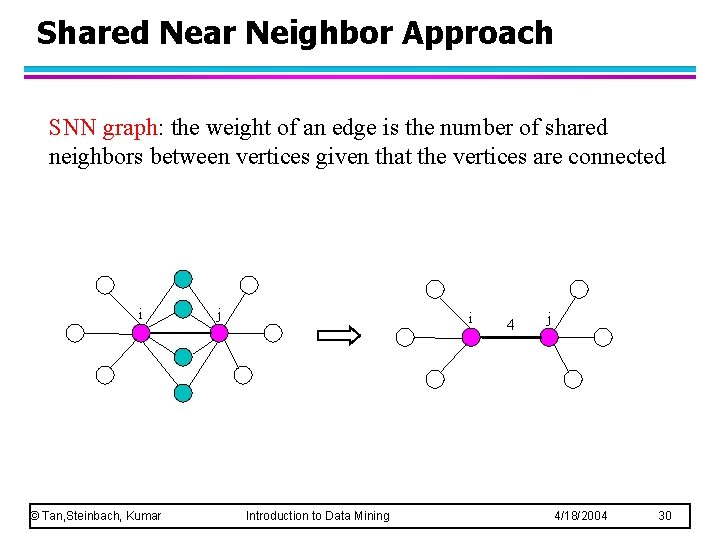
Shared Near Neighbor Approach SNN graph: the weight of an edge is the number of shared neighbors between vertices given that the vertices are connected i © Tan, Steinbach, Kumar j i Introduction to Data Mining 4 j 4/18/2004 30
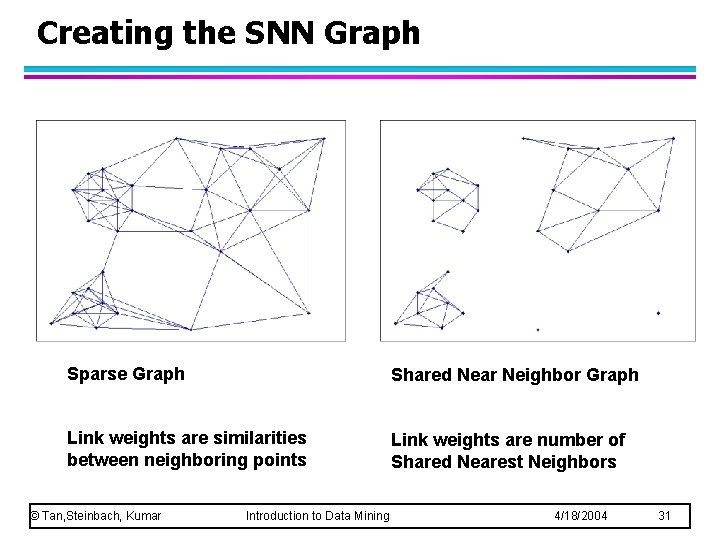
Creating the SNN Graph Sparse Graph Shared Near Neighbor Graph Link weights are similarities between neighboring points Link weights are number of Shared Nearest Neighbors © Tan, Steinbach, Kumar Introduction to Data Mining 4/18/2004 31
ROCK (RObust Clustering using lin. Ks) Use: data with categorical and Boolean attributes – Neighbor definition: similarity is greater than some threshold – Use a hierarchical clustering scheme to cluster the data. © Tan, Steinbach, Kumar Introduction to Data Mining 4/18/2004 32
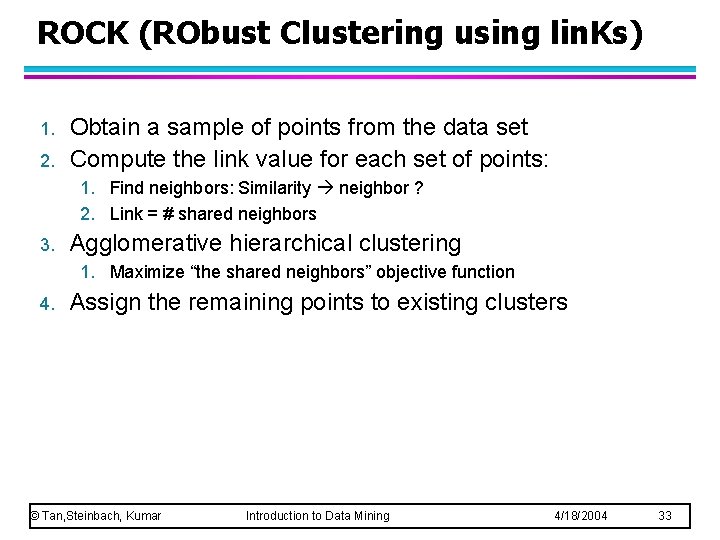
ROCK (RObust Clustering using lin. Ks) 1. 2. Obtain a sample of points from the data set Compute the link value for each set of points: 1. Find neighbors: Similarity neighbor ? 2. Link = # shared neighbors 3. Agglomerative hierarchical clustering 1. Maximize “the shared neighbors” objective function 4. Assign the remaining points to existing clusters © Tan, Steinbach, Kumar Introduction to Data Mining 4/18/2004 33
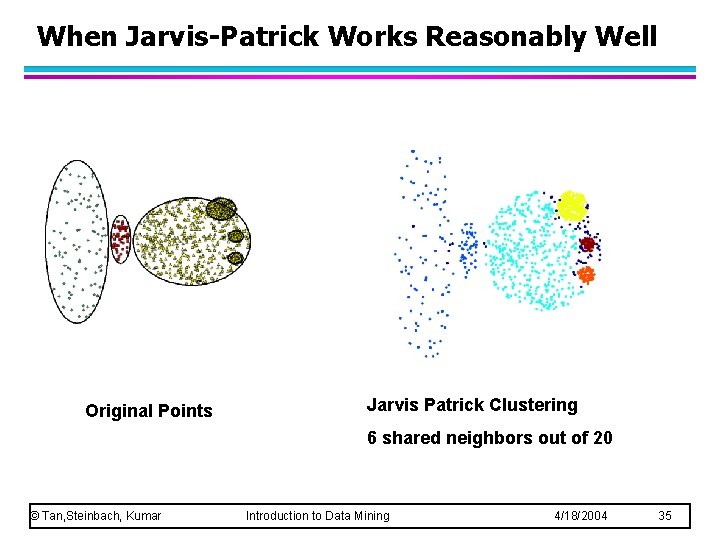
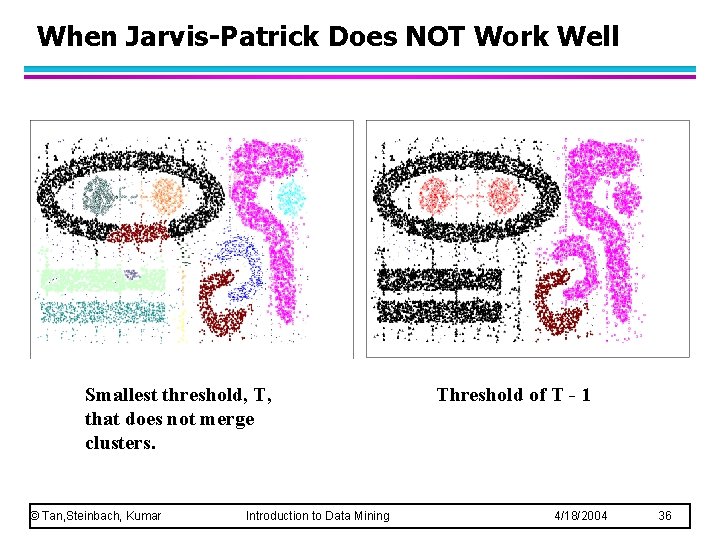
Jarvis-Patrick Clustering 1. k-nearest neighbors of all points are found – In graph terms this can be regarded as breaking all but the k strongest links from a point to other points in the proximity graph 2. A pair of points is put in the same cluster if – any two points share more than T neighbors and – the two points are in each others k nearest neighbor list 3. Ex. k=20 and T=10 Jarvis-Patrick clustering is too brittle © Tan, Steinbach, Kumar Introduction to Data Mining 4/18/2004 34
When Jarvis-Patrick Works Reasonably Well Original Points Jarvis Patrick Clustering 6 shared neighbors out of 20 © Tan, Steinbach, Kumar Introduction to Data Mining 4/18/2004 35
When Jarvis-Patrick Does NOT Work Well Smallest threshold, T, that does not merge clusters. © Tan, Steinbach, Kumar Introduction to Data Mining Threshold of T - 1 4/18/2004 36
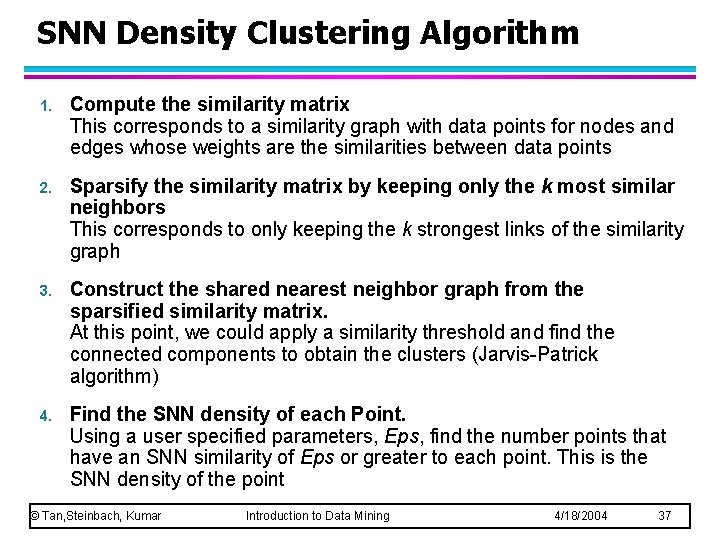
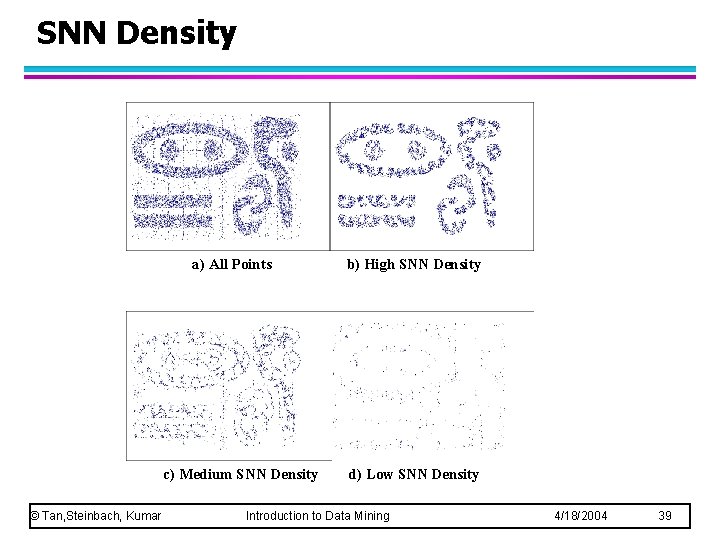
SNN Density Clustering Algorithm 1. Compute the similarity matrix This corresponds to a similarity graph with data points for nodes and edges whose weights are the similarities between data points 2. Sparsify the similarity matrix by keeping only the k most similar neighbors This corresponds to only keeping the k strongest links of the similarity graph 3. Construct the shared nearest neighbor graph from the sparsified similarity matrix. At this point, we could apply a similarity threshold and find the connected components to obtain the clusters (Jarvis-Patrick algorithm) 4. Find the SNN density of each Point. Using a user specified parameters, Eps, find the number points that have an SNN similarity of Eps or greater to each point. This is the SNN density of the point © Tan, Steinbach, Kumar Introduction to Data Mining 4/18/2004 37
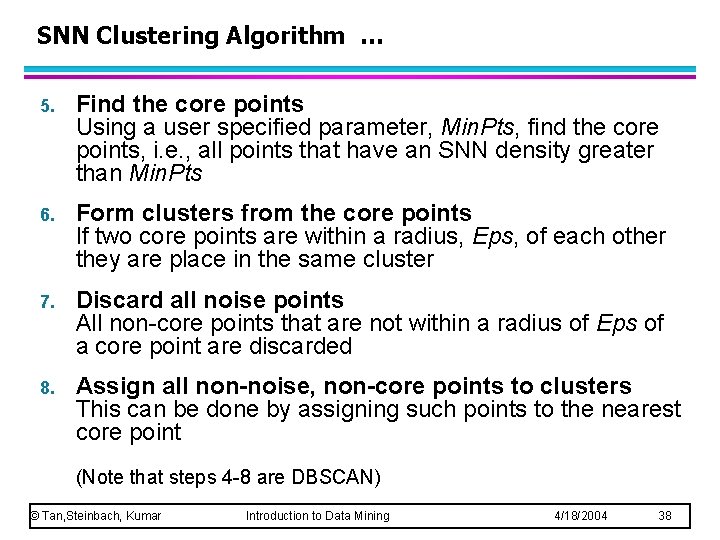
SNN Clustering Algorithm … 5. Find the core points Using a user specified parameter, Min. Pts, find the core points, i. e. , all points that have an SNN density greater than Min. Pts 6. Form clusters from the core points If two core points are within a radius, Eps, of each other they are place in the same cluster 7. Discard all noise points All non-core points that are not within a radius of Eps of a core point are discarded 8. Assign all non-noise, non-core points to clusters This can be done by assigning such points to the nearest core point (Note that steps 4 -8 are DBSCAN) © Tan, Steinbach, Kumar Introduction to Data Mining 4/18/2004 38
SNN Density a) All Points c) Medium SNN Density © Tan, Steinbach, Kumar b) High SNN Density d) Low SNN Density Introduction to Data Mining 4/18/2004 39
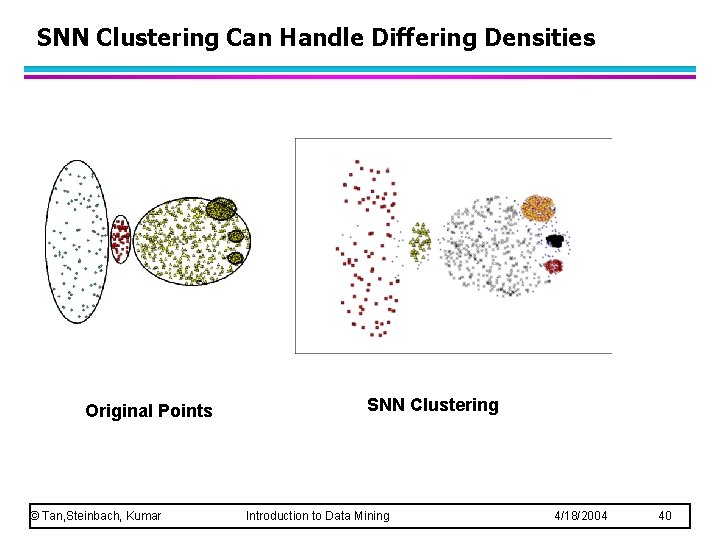
SNN Clustering Can Handle Differing Densities Original Points © Tan, Steinbach, Kumar SNN Clustering Introduction to Data Mining 4/18/2004 40
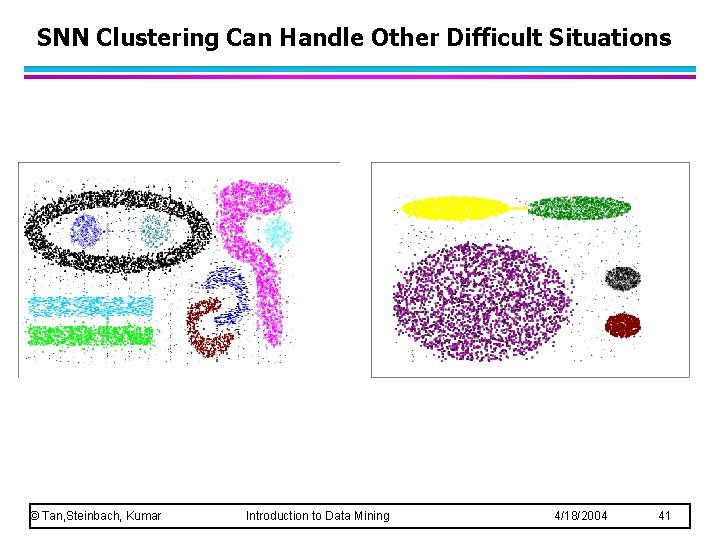
SNN Clustering Can Handle Other Difficult Situations © Tan, Steinbach, Kumar Introduction to Data Mining 4/18/2004 41
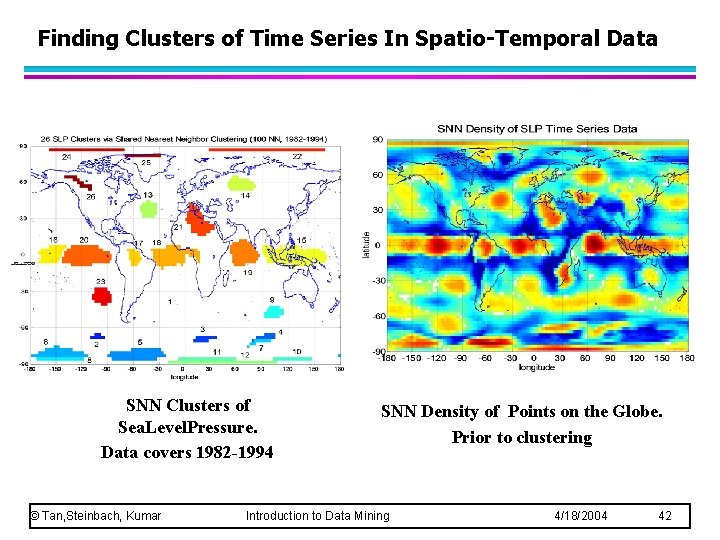
Finding Clusters of Time Series In Spatio-Temporal Data SNN Clusters of Sea. Level. Pressure. Data covers 1982 -1994 © Tan, Steinbach, Kumar SNN Density of Points on the Globe. Prior to clustering Introduction to Data Mining 4/18/2004 42
Features and Limitations of SNN Clustering l Does not cluster all the points l Complexity of SNN Clustering is high – – – O( n * time to find numbers of neighbor within Eps) In worst case, this is O(n 2) For lower dimensions, there are more efficient ways to find the nearest neighbors u R* Tree u k-d Trees © Tan, Steinbach, Kumar Introduction to Data Mining 4/18/2004 43