MANAGING YOUR FARMS FINANCIAL RISK Gayle Willett Pacific


 exceeds")


 can be used as a source of funds")


: Cash on hand Checking/savings accounts")
 associated with sale")


")


,")


")
 Is the investment profitable?")


 20% Yakima")


- Slides: 74
MANAGING YOUR FARM’S FINANCIAL RISK Gayle Willett Pacific Northwest Risk Management Education Project College of Agriculture and Home Economics Cooperative Extension Department of Agricultural Economics Washington State University
INTRODUCTION Agricultural Production is a High Risk Business. Risks are numerous, diverse, and substantial. Big Three Risks: 1. Production Variability in commodity yield and/or quality. Caused by weather, disease, pests, biological lags, etc.
2. Market and Price Variability in commodity and input prices. Caused by changes in supply (production decisions, weather, disease, gov’t. , trade, etc. ) and demand (consumer income, strength of economy, exports, exchange rates, prices of competing commodities, etc. ). 3. Financial Variability in returns to equity capital and in cash flow resulting from financing. Subject of this discussion.
o Objectives of Discussion 1. Define and Characterize Financial Risk. 2. Identify Sources of Financial Risk. 3. Note the Relationships Between Debt, Leverage, and Risk.
4. Determine Appropriate Debt and Leverage. 5. Manage Credit and Liquid Reserves. 6. Understand Risk Implications of Fixed Versus Variable Interest Rates. 7. Learn How to Structure the Repayment of Term Debt. 8. Understand the Relationship Between Land Lease Agreements and Risk.
FINANCIAL RISK: DEFINITION AND SOURCES Definition Variability in returns to equity capital and in cash flow resulting from financing. Financial risks arise primarily out of producer financial obligations to lenders and lessors.
Major Sources of Financial Risk 1. High debt and financial leverage. 2. Availability of credit reserves. 3. Availability of cash and near cash reserves. 4. Variability in interest rates. 5. Abbreviated repayment schedules for term debt. 6. Leasing arrangements.
Risks are Interrelated Financial, production, and marketing risks are interrelated Example: Ability to repay term debt is dependent on grain prices and yields. Should consider all types of risk when developing a plan for the entire business.
MANAGING FINANCIAL RISKS Debt, Leverage, and Risk The appropriate level of debt and leverage is dependent on: 1. Profitability 2. Risk 3. Repayment Capacity 4. Farmer’s Tolerance for Risk
Financial leverage. . . What is it?
Three Balance Sheets With Increasing Leverage
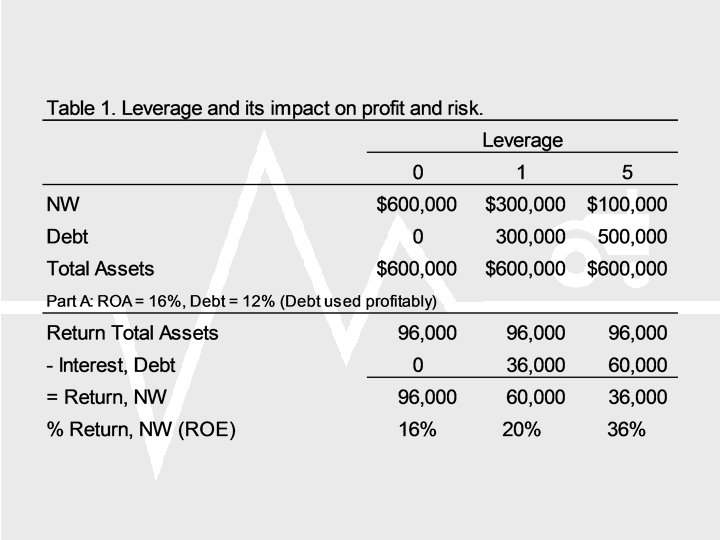
Debt, leverage, and profitability Leverage is good if return on assets (ROA) exceeds cost of debt. When ROA exceeds cost of debt, increased leverage increases the return on equity (ROE) (Table 1, Part A).
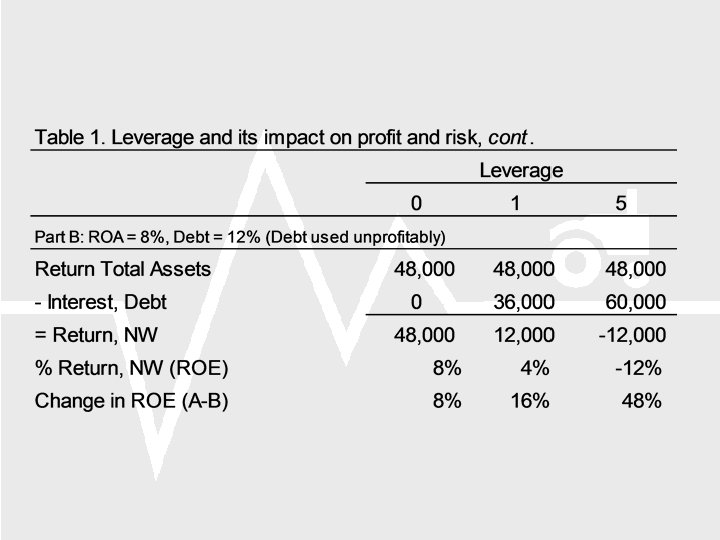
Debt, leverage and profitability, cont. Leverage is bad if cost of debt exceeds ROA. When the cost of debt exceeds ROA, increased leverage decreases the ROE (Table 1, Part B).
Debt, leverage and risk Principle of Increasing Risk: Increases in leverage cause unfavorable events to have a greater adverse impact on business profitability.
Maximum debt/asset % based on profitability and cost of debt. = Example: = = 50%
Assumes: Return from $1 pays interest on 50¢ of debt, but no principal. Maximum debt/asset % assumes zero returns to equity. Debt is serviced without using equity or non-farm earnings.
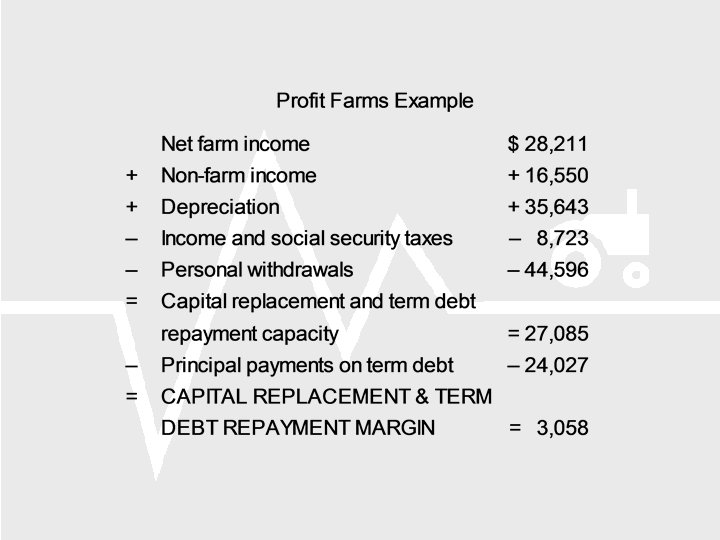
Debt, leverage and repayment capacity Capital replacement and term debt repayment margin reflects the ability of the business to replace capital assets and service additional term debt.
Debt, leverage and repayment capacity, cont. Decision about using additional term debt should be based on several years (3 -5) of term debt repayment margins. Amount of additional debt supported by repayment margin depends on: 1. Length of repayment period, and 2. Interest rate
Example: $10, 000 margin is the annual principal and interest payment on a:
Strategies for managing a positive capital replacement and term debt repayment margin: 1. Increase financial reserves (checking account, savings, CD’s, etc. ) 2. Increase personal withdrawals. 3. Borrow additional money to buy farm/non-farm capital assets.
4. Use equity capital to make down payments or purchase outright farm/non-farm capital assets. 5. Reduce reliance on non-farm income. 6. Prepay term debt if interest rate on debt is greater than rate of return from alternative use of margin.
Strategies for managing a negative capital replacement and term debt repayment margin: 1. Reduce working capital – Use savings – Reduce checking account balance – Reduce inventory – Reduce accounts receivable – Increase accounts payable
2. Restructure existing term debt so that it is repaid over longer period of time with lower periodic payments. 3. Liquidate capital assets (least profitable assets). 4. Increase farm/non-farm net income. 5. Reduce personal withdrawals.
Proper structuring of debt occurs when: 1. Operating capital debt can be repaid from funds allocated to pay cash operating expenses. 2. Loans for depreciable assets can be repaid from depreciation allowances. 3. Real estate debt can be repaid from retained earnings (= net income after taxes minus personal withdrawals).
How much debt/leverage? Summary of key points: 1. More leverage can increase earnings when debt capital is used profitably. 2. More leverage increases cash flow commitments. 3. More leverage increases variability of earnings (Principle of Increasing Risk).
Upper limits on appropriate use of debt/leverage are set by: 1. Profitability of debt use. 2. Ability to properly structure debt repayment obligations. 3. Variability of earnings and cash flow.
4. Effectiveness of risk management in controlling variability of earnings and cash flow. 5. Willingness of producer/lender to assume risk. 6. Desired credit reserve.
Managing Credit Reserves Credit reserve is the difference between the maximum amount a producer could borrow and the amount actually borrowed.
Credit reserve (unused borrowing capacity) can be used as a source of funds to meet risk-related needs, such as: Increased borrowing Loan carryover and extensions Deferring loan payments Refinancing
Size of credit reserve is determined by: Analysis of financial statements. Term debt repayment margin analysis (see earlier) Cash flow budget Risk management policy Lender(s) analysis of farm’s credit worthiness Producer’s willingness to accept risk
Advantages of a credit reserve as a source of liquidity: Does not alter asset-liability relationships Don’t have to liquidate assets to get funds Flexible in uses
Disadvantages of a credit reserve as a source of liquidity: Returns from investment opportunities are foregone when funds are not actually borrowed Considerable uncertainty about availability and cost of credit when taken from reserves Substantial financial control may shift to lenders when additional borrowing occurs during stress
Managing Liquid Reserves Self insurance through the maintenance of a reserve of cash and other highly liquid assets is a common strategy for minimizing the impact of financial adversity (risk). The value of this liquidity is reflected by the fact that producers maintain low yielding liquid reserves while paying higher interest rates on debt, sacrificing higher earnings by foregoing investments, and postponing consumption.
Sources of liquidity (in decreasing degree of liquidity): Cash on hand Checking/savings accounts Money market accounts Time deposits Securities Product inventories Supplies Growing crops/market animals Breeding animals Machinery Real estate
Determinants of liquidity Transactions costs (e. g. , commissions, transportation) associated with sale of asset Activity of market Variability of market over time
Contingent tax liabilities Impact of sale on farm’s income generating capacity Sale of current assets (e. g. , grain inventory) has small impact relative to sale of noncurrent assets (e. g. , machinery, land)
Symptoms of liquidity problems: Declining profitability Build-up of carryover operating debt Living off depreciation Build-up of credit card balances
Increasing number of past due notes Past due property taxes Canceled insurance Increasing leverage Multiple sources of credit (e. g. , over 5)
Strategies for managing a liquidity problem: Prepare an up-to-date and accurate balance sheet – Shows current financial position, including debt structure – Basis for cash flow management strategies
Prepare a monthly cash flow projection for upcoming year Work closely with lender(s) – Use standard financial statements to communicate Examine possibility of restructuring debt
Negotiate with lender to pay interest only on existing term debt. Closely analyze capital asset expenditures. Partial liquidation of capital assets. Review production practices for cost-cutting opportunities.
Consider off-farm employment. Evaluate living expenses. Give financial management a higher priority. Aggressively pursue risk management tools/strategies.
Fixed vs. Variable Interest Rates Types of interest rate plans: 1. Fixed rate Same rate applies for the entire length of the loan repayment period. Producer advantages: No risk of change in principal and interest payments due to varying interest rates. Doesn’t suffer from rising interest rates.
Producer disadvantages: Pay higher interest rate to compensate lender for assuming risk of change in interest rate. Doesn’t benefit from falling interest rates. May be higher prepayment penalties.
2. Variable rate Interest rate may vary during loan repayment period due to changes in cost of money to lender. Producer advantages: Lower interest rate since assumes risk of interest rate change. Opportunity to benefit from falling interest rates.
Producer disadvantages: Uncertainty about future payment obligations. Possibility of higher interest rates.
3. Adjustable rate Combination of fixed and variable rate loans. Applies to long-term loans and commonly referred to as Adjustable Rate Mortgages or “ARM. ”
Rates are fixed for a period (e. g. , one to five years), followed by another period when rates may increase or decrease, often subject to caps. Risk of rate changes is shared between borrower and lender. Advantages to producer are that interest rate is often lower than with variable rate loan and there is a limit on how much the rate can increase.
Which is best? Very difficult to determine unless know future direction of interest rates. During a period of low interest rates, producers with a highly vulnerable financial situation are generally well advised to use fixed rates. During a period of moderate to high interest rates, producers with a solid financial situation probably well advised to use variable/ARM.
Ability to withstand risk of interest rate changes can be determined with a term debt repayment margin analysis (as before). – Start with base analysis (most likely scenario) and then vary revenues down, expenses up, and interest rates up to determine vulnerability of repayment margin. – How much can interest rates increase under alternative cost/revenue scenarios before repayment margin is gone?
Structuring the Repayment of Term Debt Ideal loan repayment obligation Occurs when: 1. Cash earnings over life of asset are at least as large as the principal plus interest.
2. Loan repayment obligations are met in a timely manner by the asset’s stream of cash earnings. Loan repayment obligations that do not match the time pattern of cash earnings diminish the farm’s cash flow and increase financial risk.
Repayment obligations on debt used to finance capital assets should be structured to fit the asset’s stream of earnings. Proper structuring of term debt repayment obligations is based on financial analysis of proposed investments in capital assets.
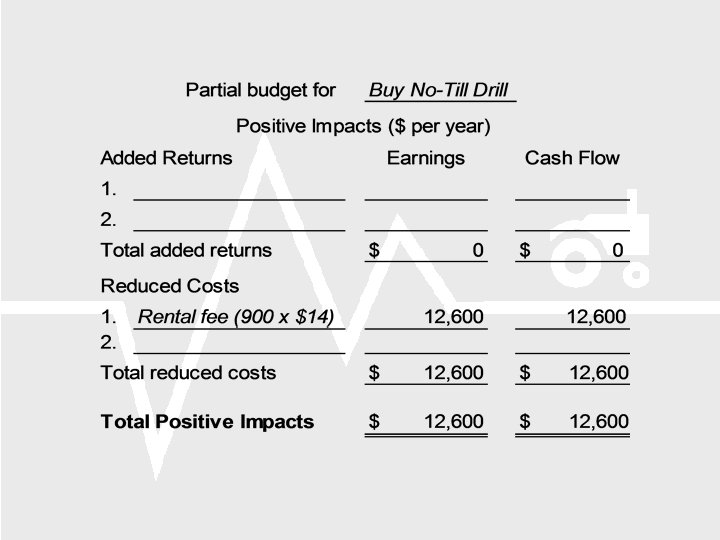
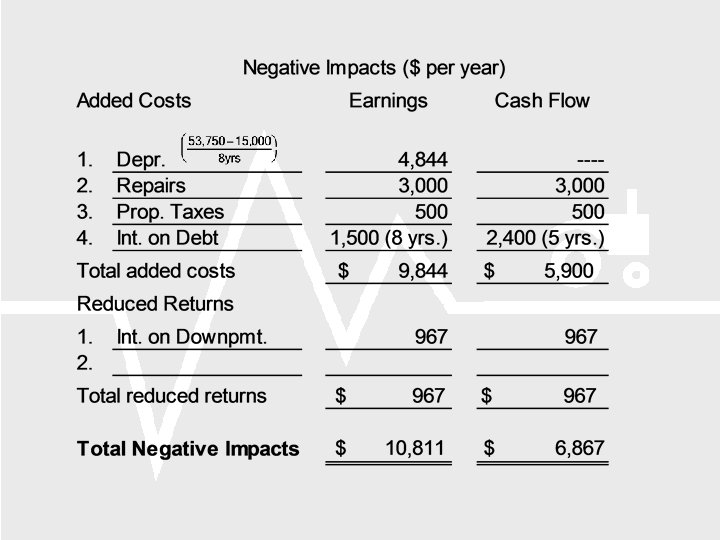
Example financial analysis: The No -till Drill. A grain producer has been renting a notill drill to seed 900 acres per year. The rental fee is $14 per acre. Consideration is being given to the purchase of the same drill. Assumptions applying to the proposed investment are:
1. The drill costs $53, 750. 2. An 8 year life is anticipated with a $15, 000 salvage value. 3. If purchased, the drill will be pulled by the same power unit now used to pull the rented drill. 4. Average annual repairs on the purchased drill are estimated to be $3, 000.
5. Property taxes on the purchased drill will average about $500 per year. 6. Repairs for the rented drill are always covered by the warranty (new machine) and the lease company pays property taxes. 7. The producer must buy insurance on both the purchased and rented drill.
8. Proposed financing for the purchased drill is a $16, 125 down payment (30%) and a $37, 625 loan. Lender is suggesting a 10 percent interest rate and five equal annual payments of $9, 925 each. Funds for a down payment would come from an alternative use yielding a six percent cash return.
A sound investment analysis should address three key questions: (1) Is the investment profitable? (2) Will the investment have a cash flow that matches debt repayment obligations? (3) What about the risk?
The investment in the no-till drill is projected to increase average annual earnings by $1, 789 (Financial Analysis, Line 1). The investment does not cash flow, since the lender is proposing a 5 year repayment period and it is projected to take 6. 6 years to retire the principal (Financial Analysis, Line 3).
Financial risk could be reduced by negotiating for a 7 -year repayment period, at the expense of added interest. What other risks are associated with this investment, and are the $1, 789 improved earnings sufficient to compensate for those risks?
Financial Analysis
Lease Terms and Risk Leasing is a widely used method of controlling land. 43% of land farmed in U. S. is farmed as leased ground. Incidence of leasing and types of leases are highly variable, e. g. ,
47% of WA land is leased 62% Whitman County (dryland grain) 20% Yakima County (irrigated fruit, etc. ) About 2/3’s of U. S. leases are cash leases In PNW, cash rent dominates on irrigated ground and crop-share is more popular for dryland grain production.
Nature of land lease agreement can have major impact on producer risk. 1. Crop-share leases Value of the crop-share paid as rent varies with yield and crop price. Yield and price risk are shared by the landowner and the producer.
Since the value of the rent varies with the producer’s ability to pay, crop-share leases have risk advantages for the producer. Less risk often translates to higher rent, since landowner will require more rent to compensate for added risk.
2. Fixed rent High risk for producer in that must pay agreed upon amount regardless of ability to pay. Producer withstands all the risk associated with the variability of yields, prices, and costs. Landowner avoids these risks and is therefore, often willing to accept a lower rent than would be required on comparable ground with a crop-share arrangement.
3. Variable cash rent Cash rent for base yield and/or price is varied according to changes in yield and/or price. Examples: Base rent varied by price change = $46. 43 Producer and landowner share in price risk. Producer assumes all of production risk.
Examples, cont. : Base rent varied by price and yield changes. = $37. 14 Producer and landowner share in both price and yield risks.
4. Custom farming Operating agreement, not land lease agreement. Landowner retains control of land manages its use, including paying a fee for hiring labor and machinery services. Landowner assumes production and price risk. Financial risk can be reduced by extending the length of the lease (land machinery).