Locality Sensitive Imputation for SingleCell RNASeq Data Marmar


:")
 & m. RNA capture leading")
 •")
 High level summary of")

 •")


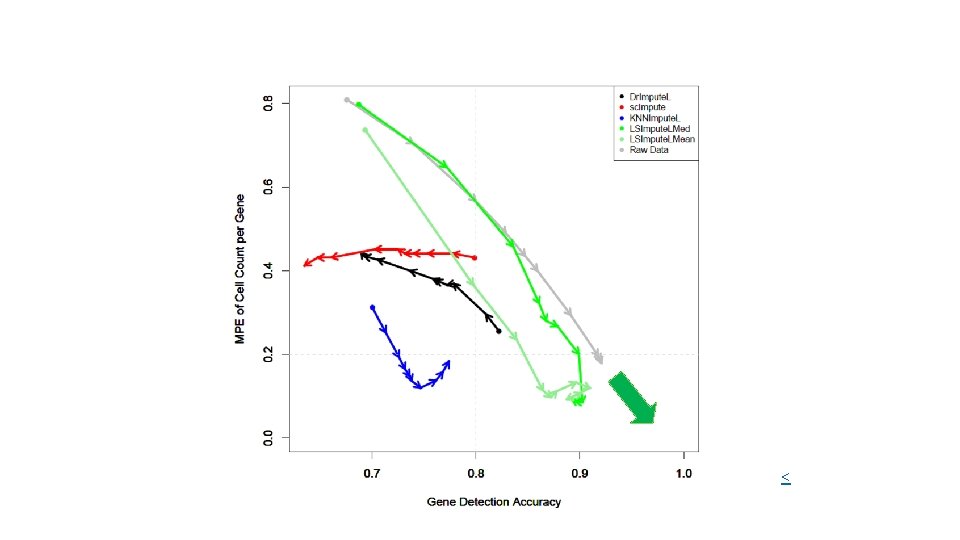
 Detection of each gene (dot) vs. Raw (yaxis) Detection")


 for each depth (x-axis) in each")


, a")

- Slides: 28
Locality Sensitive Imputation for Single-Cell RNA-Seq Data Marmar Moussa & Ion Măndoiu Computer Science & Engineering Department University of Connecticut ISBRA 2018, June 11 th
Outline • Motivation & Background • Novel Algorithm - LSImpute: Locality Sensitive Imputation for Single Cell RNA-Seq Data • Results • Future Work & Application Demo
The Gene Expression Matrix 3’-end Sequencing w/ UMIs* (10 X Genomics):
Drop-outs occurring because of • inefficient RT (Reverse Transcription) & m. RNA capture leading to uniformly random dropout in reads, • low number of RNA transcripts and the stochastic nature of gene expression • … Result : capturing only a fraction of the transcriptome of each cell zero inflated data. difficult to distinguish technical dropout of transcripts from true biological variation between cells. correcting dropouts needed for applications like cell count/detection fractions (e. g. % TILs in Tumors) etc.
Existing single cell RNA-Seq imputation methods - Dr. Impute • DRImpute (clustering cells) • sc. Impute • KNNImpute (K nearest neighbour genes)
Proposed method: Locality Sensitive Imputation for sc. RNA-Seq Data (LSImpute) High level summary of the novel imputation algorithm (LSImpute): Step 1. Given a set (S) of (n) cells , start by selecting a small number (m) of cells with highest similarity level, based on their locality sensitive hashing values. Step 2. Group the highly similar cells from Step 1 into clusters (“tight” ). Step 3. For each cluster, replace zeros for each gene j with values imputed based on the expression levels of gene j in all cells within the cluster. Step 4. The selected cells now have imputed values and the clusters they form are collapsed into their respective centroids. The centroids are pooled together with remaining cells to form a (S’) and the process is repeated starting again at Step 1.
Toy Example:
Proposed method: Locality Sensitive Imputation for sc. RNA-Seq Data (LSImpute) •
Experimental Setup – DRG neurons Data Set •
Evaluation metrics • Detection fraction : Number of cells in which the gene is detected divided by the total number of cells. Compared to the `true' detection ratio in scatter plot. • Median percent error (MPE): Median of the set of relative errors for the gene detection fraction. Relative Error: |y -x| / y. (For each gene, y = predicted detection fraction, x = ground truth detection fraction) • Gene detection accuracy: Gene detection as a binary classification problem: TP+TN / (N*M) where N and M are the # genes and # cells respectively. TP are the (gene, cell) pairs for which both imputed and ground truth TPM values are positive. TN are (gene, cell) pairs for which both TPM values are zero. • Clustering micro-accuracy.
Detection Fraction • True (x-axis) Detection of each gene (dot) vs. Raw (yaxis) Detection Fraction. • Dot color shades are based on four quartiles of genes non-zero mean expression. • For an ideal imputation method all dots would lie on the diagonal
For 200 K Raw Rounded TPMs Dr. Impute KNNImpute LSImpute-Med sc. Impute LSImpute-Mean
100 K, • Rounded True vs. imputed detection fractions: 1 M, 10 M Raw Data, Dr. Impute, sc. Impute, KNNImpute, LSImpute. Med, LSImpute. Mean <
Error curves for 100 K data set. • The error curve plots, for every threshold x between 0 and 1 (or larger): % of genes with relative error > x. • The abscissa of dashed vertical lines correspond to MPE of raw data.
Median Percent Error values in log scale (y-axis) for each depth (x-axis) in each quantile (z-axis) for each method: (a) Raw data, (b) Dr. Impute, (c) sc. Impute, (d) KNNImpute, (e) LSImpute. Med, and (f) LSImpute. Mean <
Gene Detection Accuracy
Raw Data 100 K KNNImpute Dr. Impute sc. Impute LSImpute. Med LSImpute. Mean
Meth. A 10 x Data 638 cells: 494, 275 Reads/Cell, down-sampled to 52, 180 Reads/Cell (Fraction of Reads Kept 11. 8%) Detection Accuracy : Raw 0. 97; Dr. Impute 0. 95; LSImpute 0. 974 True vs. down-sampled Dr. Impute LSImpute
Conclusion • To impute or not to impute – that is the question! • Two-edged sword in several methods (over-imputation) • Sequencing Depth is one of the main factors to consider, also application. • LSImpute, especially the variant based on median imputation, tends to impute more conservatively than existing methods resulting in better performance and more accurate imputation. • LSImpute is more likely to reduce drop-out effects and reduce sparsity of the data without introducing false expression patterns or over-imputation.
References • Kwak, I. Y. , Gong, W. , Koyano-Nakagawa, N. , Garry, D. : Drimpute: Imputing dropout events in single cell rna sequencing data. bio. Rxiv p. 181479 (2017) • Leskovec, J. , Rajaraman, A. , Ullman, J. D. : Mining of massive datasets. Cambridge University Press (2014) 20. • Li, C. L. , Li, K. C. , Wu, D. , Chen, Y. , Luo, H. , Zhao, J. R. , Wang, S. S. , Sun, M. M. , Lu, Y. J. , Zhong, Y. Q. , et al. : Somatosensory neuron types identied by high-coverage single-cell rna-sequencing and functional heterogeneity. Cell research 26(1), 83 (2016) • 21. Li, W. V. , Li, J. J. : scimpute: accurate and robust imputation for single cell rna-seq data. bio. Rxiv p. 141598 (2017) • Moussa, M. , Mandoiu, I. : Locality sensitive imputation for single-cell rna-seq data. ISBRA 2018 Proceedings (to appear in ISBRA 2018 proceedings). bio. Rxiv preprint available at doi: https: //doi. org/10. 1101/291807. • http: //cnv 1. engr. uconn. edu: 3838/SC 1/ • http: //cnv 1. engr. uconn. edu: 3838/LSImpute/
Thank You. Questions? Acknowledgements : This work was partially supported by NSF Award 1564936, NIH grants 1 R 01 MH 11273901 and 2 R 01 NS 073425 -06 A 1, and a UConn Academic Vision Program Grant.
Notes on LSImpute • <
Notes on LSImpute Candidate Cell 1 Candidate Cell 2 N-Bands/Similarity Level 25 27 40 2 205 209 27 3 207 209 27 4 205 207 26 5 208 209 24 6 137 165 22 7 206 208 22 8 206 209 22 9 207 208 22 10 33 69 21 11 62 68 21 12 111 113 21 13 132 170 21 14 137 192 21 15 153 171 21 16 153 177 21 17 18 20 20 18 56 62 20 19 56 68 20 20 62 63 20 21 68 79 20 1 if m_min = 6 6 unique cells if m_min = 10, overshoot, >10 unique cells resolve with a Threshold Step over normalized similarity <
Existing single cell RNA-Seq imputation methods - Dr. Impute • The Dr. Impute R package implements imputation for sc. RNA-Seq based on clustering the data. • distance between cells using Spearman and Pearson correlations, • cell clustering based on each distance matrix, • followed by imputing zero values multiple times based on the resulting clusters, and • finally averaging the imputation results to produce a value for the drop-outs. <
Existing single cell RNA-Seq imputation methods - sc. Impute • The sc. Impute R package makes the assumption that most genes have a bimodal expression pattern that can be described by a mixture model with two components. • The parameters in the mixture model are estimated using Expectation -Maximization (EM) results to produce a value for the drop-outs. <
Existing single cell RNA-Seq imputation methods - KNNimpute • Weighted K-nearest neighbors (KNNimpute), a method originally developed for microarray data, selects genes with expression profiles similar to the gene of interest to impute missing values. • For instance, consider a gene A that has a missing value in cell 1, KNN will find K other genes which have a value present in cell 1, with expression most similar to A in cells 2 to N, where N is the total number of cells. • A weighted average of values in cell 1 for the K genes closest in Euclidean distance is then used as an estimate for the missing value for gene A. <
Imputation effect on Clustering • s. Kmeans, top TF-IDF, • 100 K DRG