Cell type identification in singlecell RNAseq data Philip
- Slides: 37
Cell type identification in single-cell RNA-seq data Philip Lijnzaad
Overview Introduction Manual methods Existing methods Single. R CHETAH
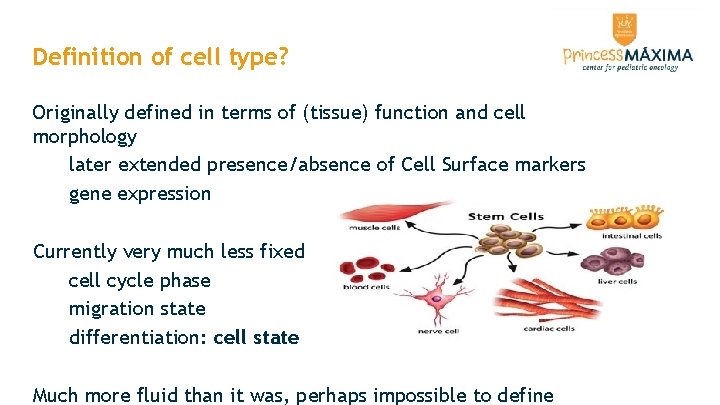
Definition of cell type? Originally defined in terms of (tissue) function and cell morphology later extended presence/absence of Cell Surface markers gene expression Currently very much less fixed cell cycle phase migration state differentiation: cell state Much more fluid than it was, perhaps impossible to define
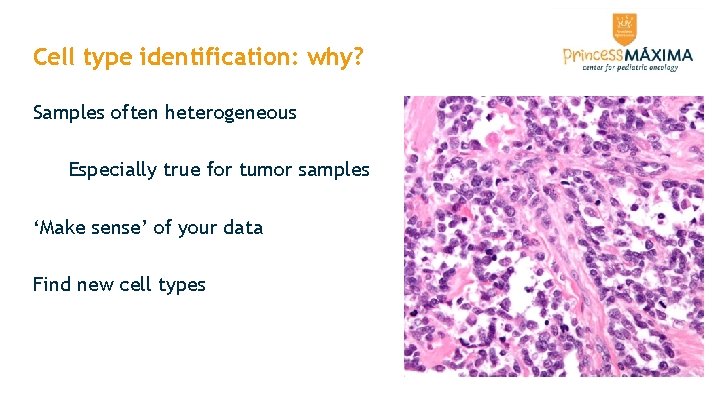
Cell type identification: why? Samples often heterogeneous Especially true for tumor samples ‘Make sense’ of your data Find new cell types
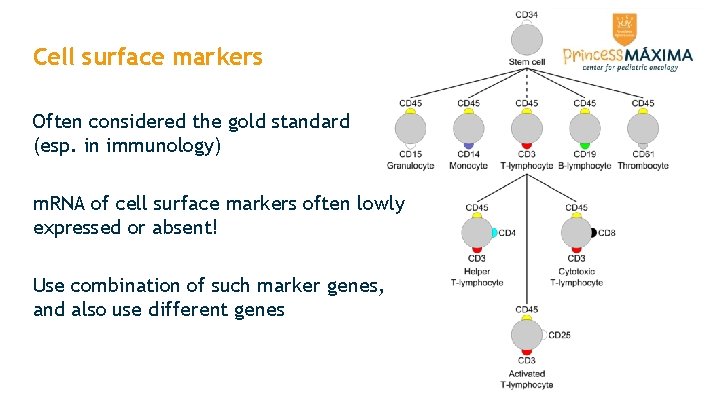
Cell surface markers Often considered the gold standard (esp. in immunology) m. RNA of cell surface markers often lowly expressed or absent! Use combination of such marker genes, and also use different genes
Manual classification Time-consuming Requires expert knowledge Likely subjective and/or inaccurate
Automatic methods Use complete cell type-specific m. RNA expression profiles based on bulk RNAseq from FACS-sorted ’pure’ populations OR: manually curated cells picked from sc. RNA-seq data sets ’the reference’ Variety of approaches: methods: ad hoc, machine learning assign per individual cell, or per cluster of cells All use similarity to the reference, often based on correlation
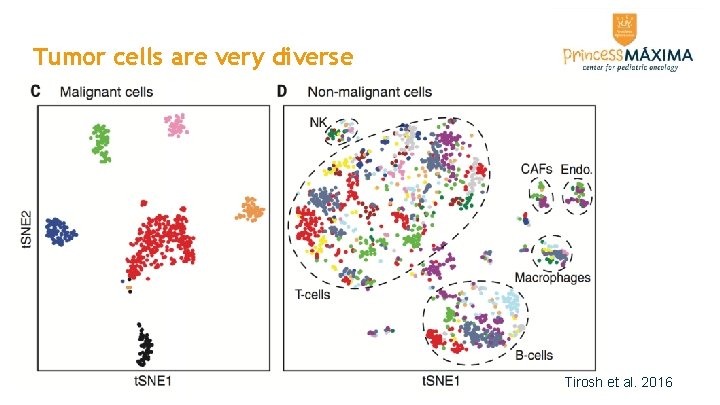
Tumor cells are very diverse Tirosh et al. 2016
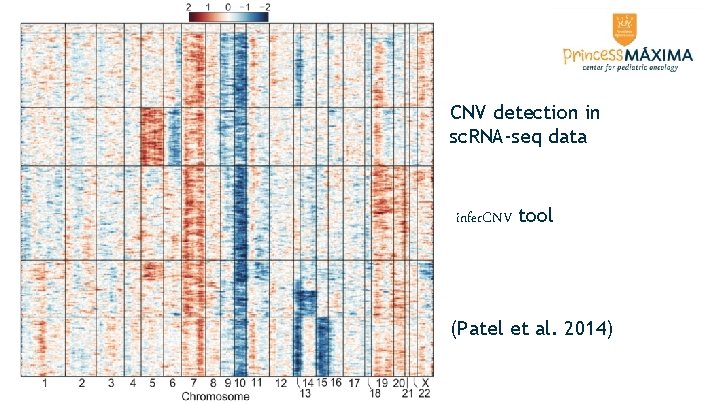
Identifying tumor cells Comparing to tumor cell line expression does not work Expression often similar to fibroblasts Sometimes possible to detect copy-number variations in sc. RNA-seq data Identify them by exclusion?
CNV detection in sc. RNA-seq data infer. CNV tool (Patel et al. 2014)
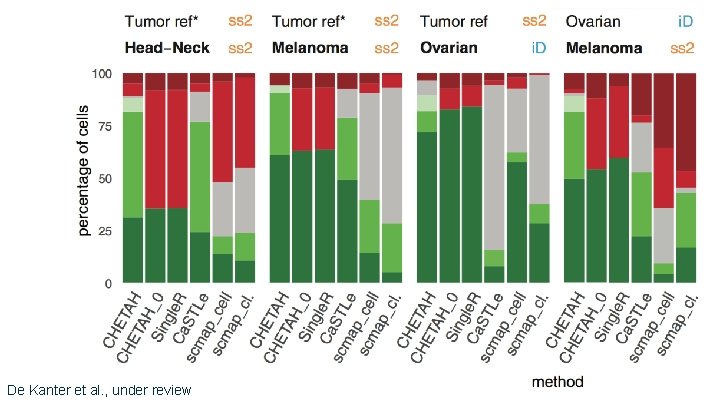
Methods scmap (Kiselev et al. , Nature Meth. 2018) Ca. STLe (Lieberman et al. , PLo. S ONE 2018) MOANA (Wagner & Yanai. , Bio. Rxiv 2018) Single. R (Aran et al. , Nature Immun. 2019) Super. CT (Xie et al. , NAR 2019) CHETAH (de Kanter et al. , Bio. Rxiv 2019, under review). . .
De Kanter et al. , under review
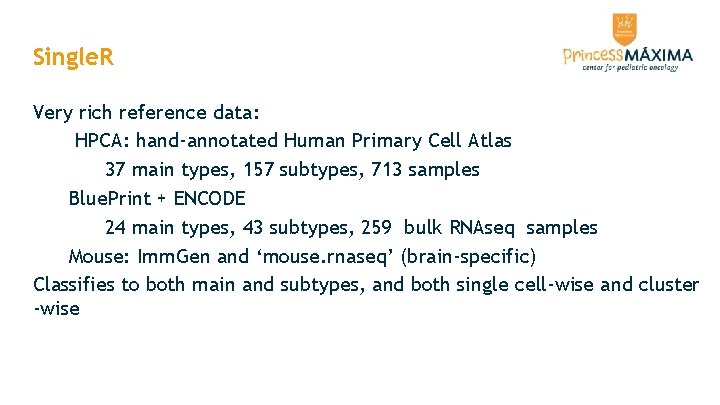
Single. R Very rich reference data: HPCA: hand-annotated Human Primary Cell Atlas 37 main types, 157 subtypes, 713 samples Blue. Print + ENCODE 24 main types, 43 subtypes, 259 bulk RNAseq samples Mouse: Imm. Gen and ‘mouse. rnaseq’ (brain-specific) Classifies to both main and subtypes, and both single cell-wise and cluster -wise
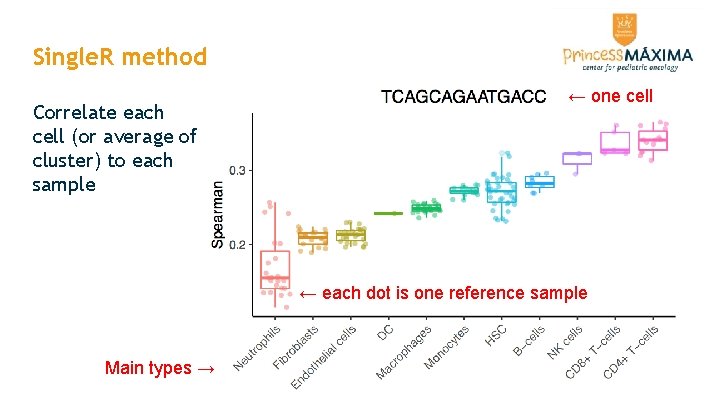
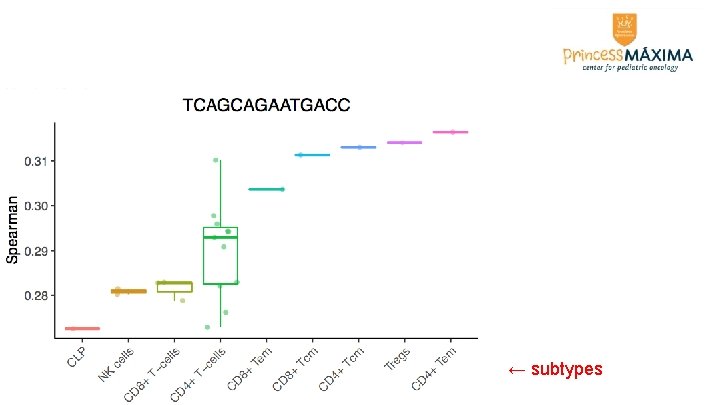
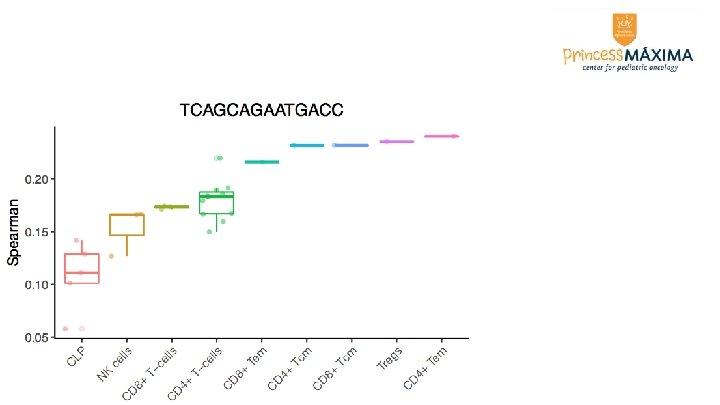
Single. R method Correlate each cell (or average of cluster) to each sample ← one cell ← each dot is one reference sample Main types →
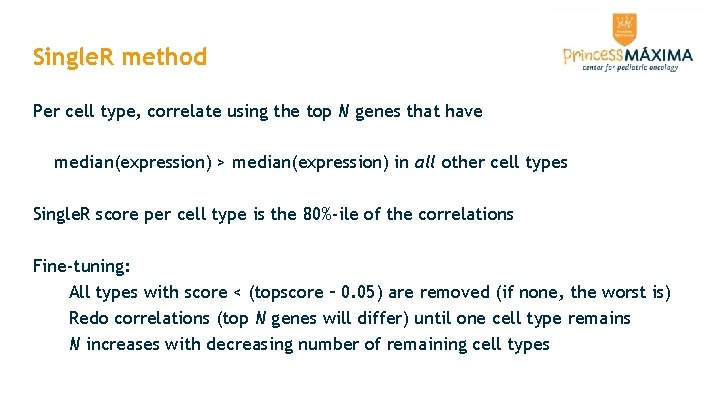
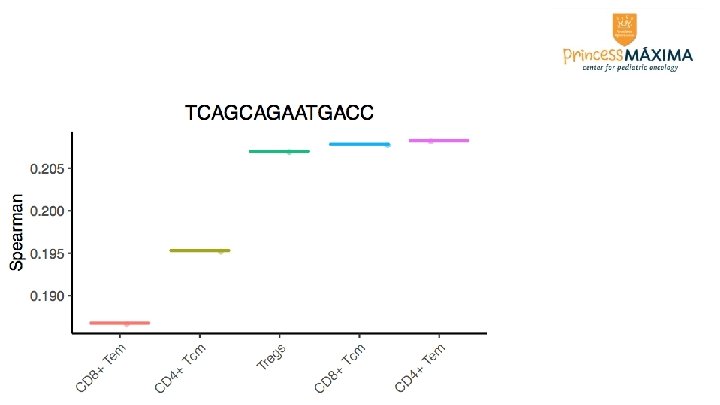
Single. R method Per cell type, correlate using the top N genes that have median(expression) > median(expression) in all other cell types Single. R score per cell type is the 80%-ile of the correlations Fine-tuning: All types with score < (topscore – 0. 05) are removed (if none, the worst is) Redo correlations (top N genes will differ) until one cell type remains N increases with decreasing number of remaining cell types
← subtypes
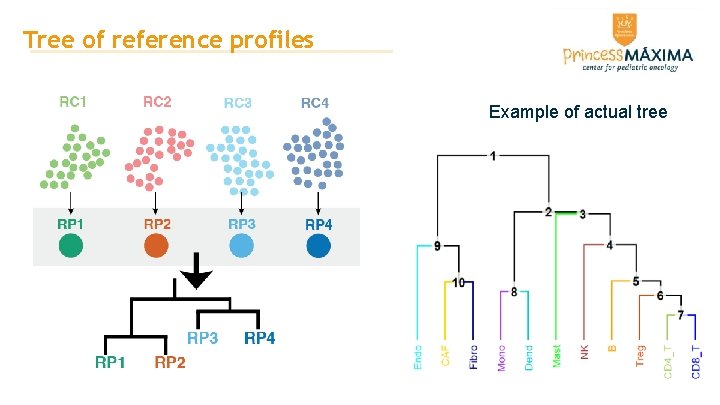
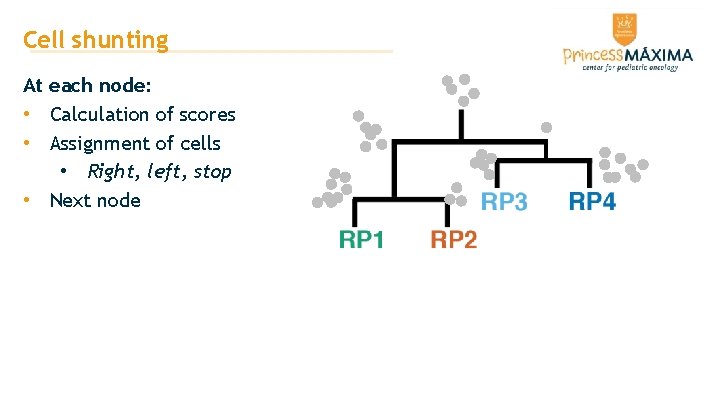
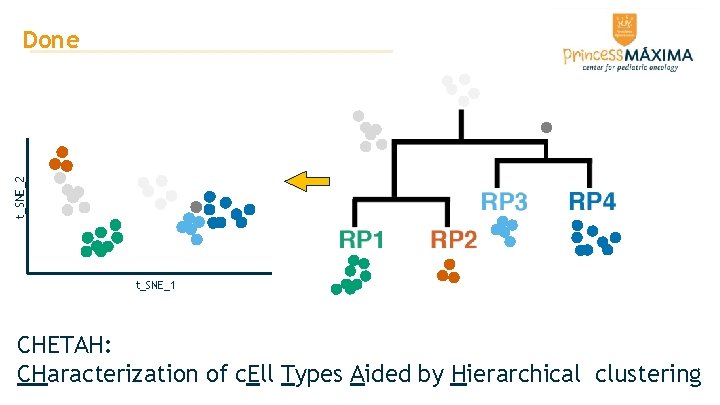
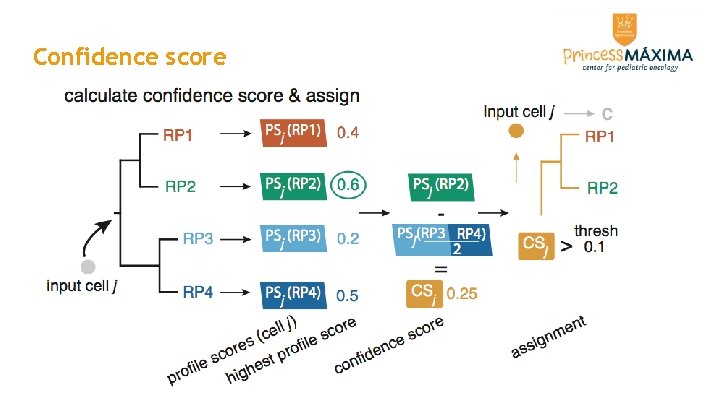
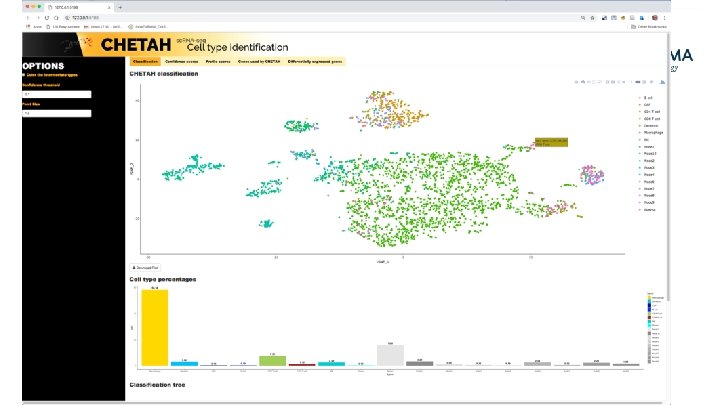
CHETAH • Classify cells by shunting cells down a hierarchy of cell types • Assign the most specific type you have evidence for • Allow intermediate cell types • Evidence expressed as confidence score • uses rank-based similarities called profile scores • requires single-cell RNA-seq data as a reference • Bioconductor, Bio. Rxiv, github. com/jdekanter/CHETAH/
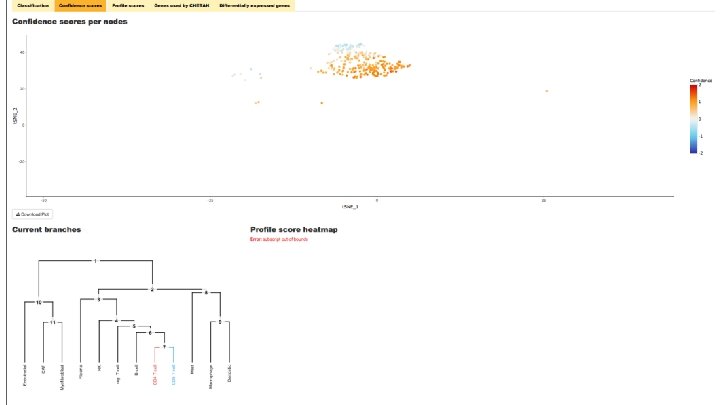
Tree of reference profiles Example of actual tree
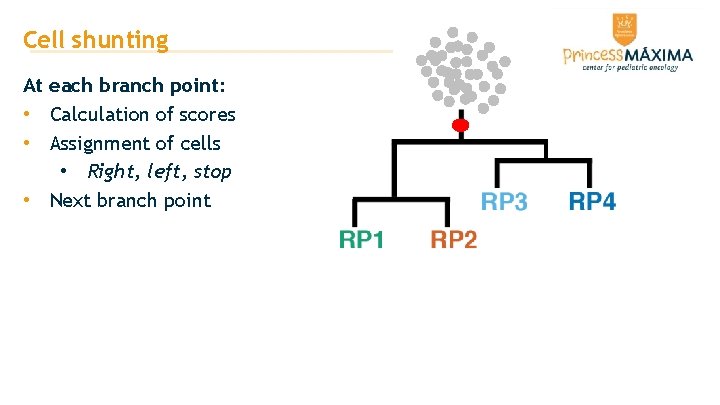
Cell shunting At each branch point: • Calculation of scores • Assignment of cells • Right, left, stop • Next branch point
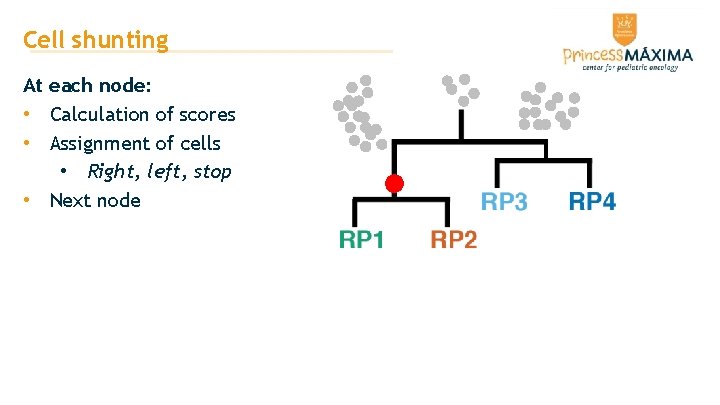
Cell shunting At each node: • Calculation of scores • Assignment of cells • Right, left, stop • Next node
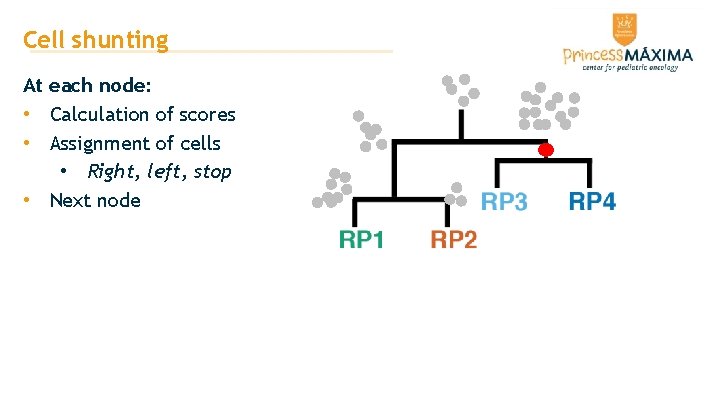
Cell shunting At each node: • Calculation of scores • Assignment of cells • Right, left, stop • Next node
Cell shunting At each node: • Calculation of scores • Assignment of cells • Right, left, stop • Next node
t_SNE_2 Done t_SNE_1 CHETAH: CHaracterization of c. Ell Types Aided by Hierarchical clustering
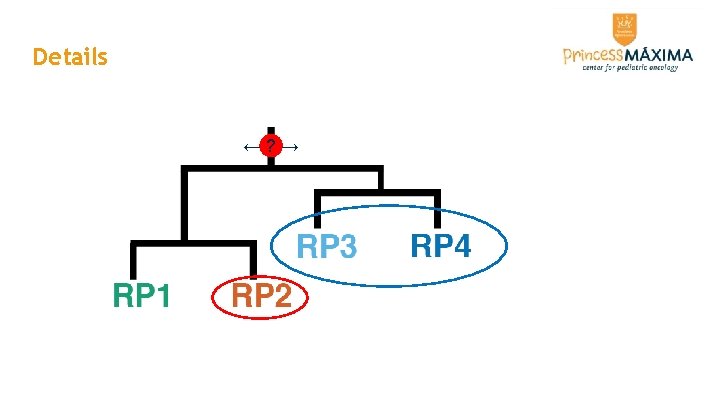
Details ←? →
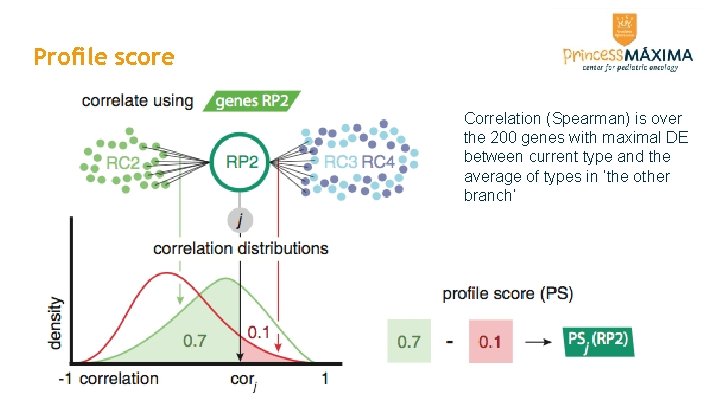
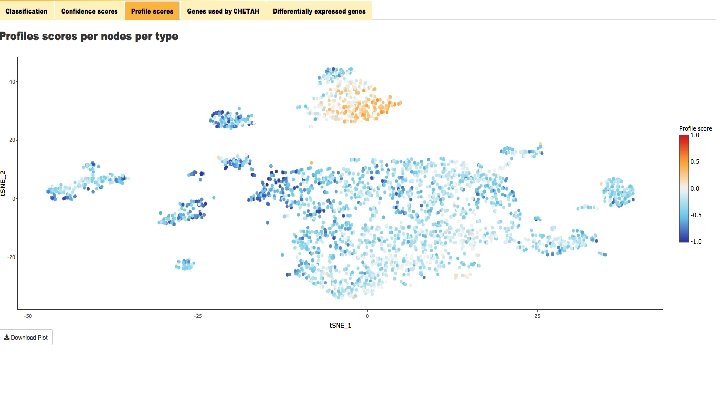
Profile score Correlation (Spearman) is over the 200 genes with maximal DE between current type and the average of types in ‘the other branch’
Confidence score
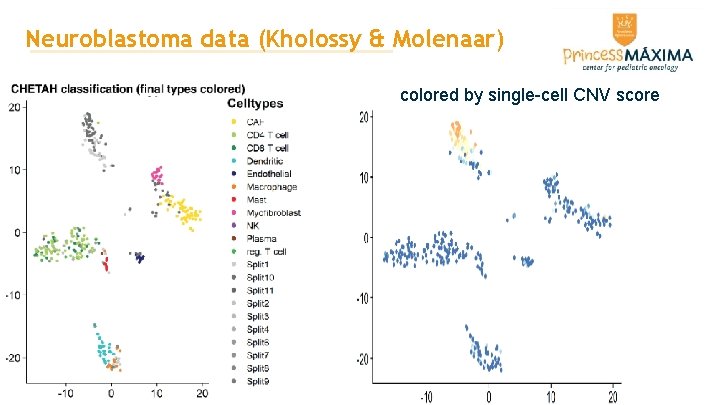
Neuroblastoma data (Kholossy & Molenaar) colored by single-cell CNV score
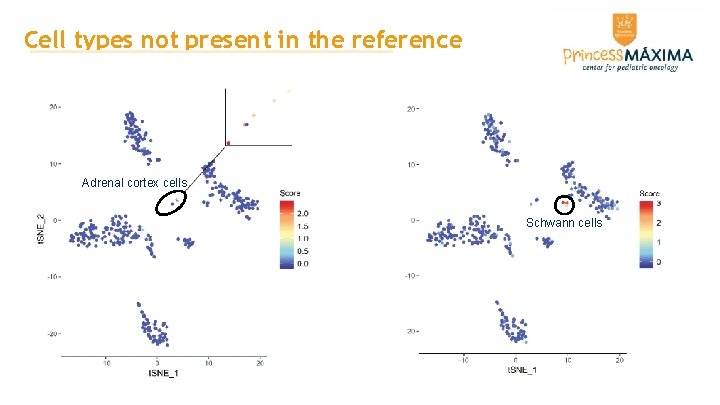
Cell types not present in the reference Adrenal cortex cells Schwann cells
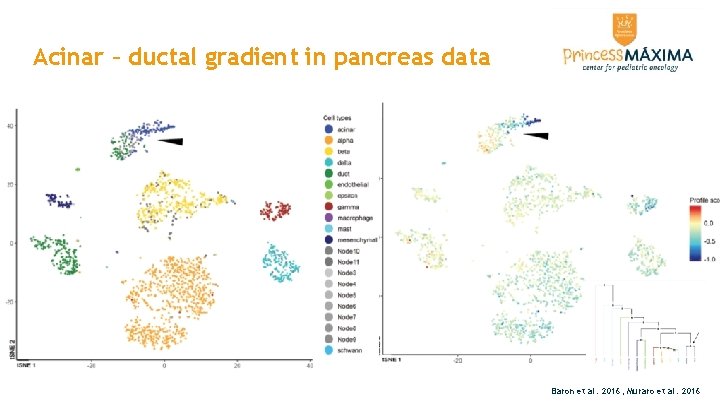
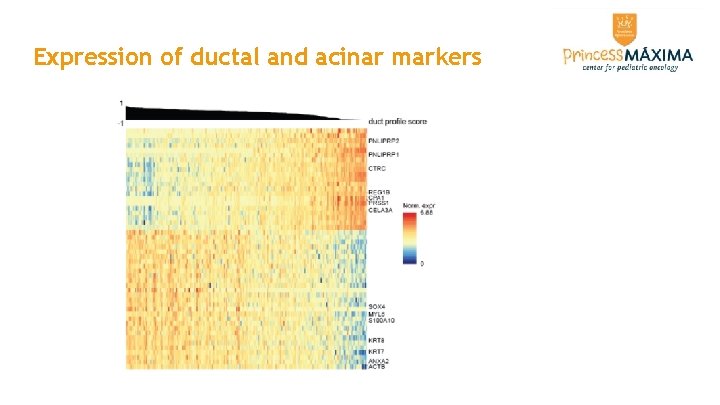
Acinar – ductal gradient in pancreas data Baron et al. 2016; Muraro et al. 2016
Expression of ductal and acinar markers
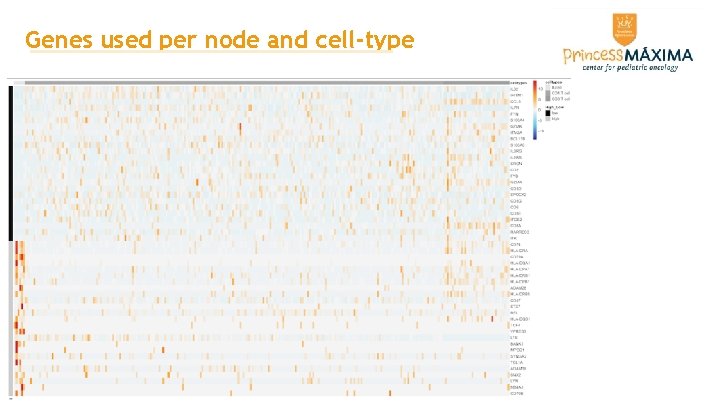
Genes used per node and cell-type
Thanks! Jurrian de Kanter Tito Candelli Thanasis Margaritis Frank Holstege Patrick Kemmeren Waleed Kholosy Jan Molenaar