The CELL CYCLE and MITOSIS Introducing the cell


")
 chromosome centomere single stranded (s/s) chromo some Chromatid")


")
 chromosome centomere single stranded (s/s) chromo some Chromatid")


- Slides: 25
The CELL CYCLE and MITOSIS
Introducing the cell cycle n Introduction to cell cycle
DNA IS ENCODES OUR GENETIC BLUEPRINT DNA IS PACKAGED INTO CHROMOSOMES RESULT: DNA MOLECULE IS PACKAGED INTO A CHROMOSOMES THAT IS 50, 000 X SHORTER THAN ITS EXTENDED LENGTH
SEM of chromosomes (d/s)
Chromosome structure double stranded (d/s) chromosome centomere single stranded (s/s) chromo some Chromatid
The cell cycle Enters own cell cycle May exit from cell cycle: Ageing and differentiation pathway
Introducing the cell cycle n Details of the Cell cycle and Mitosis
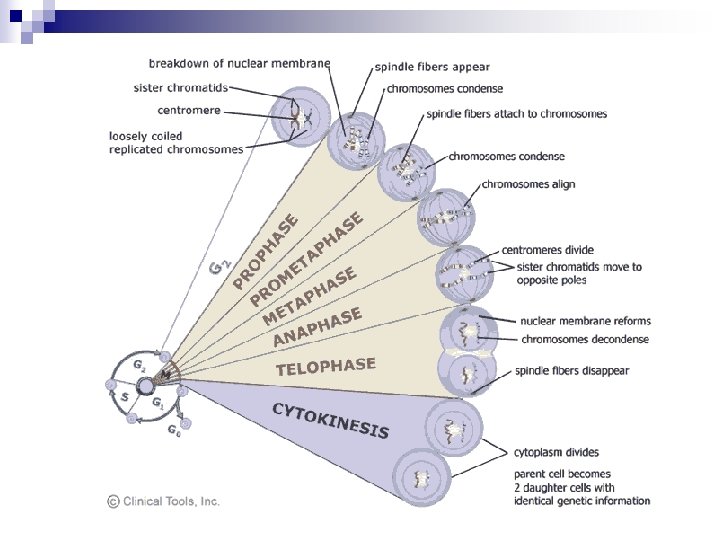
Stages of Mitosis: • Use the matching cards to form a table in the format shown on the next slide: • Finish the table in your notes by completing the description of each phase and then drawing a simple diagram of each phase.
Stage of Mitosis Interphase Prophase Metaphase Anaphase Telophase Interphase Description Drawing Photographed Image
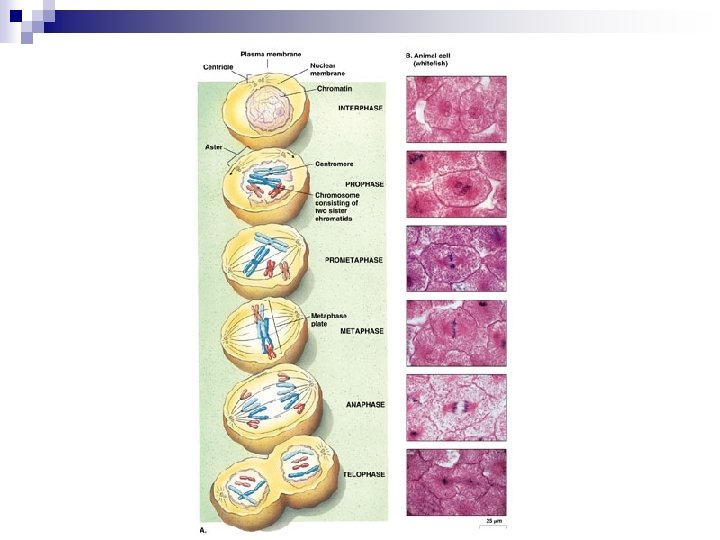
Real images: Stages of Mitosis A C D B
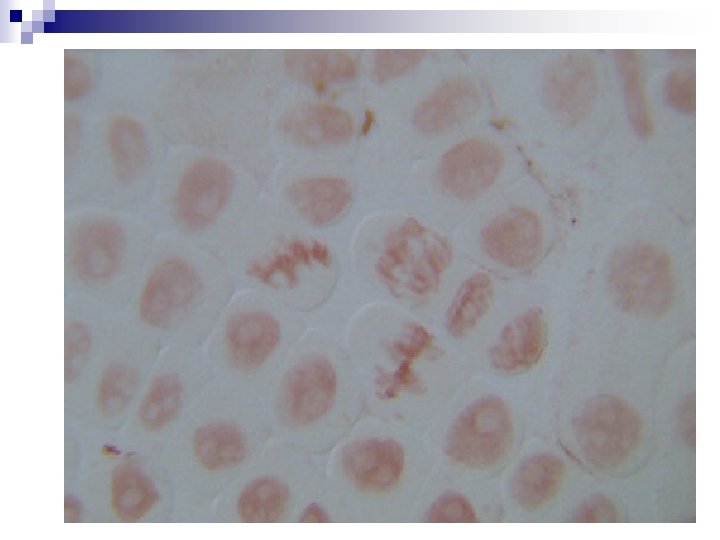
Cross Section Showing Cells in various stages of the cell cycle.
Now complete the activity Online garlic root tips: webaddress and question on work sheet. http: //www. biology. arizona. edu/c ell_bio/activities/cell_cycle/cell_ cycle. html
Read 79 -83 qu 9 -14 Additional slides that might help answer question that crop up
DNA IS ENCODES OUR GENETIC BLUEPRINT DNA IS PACKAGED INTO CHROMOSOMES RESULT: DNA MOLECULE IS PACKAGED INTO A CHROMOSOMES THAT IS 50, 000 X SHORTER THAN ITS EXTENDED LENGTH
SEM of chromosomes (d/s)
Chromosome structure double stranded (d/s) chromosome centomere single stranded (s/s) chromo some Chromatid
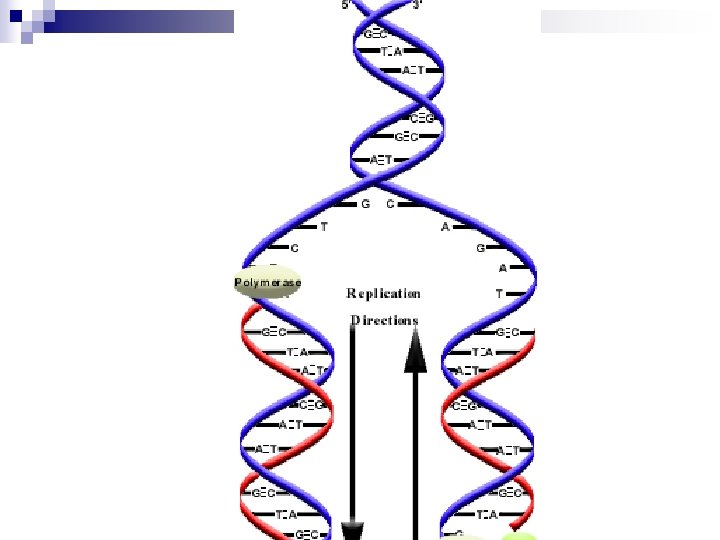
DNA Replication
Mitosis in garlic root tip
If cells are overlapping, squash the slide again. Avoid moving the coverslip from side to side. n Make sketches of (or take photographs of) cells that show any of the stages of mitosis. o Calculate the mitotic index. p Compare the mitotic index of root tips from alliums that have been sprouting for 1, 2, 5 and 10 days. q If available, compare the allium meristem tissue with that from other species. Teaching notes Cell division in flowering plants takes place in particular regions of the plant called meristems. Cells in meristems are not specialized for any particular function and Chromosomes in root tip tissue are made visible with the stain. Dividing cells (if present) will show up clearly with chromosomes in different forms according to the The links between the cellulose walls of plant cells are broken down by the treatment with hydrochloric acid. This ensures that the stain can penetrate the cells and The mitotic index is calculated like this: The duration of each stage of mitosis has been recorded and the data (see table below) could be used to compare the observed frequencies of the different stages
compare the observed frequencies of the different stages as recorded by student Stage Observed occurrence in representative microscope fields Duration number of cells % of total cells minutes % of total time Prophase 216 85. 0 71 85. 0 Metaphase 17 6. 5 7. 7 Anaphase 8 3. 3 2. 4 2. 9 Telophase 13 5. 1 3. 8 4. 4