Intergenerational Nutritional Effects Developmental Origins of Health and


")


 • Guatemala, 4 Villages, one pair of villages had")


 1966 Northern")
 Nurses Health Study I")
 Barker et al. J")


")


- Slides: 62
Intergenerational Nutritional Effects & Developmental Origins of Health and Disease 2012
Intergenerational Effects • Cohort studies – Maternal birthweight and fetal grown – Dutch famine studies • Experimental Study – Supplementation in Guatemala
Godfrey KM, Barker DJP, Robinson S, Osmond C. Mother's birthweight and diet in pregnancy in relation to the baby's thinness at birth. Br J Obstet Gynaecol 1997; 104: 663– 7
Illinois Study Coutinho et al. Am J Epi, 1997 146: 804 -809 • N=15, 287 Black and 117, 708 white matched pairs of infants and mothers. • Mothers were born between 1956 -75, infants between 19891991
Results • Father’s birthweight had effect on infant birthweight but not as strong as mothers. • Each 100 g increase in maternal birthweight was associated with 24 -27 g increase in infant birthweight
Dutch Famine Studies Susser and Stein, Nutrition Reviews, 1994 • Dutch famine winter lasted 6 months, from November 1944 - when nazis imposed transport embargo on west Holland until • May 7, 1945 when Holland was liberated from the occupation • Strong evidence for critical stages of development in several physiological systems
Dutch Hunger Winter: Calories
Affects of Famine • Fertility decreased • Maternal weight fell during pregnancy with famine exposure • Third trimester famine exposure had strong effect on birthweight • Third trimester famine exposure was associated with infant mortality at 30 -90 days
Birth Cohorts
Obesity in Young Men after Famine Exposure in Utero and early Infancy (Ravelli et al NEJM, 1976) • N=300, 000 Dutch military inductees at age 19 • Famine exposure in first 2 trimesters lead to 80% higher prevalence of overweight (p<0. 0005) • Famine exposure in last trimester or famine exposure in first 5 months of life associated with 40% lower prevalence of overweight (p<0. 005)
Adult Obesity
Other Impacts of Famine Exposure • Excess central nervous system disorders (such as NTD) • Schizophrenia (Hulshoff et al. J Psychiatry. 2000) – Famine exposure associated with twofold risk of schizophrenia in 50 year old women. – Prenatal famine exposure in patients with schizophrenia was associated with decreased intracranial volume. – Prenatal Hunger Winter exposure alone was related to an increase in brain abnormalities, predominantly white matter hyperintensities. • Major Affective Disorder (Brown et al. J Psychiatry, 2000) – Risk of developing major affective disorder requiring hospitalization increased significantly for subjects with exposure in the third trimester, relative to unexposed subjects.
Survival effects of prenatal famine exposure. Van Abeelen et al. Am J Clin Nutr. 2012
Other Famine Studies • China; 1959 -1961; FU 2008 (Zheng et al. Eur J Clin Nutr, 2012) • Women (n=1924) exposed to famine had higher risk of metabolic syndrome with fetal exposure (OR 1. 87, 1. 15 -3. 04) & postnatal exposure (OR 1. 50, 1. 20 -1. 87) • NS for men (n=3116) • Biafra; 1967 -1970; FU 2009 (Hult et al. Plo. S ONE, 2010): • Fetal/infant exposure associated with increased prevalence of hypertension & obesity, higher waist circumference & blood glucose levels (n=1339)
Intergenerational Impacts of Dutch Famine A mother's exposure to famine prior to conception of her offspring was associated with lower self-reported measures of mental health and quality of life in her adult offspring. Children born to women who themselves were exposed to the famine while they were in utero have increased neonatal adiposity and poor health 1. 8 (95% CI 1. 12. 7) times more frequently in later life (due to miscellaneous causes) Stein et al. Epidemiology. 2009 Nov; 20(6): 909 -15 Painter et al. BJOG, 2008 Sep; 115(10): 12431249.
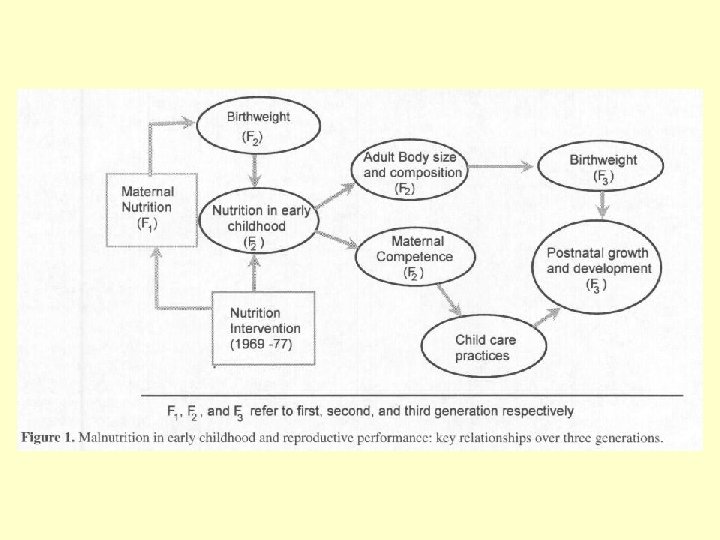
Reproductive performance and nutrition during childhood Nutrition Reviews; Washington; Apr 1996; Martorell, Reynaldo; Ramakrishnan, Usha; Schroeder, Dirk G; Ruel, Marie;
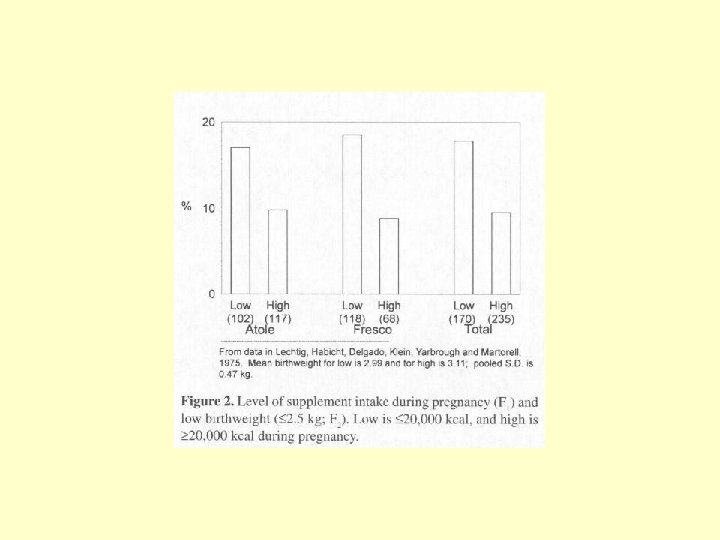
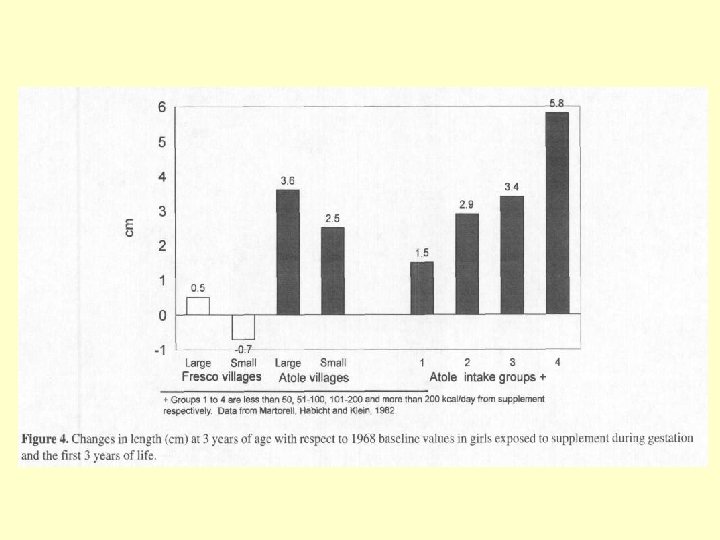
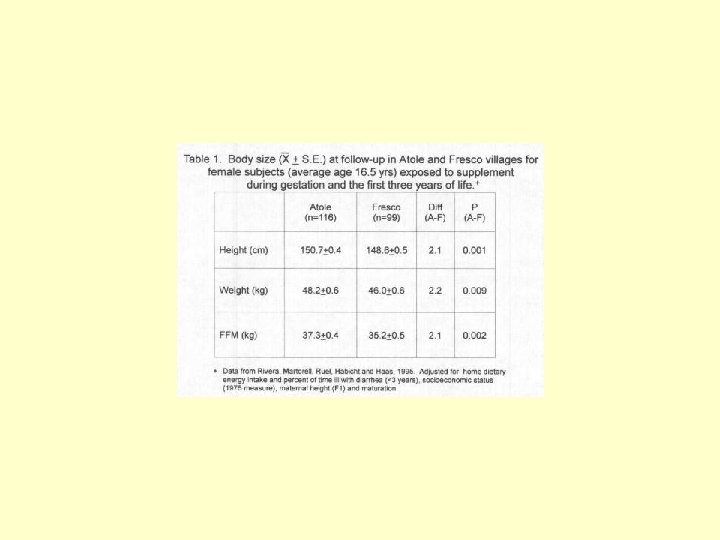
Longitudinal Supplementation Trial (1969 -1977) • Guatemala, 4 Villages, one pair of villages had about 900 people each and the other about 500 each. • 2 each randomized to: • Atole (Incaparina, a vegetable protein mix developed by INCAP*, dry skim milk, sugar, and flavoring, 163 kcal/cup, 11/5 g protein) • Fresco (flavored drink with sugar, vitamins and minerals, 59 kcal/cup) *Institute of Nutrition of Central America and Panama
• Feeding center was open daily for over 7 years, from 1969 to 1977. • Anyone in the village could attend, but careful recording of consumption, including of additional servings as well as of leftovers, was done only for women who were pregnant or breastfeeding and for children 7 years or younger. • Supplements were available twice daily, in midmorning and midafternoon, so as not to interfere with meal times.
Conceptual framework “Malnutrition in early childhood constrains the future capacity of women to bear healthy newborns and their ability to feed and care for them, and through these mechanisms the growth and development of the next generation. ”
Follow-Up data - 1990 s • The prevalence of low birthweight is currently 12% in Atole villages (n = 65) and 28% in Fresco villages (n = 58) among women exposed to the supplements during the intrauterine period and the first 3 years of life. • Mean birthweights are 2. 90 kg in Atole villages and 2. 73 in Fresco villages.
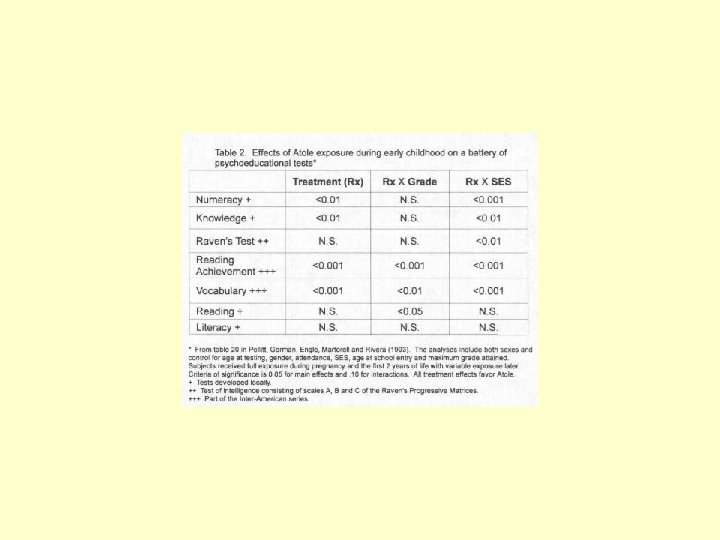
Role of intergenerational effects on linear growth (Ramakrishnan et al, J Nutr, 1999 • Sample: 215 mothers who were born during the original longitudinal study (1969 -1977) and their own offspring. • Results: – For every 100 g increase in maternal birth weight, her infant's birth weight increased by 29 g after adjusting for the effects of maternal age, gestational age and sex of the infant. (P < 0. 001) – For every centimeter increase in maternal birth length, her child's birth weight increased by 53 g.
Fetal Nutrition and Chronic Diseases of Adulthood • Epi studies • Explanatory models • Mechanisms
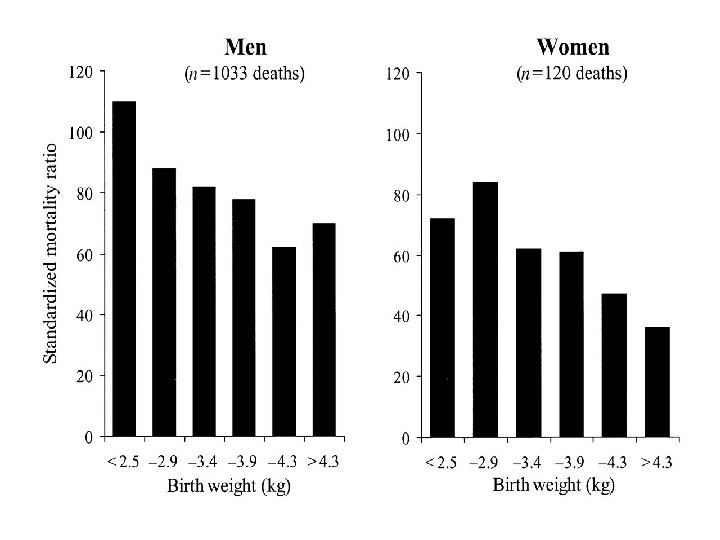
Coronary heart disease death rates, expressed as standardized mortality ratios, in 10, 141 men and 5585 women born in Hertfordshire, United Kingdom, from 1911 to 1930, according to birth weight. (Osmond C, Barker DJP, Winter PD, Fall CHD, Simmonds SJ. Early growth and death from cardiovascular disease in women. BMJ 1993; 307: 1519– 24)
Age-adjusted Relative Risk of Non- fatal Coronary Heart Disease and Stroke 1. 50 Relative Risk Mean ± 95% CL 1. 25 1. 00 0. 75 0. 50 5. 0 7. 5 10. 0 Birthweight 121, 700 American Nurses, self report study BMJ 315: 396, 1997
Catch-up growth in childhood and death from coronary heart disease: longitudinal study (Eriksson et al, BMJ, 1999) • Subjects: 3641 men born in Helsinki between 1924 -1933 • Followed with school data for weight and height • Deaths from coronary heart disease from 1971 -95 (standardized mortality ratios) were endpoints.
Catch-up growth in childhood and death from coronary heart disease: longitudinal study (Eriksson et al, BMJ, 1999 • Men who had low birth weight or were thin at birth have high death rates from coronary heart disease • Death rates are even higher if weight "catches up" in early childhood • Death from coronary heart disease may be a consequence of prenatal undernutrition followed by improved postnatal nutrition • Programs to reduce obesity among boys may need to focus on those who had low birth weight or who were thin at birth
David J. P. Barker, F. R. S. , Clive Osmond, Ph. D. , Tom J. Forsén, M. D. , Eero Kajantie, M. D. , and Johan G. Eriksson, M. D. Trajectories of Growth among Children Who Have Coronary Events as Adults. N Engl J Med 2005; 353: 1802 -9.
Diabetes in Low-Birth-Weight Men 370 men Age 64 yrs 8 30 6 20 4 10 2 0 0 <5. 5 6. 5 7. 5 8. 5 9. 5 Birth Weight (lbs) >9. 5 Odds Ratio/Adj for BMI % Impaired Gluc Tol or DM 40 Gestat’l DM Hales et al. BMJ 303: 1019, 1991
Birth Weight Predicts Blood Pressure at Age 31 Sys BP (mm. Hg) 1966 Northern Finland Birth Cohort +/- adjust for current BMI n = 5960 offspring 130 128 126 124 122 <2500 -2999 -3499 -3999 -4499 >4500 Birth Weight (gm) Jarvelin M et al. Hypertension 2004 Variables: Birth Weight Ponderal Index Sex Gestational age Mat’l Ht, Wt Parity Socioeconomic Current BMI
Birthweight and Adult HTN in US Women HTN Prevalence (%) Nurses Health Study I 40 Age 46 -71 8. 4% 30 15 10 3. 1% Age 30 -55 < 5. 0 -5. 5 5. 6 -7. 0 7. 1 -8. 5 8. 6 -10. 0 Birthweight Category (lbs)
Early Growth Patterns Predict Adult HTN } Cohort Average (n=8760) Barker et al. J HTN 20: 1951, 2002.
Fetal Milieu Affects Obesity Risk Trouble at Both Ends of the Birth Weight Spectrum Odds Ratio For Obesity Birth Weight (kg) Eriksson J et al Internatl J Obesity 2001
Framework for understanding the maternal regulation of fetal development and programming Godfrey & Barker. Fetal nutrition and adult disease. Am J Clin Nutr 2000 71: 1344 -1352.
Barker’s Fetal Origins Theory • Coronary heart disease, stroke, type 2 diabetes, hypertension and osteoporosis, originate through developmental plasticity, in response to malnutrition during fetal life and infancy. Certain cancers, including breast cancer, also originate in fetal life. Barker DJP. The origins of the developmental origins theory. J Intern Med. 2007.
Fetal Origins Concepts Barker et al • Nutrition in early life has permanent effects. • Undernutrition has different effects at different times of life. • Rapidly growing fetuses and neonates are vulnerable to undernutrition. • Undernutrition results from inadequate maternal intake, transport, or transfer of nutrients.
The Barker Hypothesis Fetal Origins of Adult Disease Adverse intrauterine events permanently “program” postnatal structure/function/homeostasis “Adapted Birth Phenotype” * * Better chance of fetal survival Increased risk of adult disease Susan P. Bagby, MD, Professor of Medicine & Physiology/Pharmacology Division of Nephrology & Hypertension OHSU, Portland, OR
FETAL ORIGINS OF ADULT CVASC DISEASE In Utero Birth Adverse Intrauterine Events Low Birthweight/IUGR MODIFIERS Childhood Adulthood COFACTORS Adult “Metabolic Syndrome” Abd’l Obesity CAD HTN Diabetes TG/ HDL Renal Failure
Proposed Mechanisms of Early Programming • Permanent structural changes • Epigenetic programming of gene expression • Accelerated cellular aging Tarry-Adkins & Ozanne. Mechanisms of early life programming: current knowledge and future directions. Am J Clin Nutr. 2011.
Adverse Intrauterine Events Asymmetric Growth Restriction * Low Birth Weight for Gestational Age * Low Wt: Height Ratio (thinness) * Relative sparing of heart, brain, adrenal * Disproportionate reduction of kidney, liver, pancreas, skeletal muscle mass * Reduced abdominal girth
Fetal Origins of Adult Disease * Thin * Small abdominal girth ( liver size) * Low arm circumference ( muscle mass) * Preserved From Barker, 1998 central fat mass Asymmetric Growth Restriction “More powerful predictor than other risk factors”
? % Growth-Restricted Phenotype in Lower Birth Weight Categories Conceptual Graph
Potential Mechanisms of Developmental Programming Structural Deficits Reduced Functional Units in Organs Kidney Nephron # Pancreas Islet Cell # HTN Insulin secretion Glucose Muscle muscle mass Basal met rate Exercise capacity Heart myocyte # Risk CHF Liver cells # ? lipid metabolism
What Conveys Risk of HTN in Lower Birth-weight Offspring ? Brenner et al. 1988, 1994 Low Birth Wt, Low Nephron Number and HTN “… retardation of renal development as occurs in individuals of low birth weight gives rise to increased postnatal risks for systemic and glomerular hypertension as well as enhanced risk of expression of renal disease. ” 2 1 Am J HTN 1988 1: 335 -47; 2 Am J Kid Dis 1994 23: 171
New Nephrons Form in Concentric Layers during Gestation Condensing Mesenchyme Comma Shaped Bodies Glomeruli Outer Nephrogenic Layer Branching Morphogenesis Nephrogenesis
Ages 1 -17 yrs In Term Births: Birth Weight Predicts Nephron Number All Ages 230, 000 nephrons per kg increase in birth weight Hughson et al, Kid Internat (2003) 63, 2113 Also: Merlet-Benichou et al, 1999 Manalich et al, 2000
Maternal Protein Deficiency Asymmetric Growth Restriction in Utero “The Thrifty Phenotype” Impaired Kidney Development # Nephrons (permanent) FOOD CATCH-UP GROWTH # Nephrons BODY MASS BP
Epigenetics • Epigenetics = the study of stable alterations in gene expression that arise during development and cell proliferation. • Epigenetic phenomena do NOT change the actual, primary genetic sequence. • Epigenetic phenomena modulate when and at what level genes are expressed. • The protein context of a cell can be understood as an epigenetic phenomena. http: //cnx. rice. edu/content/m 11532/latest/
Epigenetic Mechanisms for Nutrition Determinants of Later Health Outcomes (Zeisel, Am J Clin Nutr, 2009) • “Epigenetic code is a series of marks added to DNA or to proteins (histones) around which DNA is wrapped. ” • Methylation, covalent modifications of histones and chromatin and RNA • Some “marks” can be inherited • Examples of the impact of this inheritance: • Grandmother’s smoking in pregnancy & risk of asthma in grandchildren • Brains from suicide victims, methylation of 5’ regulatory region of genes encoding ribosomal RNA associated with early childhood abuse & neglect
FIGURE 1 Epigenetic marks alter gene expression Zeisel, S. H Am J Clin Nutr 2009; 89: 1488 S-1493 S Copyright © 2009 The American Society for Nutrition
Fig. 2. General example of epigenetic regulation of gene transcription. Epigenetic regulation of gene expression is characterized by stable changes to DNA and chromatin structure that alter gene expression independent of gene sequence. The primary forms of epigenetic control involve DNA methylation by DNA methyl-transferase (DNMTs), and histone tail modifications, such as acetylation/deacetylation, by histone acetyl-transferase (HAT) and histone deacetylase (HDAC) activities, respectively. Additionally, micro. RNAs have recently been shown to regulate DNA methylation as well. Histone tail acetylation promotes an open -chromatin conformation, and is associated with regions of active gene expression, while histone tail deacetylation promotes a closed-chromatin conformation and is associated with gene silencing. DNA methylation of cytosine guanine (Cp. G) dinucleotides in the 5' promoter region of genes generally induces transcriptional silencing, both by blocking transcription factor binding and by promoting the recruitment of transcriptional corepressors or histone-modifying complexes. Me. BP, methyl-Cp. G binding protein; TF, transcription factor; Pol II, DNA polymerase II. Heerwagen, M. J. R. et al. Am J Physiol Regul Integr Comp Physiol 299: R 711 -R 722 2010; Copyright © 2010 American Physiological Society
Mechanisms Emerging… Sandovici et al. Proc Natl Acad Sci. 2011 • Transcription factor Hnf 4 a, implicated in the etiology of type 2 diabetes (T 2 D) • Transcriptional activity of Hnf 4 a in islets is restricted to the distal P 2 promoter through its open chromatin configuration and an islet-specific interaction between the P 2 promoter and a downstream enhancer. • Exposure to suboptimal nutrition during early development leads to epigenetic silencing at the enhancer region, which weakens the P 2 promoter–enhancer interaction and results in a permanent reduction in Hnf 4 a expression. • Aging leads to progressive epigenetic silencing of the entire Hnf 4 a locus in islets, an effect that is more pronounced in rats exposed to a poor maternal diet.
DNA methylation differences after exposure to prenatal famine are common and timing- and sexspecific. Tobi et al, Hum Mol Genet. 2009 Nov 1; 18(21): 4046 -53 • Methylation of INSIGF was lower among individuals who were periconceptionally exposed to the famine (n = 60) compared with their unexposed same-sex siblings • Methylation of IL 10, LEP, ABCA 1, GNASAS and MEG 3 was higher • “persistent changes in DNA methylation may be a common consequence of prenatal famine”
Accelerated Cellular Aging • Poor maternal nutrition followed by accelerated postnatal growth leads to telomere shortening and increased markers of cell senescence in rat islets. (Tarry-Adkins, et al. FASEB J, 2009) – Shorter telomeres in rats exposed to gestational protein restriction compared to controls. • Poor maternal nutrition followed by accelerated postnatal growth leads to alterations in DNA damage and repair, oxidative and nitrosative stress, and oxidative defense capacity in rat heart. (Tarry-adkins, et al. FASEB J, 2012) – “poor fetal nutrition followed by accelerated postnatal growth results in increased cardiac nitrosative and oxidative-stress and DNA damage, which could contribute to age-associated disease risk. ”
Developmental programming of type 2 diabetes and cardiovascular disease. Martin-Gronert M S , Ozanne S E J. Nutr. 2010; 140: 662 -666 © 2010 by American Society for Nutrition
Early Risk Determinants and Later Health Outcomes: Research Priorities (Field, Am J Clin Nutr, 2009) • ID biological mechanisms responsible for lasting and later health effects • ID genes; research on genomics, metabolomics and epigenetics • Understand imbalanced nutrition; focus on overnutrition during critical periods • Understand social/environmental factors that influence critical windows • ID how and when to intervene to prevent later disease
UN Standing Committee on Nutrition, 2006 While undernutrition kills in early life, it also leads to a high risk of disease and death later in life. This double burden of malnutrition has common causes, inadequate foetal and infant and young child nutrition followed by exposure (including through marketing practices) to unhealthy energy dense nutrient poor foods and lack of physical activity. The window of opportunity lies from pre-pregnancy to around 24 months of a child’s age.