Injury surveillance Marie Hasselberg Karolinska Institutet Department of

Injury surveillance Marie Hasselberg Karolinska Institutet Department of Public Health Sciences marie. hasselberg@ki. se Research group Marie Hasselberg ki. se/phs/isac 1

Outline Ø Injuries – definition and distribution Ø Injury intent and injury mechanisms Ø Data sources Marie Hasselberg 2

What the concept encompasses § Unintentional injuries ð Road traffic injuries ð Poisoning ð Falls ð Fires ð Drowning ð Other unintentional injuries (e. g. animal bites, electrocution) § Intentional (i. e. deliberate) injuries ð Self-inflicted ð Interpersonal violence ð War ð Other intentional injuries § Undetermined intent Marie Hasselberg 3

Death Crash/ac cident Marie Hasselberg Injury Severe injury No injury Minor injury 4

Injury process according to Haddon Pre-crash • Causes influencin g the accident 5 Crash • Factors influencin g the injury Post-crash • Factors influencin g the severity of injury 2021 -03 -05 Marie Hasselber

Some specificity Ø Related morbidity very high Ø If you survive one injury, you can have another one, and… Ø Gender differences – in magnitude and in kind Ø Can both result from and lead to poverty Marie Hasselberg 6

How does it look like in the world? injury quiz Marie Hasselberg 7

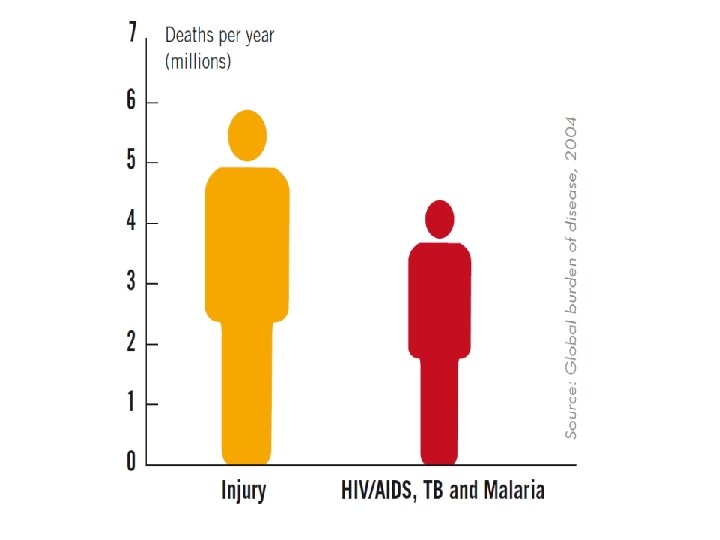
An estimated 5. 8 million people die from injuries every year 10% world’s death & 12% world’s burden of disease About 14 000 people every day die from injuries Marie Hasselberg 8

Global injury mortality by cause, 2012 At least 1. 25 million people die each year in the traffic 20 to 50 millions are severely injured or disabled due to traffic crashes Other 18% RTI 24% War 2% Intentional Injuries 28% Homicide 10% Falls 14% Other unintentional Injuries 30% Suicide 16% Drowning 7% Poisoning Fire-related burns 5% Marie Hasselberg Källa: WHO 2014 10

Injuries are not random Some statistics………. Marie Hasselberg 11

Among children the number of fatalities per 100, 000 is six times higher in LMIC HIC More than 90 % of all deaths from injuries occur in low and middle income countries LMIC Marie Hasselberg 12

Injury death rates by country income level, 2012 Injury deaths per 100 000 population 100 80 60 40 20 0 Low Marie Hasselberg Lower-middle. Upper-middle High World 13

Distribution by cause of unintentional injury deaths LMIC HIC Other 27% Road Traffic Injury 34% Other 30% Road Traffic Injury 33% Drowning 5% Drowning 10% Fires 3% Marie Hasselberg Falls 22% Poisoning 9% Fires 8% Falls 10% Poisoning 9% Source: Chandran et al. Epidemiologic Reviews 2010 14

Which region has the highest injury fatality rate per 100 000 population for each injury mechanism? Differences between regions Traffic mortality South East Asia LMIC Drowning Europe LMIC Fires Africa LMIC Poisoning Eastern Mediterranean region MIC Marie Hasselberg 15

Regional perspective Road traffic injury fatality rates* per 100 000 population, by WHO region and income group

80 % Deaths 70 60 50 40 30 20 10 0 In a di nd la i ha T ka a si e n I o nd i Sr n La LMC Marie Hasselberg s ay M al ia an p Ja e h et n rla ay ds N HIC N w or lia a tr us SA U A Source: Mohan. Int J Epidem 17 2002: 31; 527 -532

Deaths per 100 000 pop Regions Drowning Africa LMIC 13. 1 Western Pacific China 12. 3 Europe LMIC 9. 2 South East Asia India 7. 6 Marie Hasselberg 18

Fires Deaths per 100 000 pop Regions Fires South East Asia India 8. 3 South East Asia other LMIC 8. 2 Africa LMIC 5. 5 Eastern Mediterranean LMIC 4. 8 Nearly 11 times higher for children in LMIC compared to HIC Marie Hasselberg 19

Burns Ø Globally, an estimated 195 000 deaths every year are caused by firerelated burns Ø The vast majority occur in low- and middle-income countries Ø Non-fatal burns are a leading cause of morbidity, including prolonged hospitalization, disfigurement and disability, often with resulting stigma and rejection Ø Burns occur mainly in the home and workplace Marie Hasselberg 20

Poisoning Deaths per 100 000 pop Poisoning Europe LMIC 21. 5 South East Asia India 7. 0 Africa LMIC 5. 6 America HIC 3. 9 Marie Hasselberg 21

Age and gender differences Marie Hasselberg 22
 30")
Age distribution of global injury-related mortality, 2000 No. of deaths (% of total) 30 15 -44 years account for almost 50 % of injury related mortality 25 20 15 10 5 0 0 -4 Source: WHO, The Injury Chartbook, 2002 Marie Hasselberg 5 -14 15 -29 30 -44 45 -59 60 -69 70 -79 > 80 Age (years) 23

Mortality per 100, 000 by cause of death and age, percentage of men and women 0– 90 years during the period 1997– 2001. Marie Hasselberg 24

The facts Marie Hasselberg 25

Age distribution by injury diagnosis Hospital treated injuries, 1987 -1994 Number of injuries/ 10 000 16 14 12 10 8 6 4 2 24 22 20 18 16 14 12 10 8 6 4 2 0 AGE Marie Hasselberg . 26

Age distribution by injury diagnosis Hospital treated injuries, 1987 -1994 Number of injuries/ 10 000 24 22 20 18 16 14 12 10 8 6 4 2 0 AGE Marie Hasselberg . 27

Fall injuries per 100 000 children, 1998 – 2000, hospital treated 600 500 400 Falls/100 000 children 300 200 100 0 0 -3 Source Ep. C, 2002 4 -6 Age groups 7 - 12 13 - 17
 Females in SEAR – highest fire-related")
Gender differences in mortality (per 100 000 pop) Females in SEAR – highest fire-related burn mortality RTI Poisoning Falls In some regions suicide in females are as high or higher than in males Fires Drowning Self-inflicted violence Interpersonal violence 0 5 10 15 Male Marie Hasselberg 20 25 30 35 Female 29

Type of data sources depends on severity level and injury mechanism Marie Hasselberg 30

Marie Hasselberg 31
 as they")
Vital registration system – used to document vital events (births and deaths) as they occur in a given population. The information comes from civil registration systems. Mortuary-based injury surveillance systems - using simplified forms and logbooks Verbal autopsy – in areas without medical death certification, health-care worker collects information by asking questions of caregivers or other family members about the signs and symptoms exhibited by the deceased before death. Marie Hasselberg 32

Tracking injury mortality is important – both severe, easily measured and comparable Immediate cause of death – The disease or injury directly leading to death Underlying cause of death – The disease or injury which initiated the train of morbid events leading directly to death’ and provides rules for its determination Contributory cause of death – Diseases or injuries that contributed to the fatal outcome. Multiple causes - Pneumonia – Hip fracture - Fall Marie Hasselberg 33

Sweden 1950 - 2007 60 Cars /100 000 50 40 People killed in traffic 1970 – 1 307 people 2008 – 355 people 30 20 10 Death/100 000 1953 1956 1959 1962 1965 1968 1971 1974 1977 1980 1983 1986 1989 1992 1995 1998 2001 2004 2007 0 Marie Hasselberg 34
 ICD 9 (E-codes) •")
• Hospital-based data, ICD 10 (V 01 -X 59) ICD 9 (E-codes) • Emergency Department data, Trauma register • Police registered injuries • Public health surveys • Household surveys Marie Hasselberg 35

External causes of morbidity and mortality – chapter XX ICD 10 Ø Transport accidents V 01 -V 99 (pedestrians, bicyclist, MC, cars etc) Ø Falls W 00 -W 19 Ø Drowning W 65 -W 74 (unintentional) Ø Burn injuries W 85 -W 99, X 00 -X 19 (electrical, fire-related, hot substances) Ø Poisoning X 40 -X 49 Ø Intentional self-harm X 60 -X 84 Ø Assault X 85 -Y 09 Ø Undetermined intent Y 85 -Y 09 Marie Hasselberg 36
 1971, updated since then, , most recently")
Injury severity ”Threat-to-life” AIS (Abbreviated Injury Scale) 1971, updated since then, , most recently 2015 Every injury is categorized according to 9 body parts and severity level 1 (minor injury) 6 (maximum injury) A panel of trauma-experter MAIS (Maximum AIS) The highest AIS-value ISS (Injury Severity Score) 6 body parts The sum of the square of the highest AIS-values for the 3 most severely injured body parts. Was developed since AIS was not linearly correlated with the risk of dying, instead the square of the highest values. The sum of the square of the 3 most severe injuries irrespective of body part Was developed to identify multiple injuries within the same body part. 1974 NISS (New Injury Severity Score) 1990 -talet Marie Hasselberg Predicts well mortality in hospital Källa: Gedeborg et al. Internationally comparable diagnosisspecific survival probabilities for calculation of the ICD-10– based Injury Severity Score. Journal of Trauma and Acute Care Surgery. 76(2): 358– 365, 2014 37

Long term consequences of injury Low correlation between the immediate outcome after an injury and the long term consequences. When AIS 3+ is used as a criteria for severe injury it means that thorax injuries are prioritized before injuries to the legs or neck injuries. Injuries to the legs and neck injuries have a lower risk to die than thorax injuries and because of that a lower AIS-value, but these types of injury often result in long term consequences and permanent medical impairment while thorax injuries is the most common cause of death after a car crash, but if a person survive they have less long term health consequences. Källa: Gustafsson et al. Traffic Inj Prev 2015, Malm et al. Ann Adv Automot Med. 2008 Marie Hasselberg 38

Additional information ICD-10 chapter XX Where it happened – place of occurrence home, residential institution, school, sports and athletics area, street and highway, industrial and construction area, farm, other specified or unspecified places. Activity at time of injury – activity code sports, leisure activity, working for income, other types of work, vital activities, other specified or unspecified activity Marie Hasselberg 39

• Public health surveys • Household surveys • School surveys Marie Hasselberg 40

Marie Hasselberg 41
 Mechanism")
Important aspects of injury surveillance Intent of injury (e. g. violence or fall) Mechanism of injury (e. g. traffic injury, drowning) Nature of injury (e. g. hip fracture) Activity when injured (e. g. occupational injury) Place of injury (e. g. in the home) Marie Hasselberg 42
- Slides: 42