IMPRS workshop Comparative Genomics 18 th21 st of

- Slides: 46
IMPRS workshop Comparative Genomics 18 th-21 st of February 2013 Lecture 1 Genetic variation
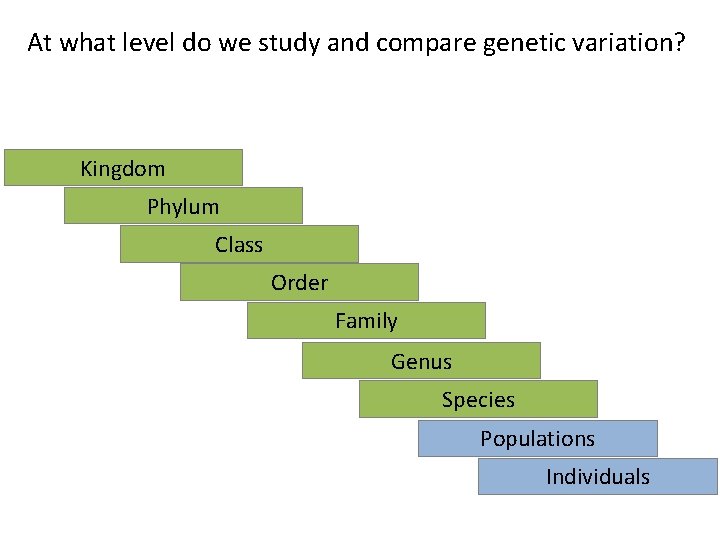
At what level do we study and compare genetic variation? Kingdom Phylum Class Order Family Genus Species Populations Individuals
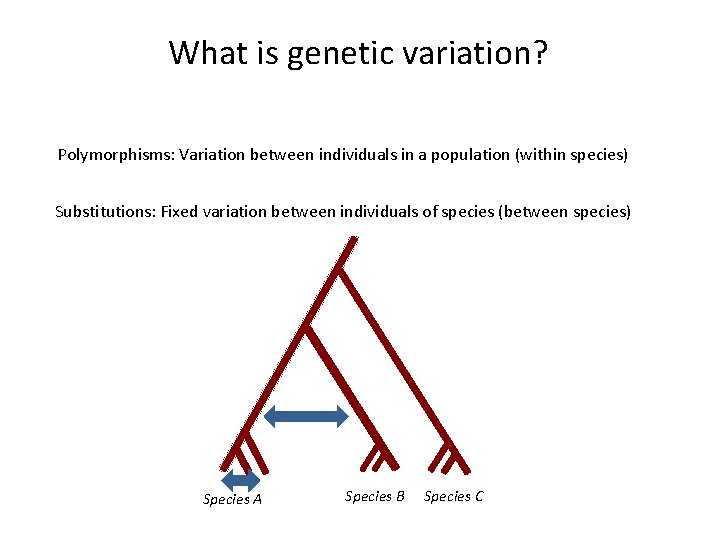
What is genetic variation? Polymorphisms: Variation between individuals in a population (within species) Substitutions: Fixed variation between individuals of species (between species) Species A Species B Species C
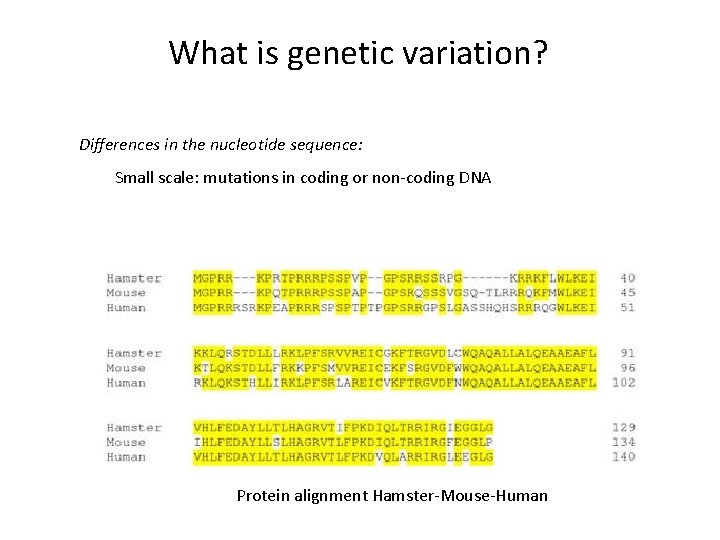
What is genetic variation? Differences in the nucleotide sequence: Small scale: mutations in coding or non-coding DNA Protein alignment Hamster-Mouse-Human
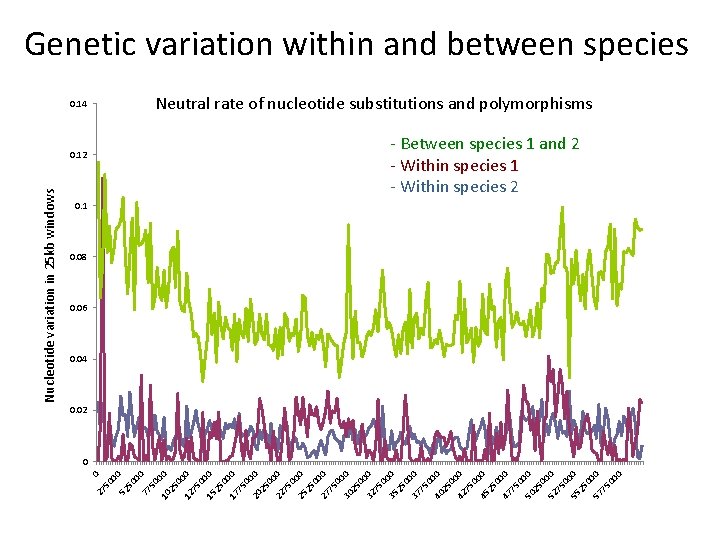
27 0 50 0 52 0 50 0 77 0 50 10 00 25 0 12 00 75 0 15 00 25 0 17 00 75 0 20 00 25 0 22 00 75 0 25 0 27 00 75 0 30 00 25 0 32 00 75 0 35 00 25 0 37 00 75 0 40 00 25 0 42 00 75 0 45 00 25 0 47 00 75 0 50 00 25 0 52 00 75 0 55 00 25 0 57 00 75 00 0 Nucleotide variation in 25 kb windows Genetic variation within and between species 0. 14 0. 12 Neutral rate of nucleotide substitutions and polymorphisms - Between species 1 and 2 - Within species 1 - Within species 2 0. 1 0. 08 0. 06 0. 04 0. 02 0
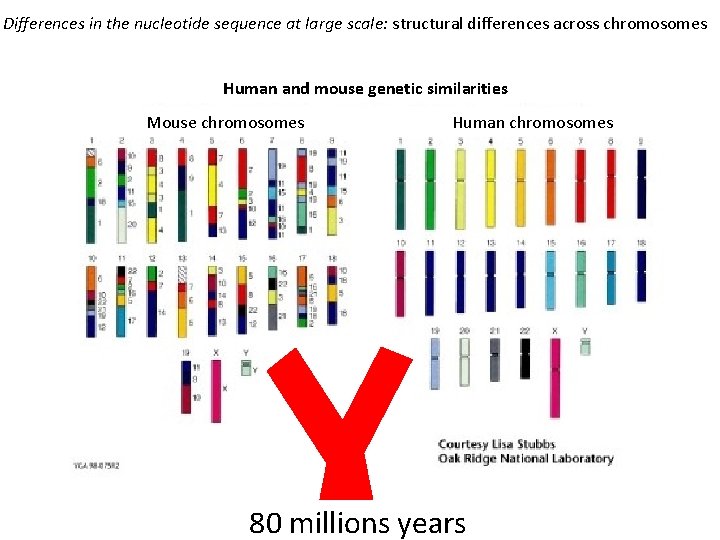
Differences in the nucleotide sequence at large scale: structural differences across chromosomes Human and mouse genetic similarities Mouse chromosomes Human chromosomes 80 millions years
From where does genetic variation come?
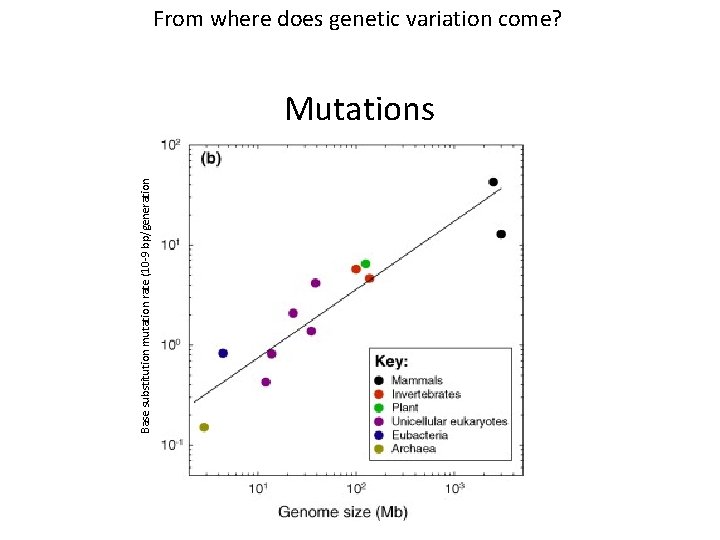
Base substitution mutation rate (10 -9 bp/generation From where does genetic variation come? Mutations
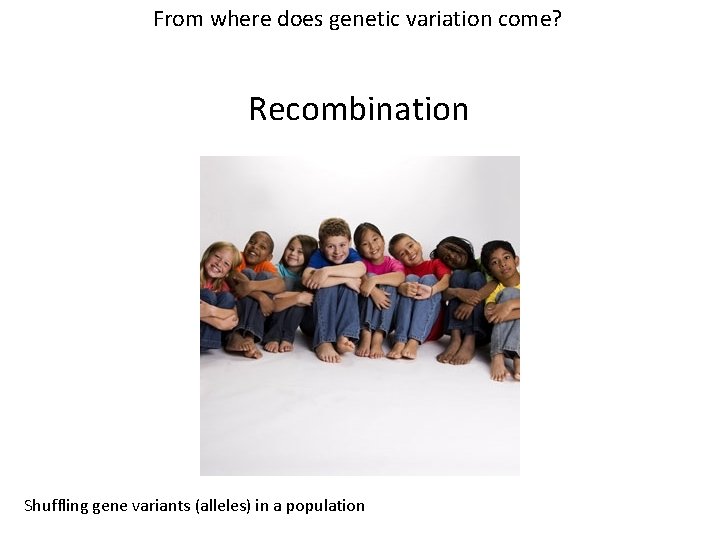
From where does genetic variation come? Recombination Shuffling gene variants (alleles) in a population
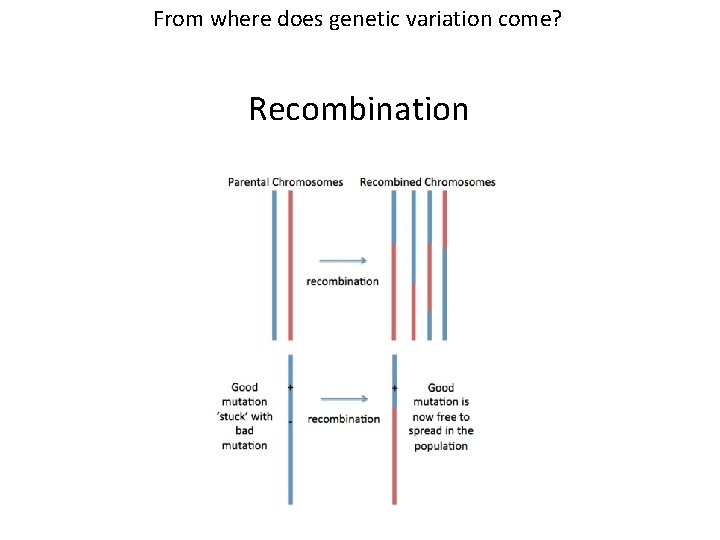
From where does genetic variation come? Recombination
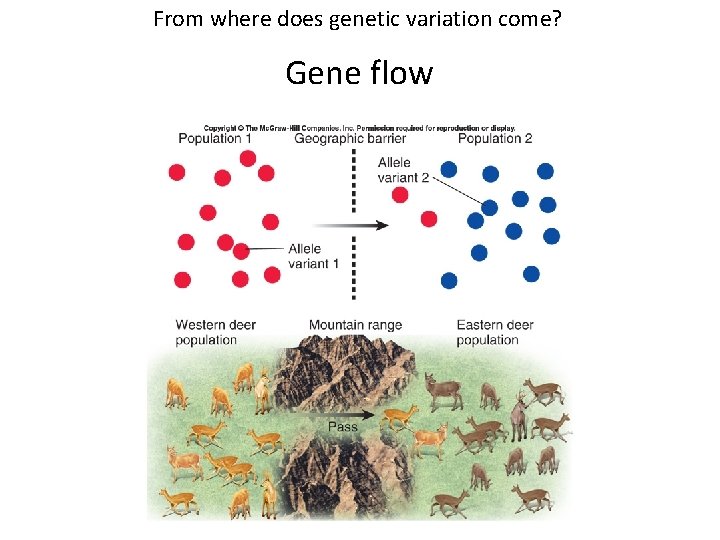
From where does genetic variation come? Gene flow
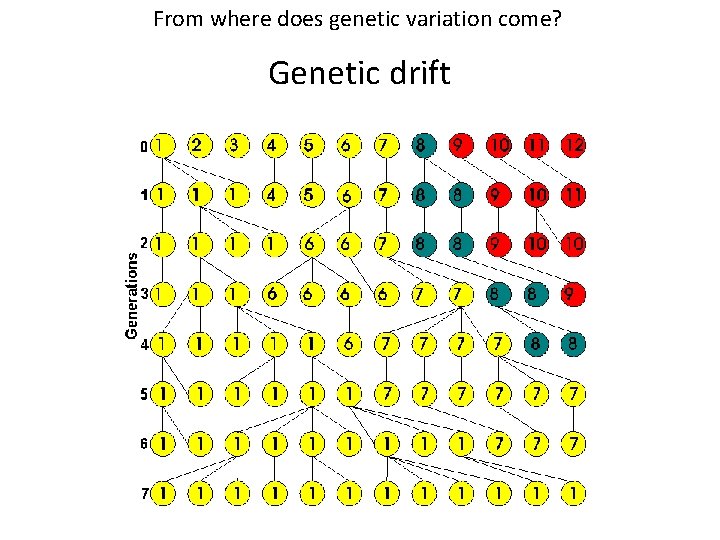
From where does genetic variation come? Genetic drift
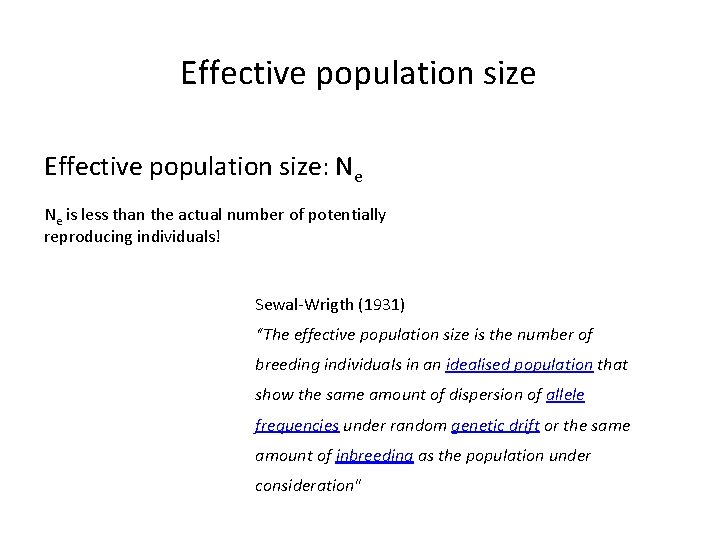
Effective population size: Ne Ne is less than the actual number of potentially reproducing individuals! Sewal-Wrigth (1931) “The effective population size is the number of breeding individuals in an idealised population that show the same amount of dispersion of allele frequencies under random genetic drift or the same amount of inbreeding as the population under consideration"
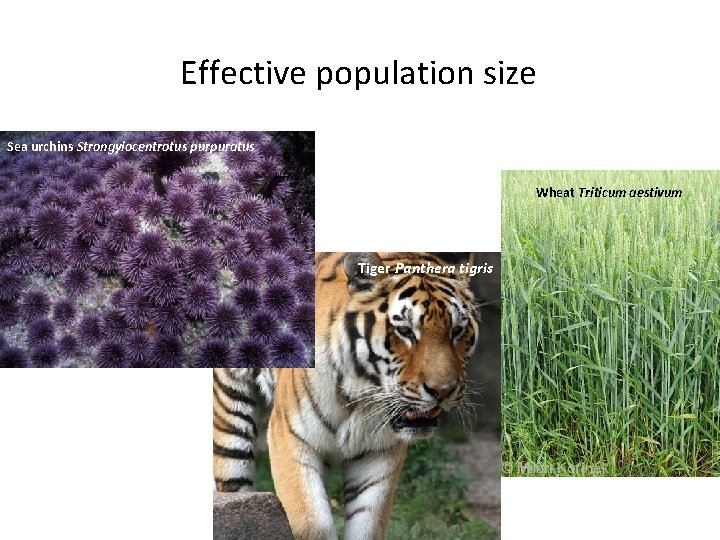
Effective population size Sea urchins Strongylocentrotus purpuratus Wheat Triticum aestivum Tiger Panthera tigris
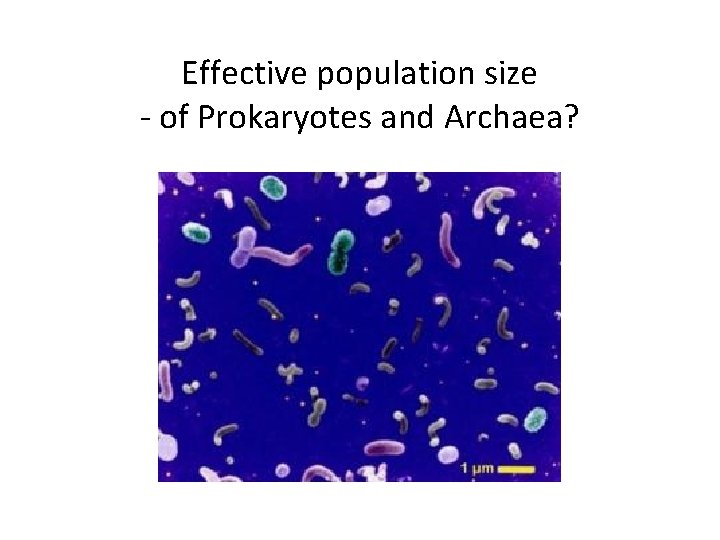
Effective population size - of Prokaryotes and Archaea?
Why does effective population size matters?
From where does genetic variation come? Natural selection
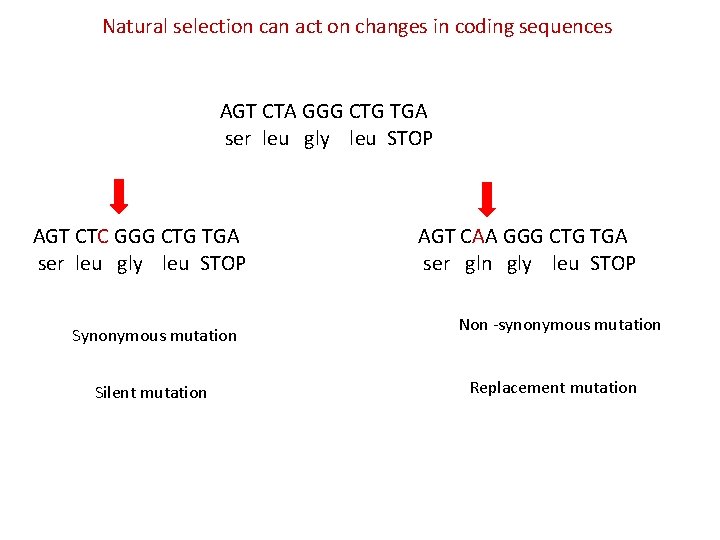
Natural selection can act on changes in coding sequences AGT CTA GGG CTG TGA ser leu gly leu STOP AGT CTC GGG CTG TGA ser leu gly leu STOP Synonymous mutation Silent mutation AGT CAA GGG CTG TGA ser gln gly leu STOP Non -synonymous mutation Replacement mutation
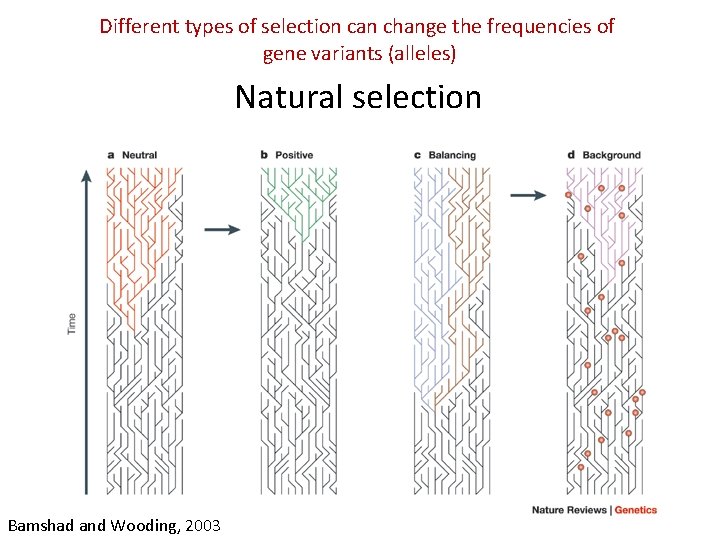
Different types of selection can change the frequencies of gene variants (alleles) Natural selection Bamshad and Wooding, 2003
How can natural selection act on a locus?
Effective population size matters
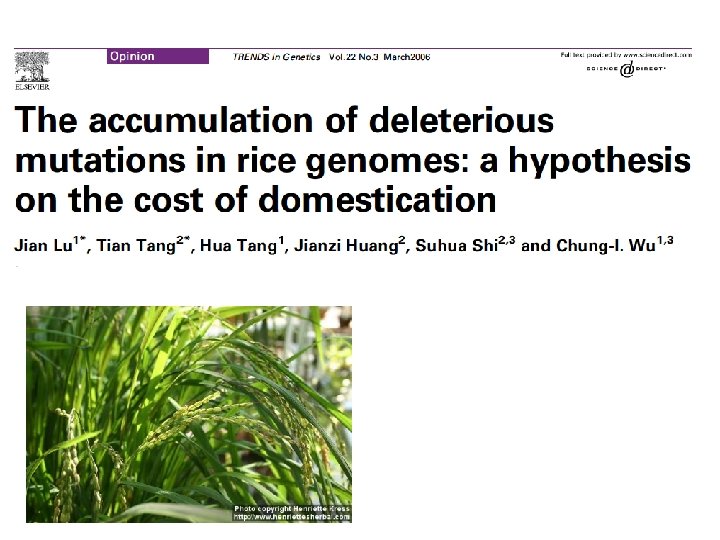
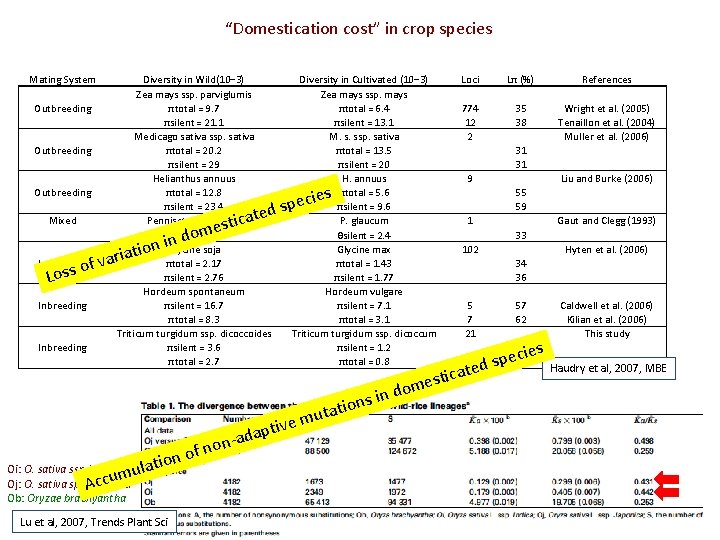
“Domestication cost” in crop species Mating System Outbreeding Mixed Inbreeding Diversity in Wild(10− 3) Zea mays ssp. parviglumis πtotal = 9. 7 πsilent = 21. 1 Medicago sativa ssp. sativa πtotal = 20. 2 πsilent = 29 Helianthus annuus πtotal = 12. 8 πsilent = 23. 4 Pennisetum glaucum θsilent = 3. 6 Glycine soja πtotal = 2. 17 πsilent = 2. 76 Hordeum spontaneum πsilent = 16. 7 πtotal = 8. 3 Triticum turgidum ssp. dicoccoides πsilent = 3. 6 πtotal = 2. 7 a f v o s s Lo s ecie p s d e t stica me do n i n riatio Diversity in Cultivated (10− 3) Zea mays ssp. mays πtotal = 6. 4 πsilent = 13. 1 M. s. ssp. sativa πtotal = 13. 5 πsilent = 20 H. annuus πtotal = 5. 6 πsilent = 9. 6 P. glaucum θsilent = 2. 4 Glycine max πtotal = 1. 43 πsilent = 1. 77 Hordeum vulgare πsilent = 7. 1 πtotal = 3. 1 Triticum turgidum ssp. dicoccum πsilent = 1. 2 πtotal = 0. 8 u on ive m t p a -ad n o n of Oi: O. sativa ssp Indica ulati ccum Oj: O. sativa spp. A Japonica Ob: Oryzae brachyantha Lu et al, 2007, Trends Plant Sci Lπ (%) 774 12 2 35 38 31 31 55 59 33 34 36 57 62 65 70 9 1 102 5 7 21 stica e m o n d s i n o i t ta Loci pec ted s ies References Wright et al. (2005) Tenaillon et al. (2004) Muller et al. (2006) Liu and Burke (2006) Gaut and Clegg (1993) Hyten et al. (2006) Caldwell et al. (2006) Kilian et al. (2006) This study Haudry et al, 2007, MBE
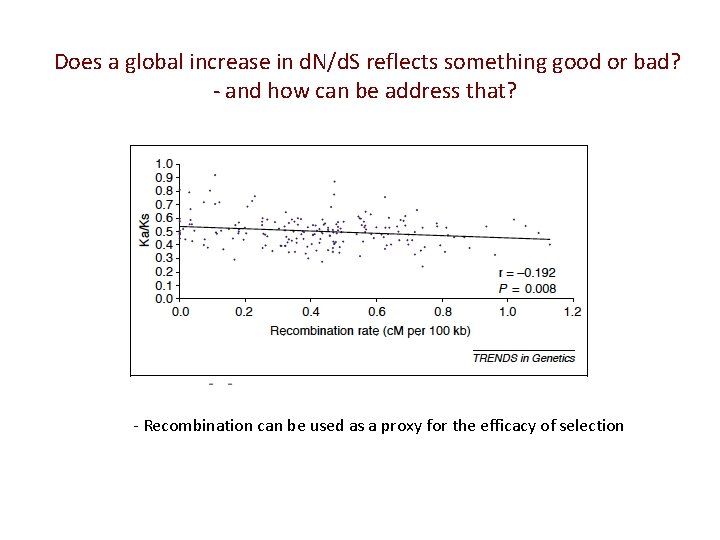
Does a global increase in d. N/d. S reflects something good or bad? - and how can be address that? - Recombination can be used as a proxy for the efficacy of selection
Genetic variation in the genome
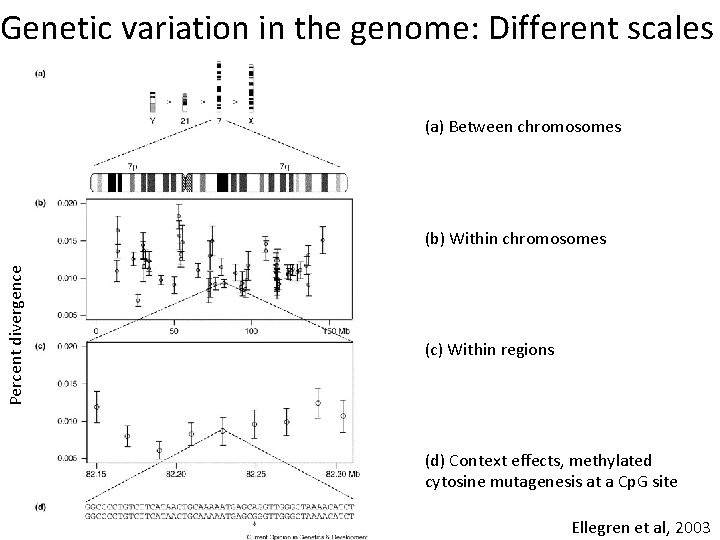
Genetic variation in the genome: Different scales (a) Between chromosomes Percent divergence (b) Within chromosomes (c) Within regions (d) Context effects, methylated cytosine mutagenesis at a Cp. G site Ellegren et al, 2003
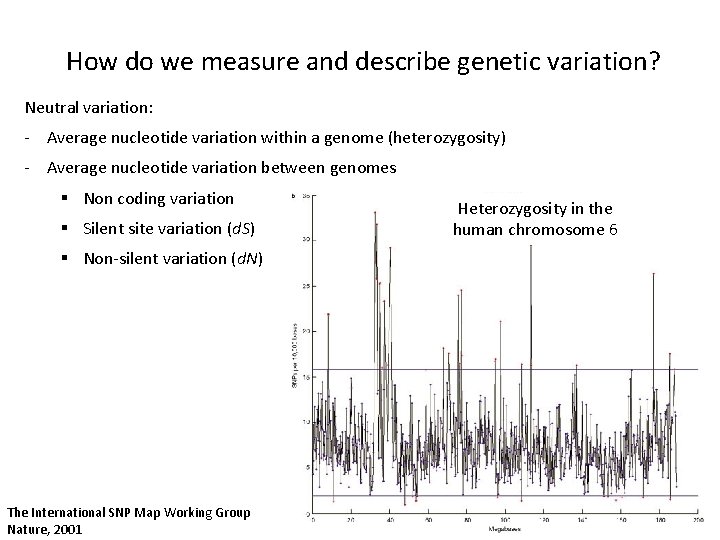
How do we measure and describe genetic variation? Neutral variation: - Average nucleotide variation within a genome (heterozygosity) - Average nucleotide variation between genomes § Non coding variation § Silent site variation (d. S) § Non-silent variation (d. N) The International SNP Map Working Group Nature, 2001 Heterozygosity in the human chromosome 6
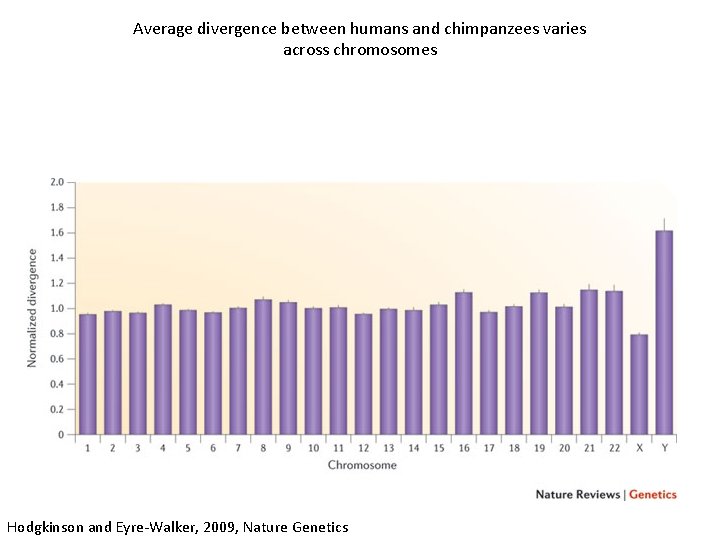
Average divergence between humans and chimpanzees varies across chromosomes Hodgkinson and Eyre-Walker, 2009, Nature Genetics
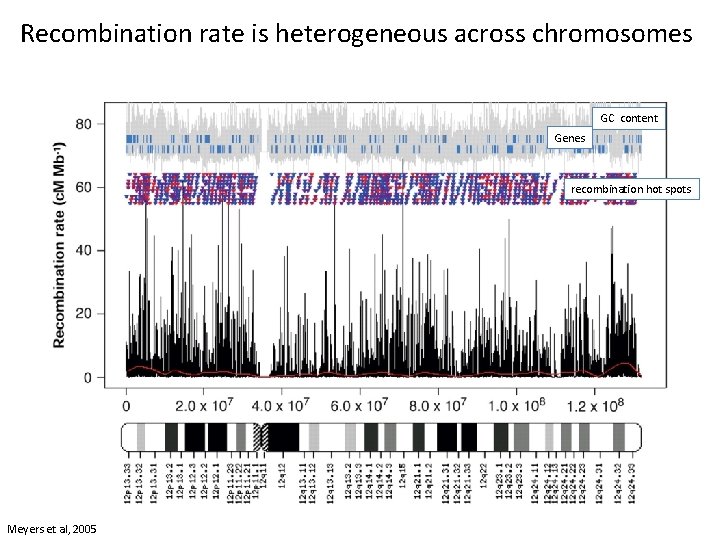
Recombination rate is heterogeneous across chromosomes GC content Genes recombination hot spots Meyers et al, 2005
Assessing signatures of selection across genome sequences Population data: Measures of SNPs across a genome alignment Population data and interspecific comparisons d. N/d. S ratios (non-synonymous to synonymous variation) (Wednesday)
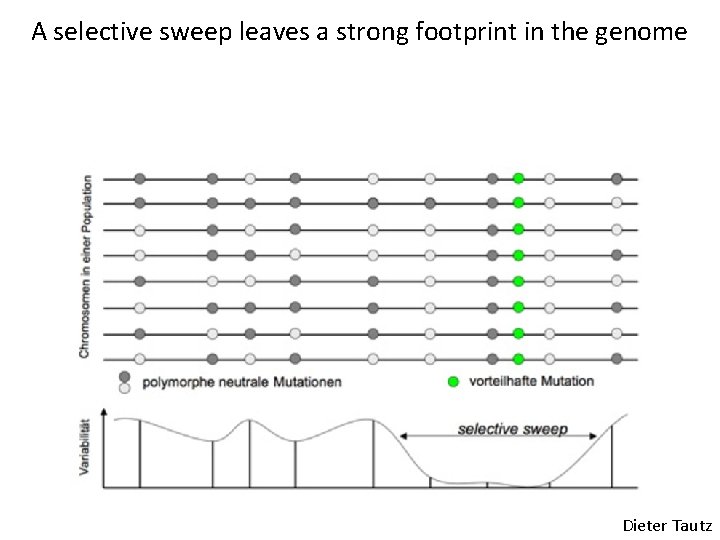
A selective sweep leaves a strong footprint in the genome Dieter Tautz
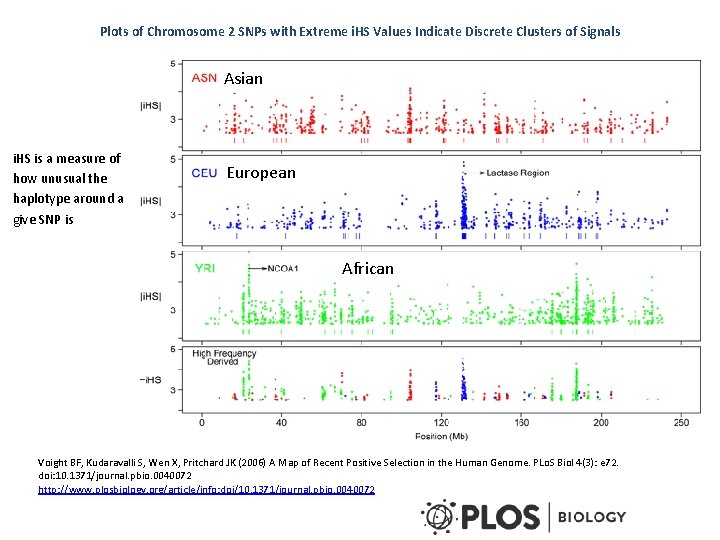
Plots of Chromosome 2 SNPs with Extreme i. HS Values Indicate Discrete Clusters of Signals Asian i. HS is a measure of how unusual the haplotype around a give SNP is European African Voight BF, Kudaravalli S, Wen X, Pritchard JK (2006) A Map of Recent Positive Selection in the Human Genome. PLo. S Biol 4(3): e 72. doi: 10. 1371/journal. pbio. 0040072 http: //www. plosbiology. org/article/info: doi/10. 1371/journal. pbio. 0040072
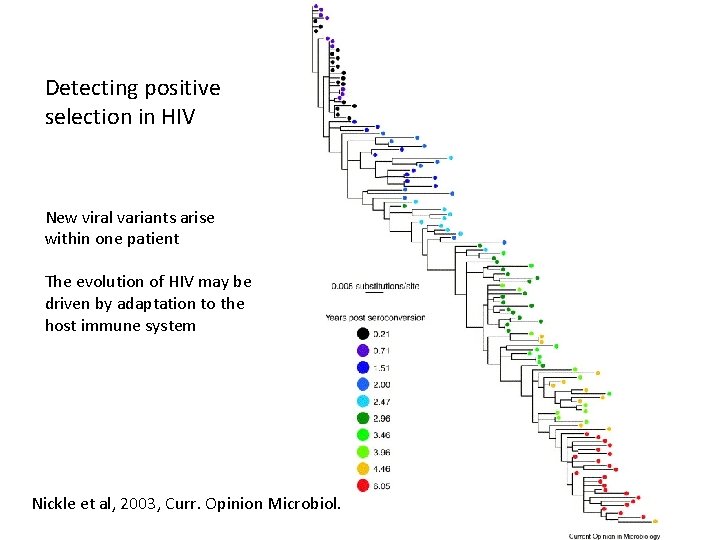
Detecting positive selection in HIV New viral variants arise within one patient The evolution of HIV may be driven by adaptation to the host immune system Nickle et al, 2003, Curr. Opinion Microbiol.
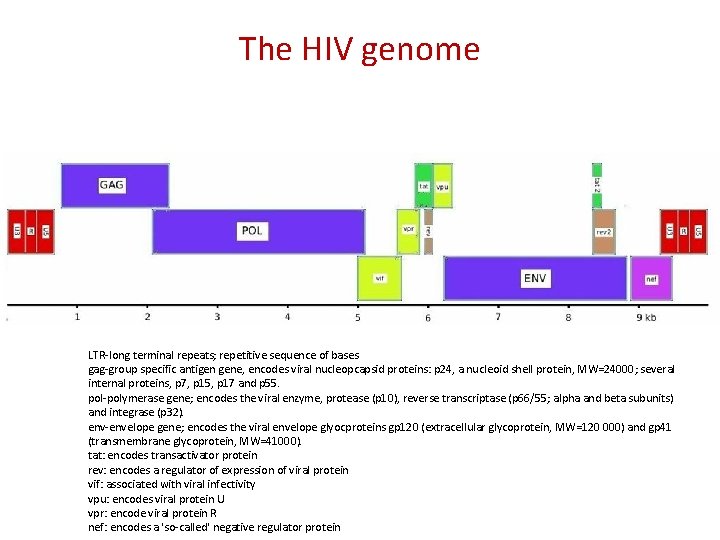
The HIV genome LTR-long terminal repeats; repetitive sequence of bases gag-group specific antigen gene, encodes viral nucleopcapsid proteins: p 24, a nucleoid shell protein, MW=24000; several internal proteins, p 7, p 15, p 17 and p 55. pol-polymerase gene; encodes the viral enzyme, protease (p 10), reverse transcriptase (p 66/55; alpha and beta subunits) and integrase (p 32). env-envelope gene; encodes the viral envelope glyocproteins gp 120 (extracellular glycoprotein, MW=120 000) and gp 41 (transmembrane glycoprotein, MW=41000). tat: encodes transactivator protein rev: encodes a regulator of expression of viral protein vif: associated with viral infectivity vpu: encodes viral protein U vpr: encode viral protein R nef: encodes a 'so-called' negative regulator protein
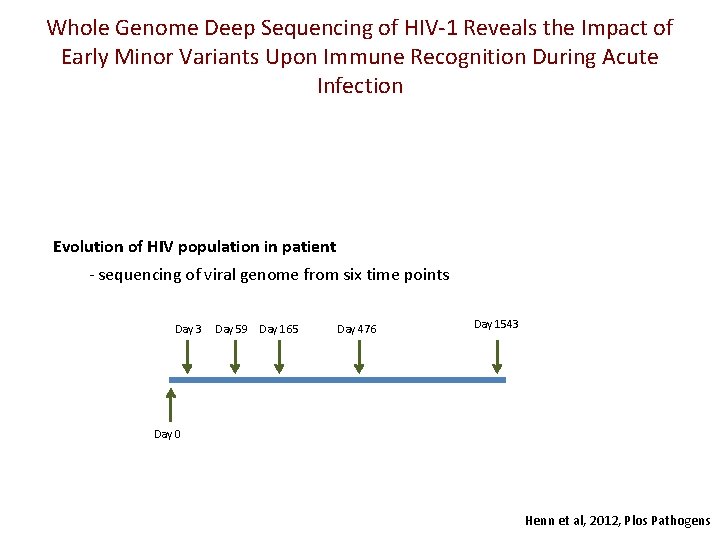
Whole Genome Deep Sequencing of HIV-1 Reveals the Impact of Early Minor Variants Upon Immune Recognition During Acute Infection Evolution of HIV population in patient - sequencing of viral genome from six time points Day 3 Day 59 Day 165 Day 476 Day 1543 Day 0 Henn et al, 2012, Plos Pathogens
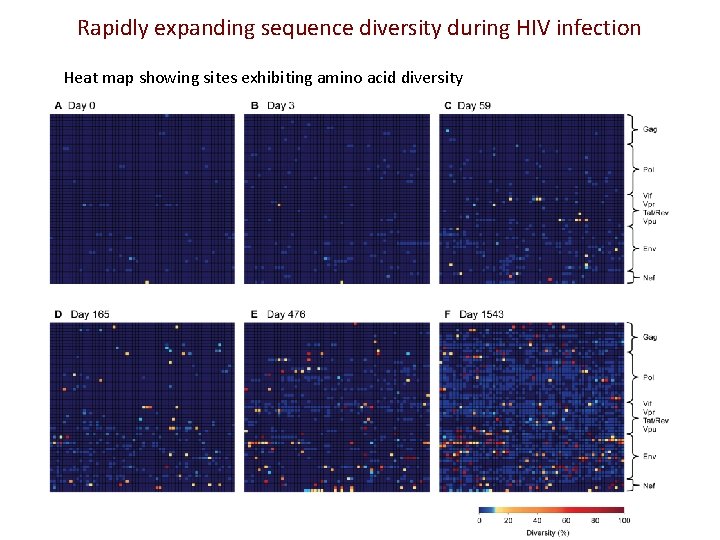
Rapidly expanding sequence diversity during HIV infection Heat map showing sites exhibiting amino acid diversity
Genome complexity
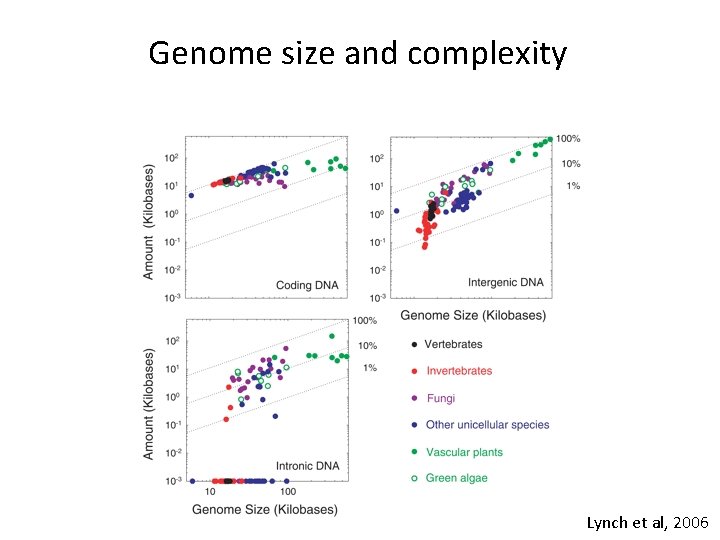
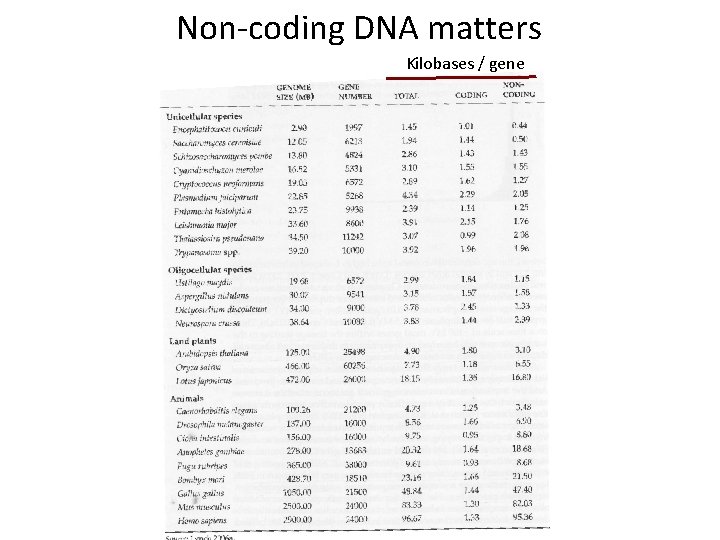
Genome size and complexity Lynch et al, 2006
Non-coding DNA matters Kilobases / gene
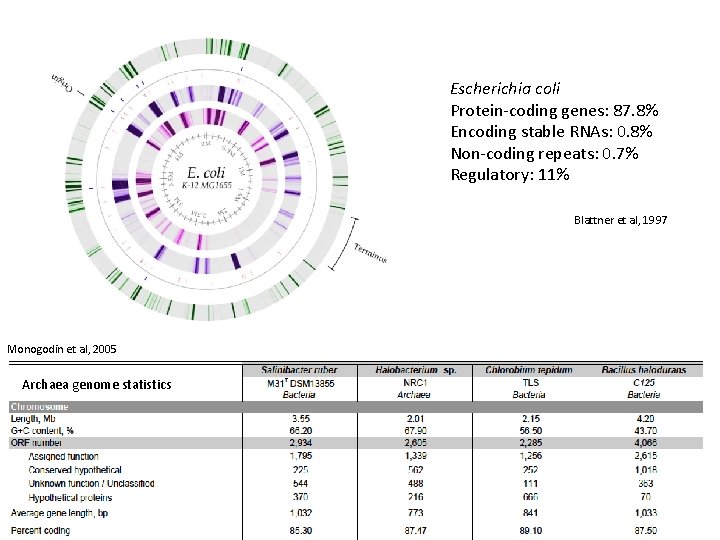
Escherichia coli Protein-coding genes: 87. 8% Encoding stable RNAs: 0. 8% Non-coding repeats: 0. 7% Regulatory: 11% Blattner et al, 1997 Monogodin et al, 2005 Archaea genome statistics
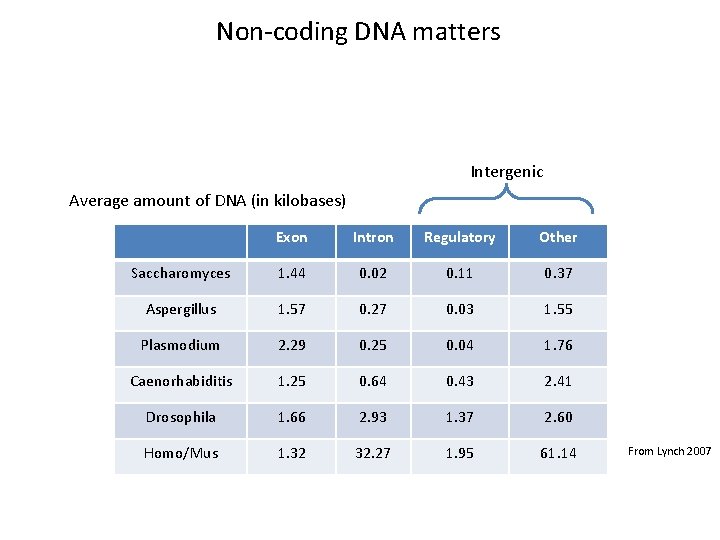
Non-coding DNA matters Intergenic Average amount of DNA (in kilobases) Exon Intron Regulatory Other Saccharomyces 1. 44 0. 02 0. 11 0. 37 Aspergillus 1. 57 0. 27 0. 03 1. 55 Plasmodium 2. 29 0. 25 0. 04 1. 76 Caenorhabiditis 1. 25 0. 64 0. 43 2. 41 Drosophila 1. 66 2. 93 1. 37 2. 60 Homo/Mus 1. 32 32. 27 1. 95 61. 14 From Lynch 2007
Synteny
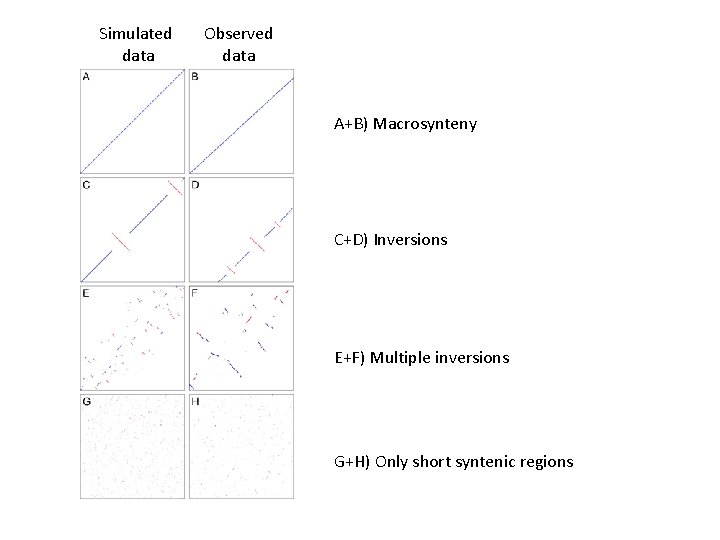
Simulated data Observed data A+B) Macrosynteny C+D) Inversions E+F) Multiple inversions G+H) Only short syntenic regions
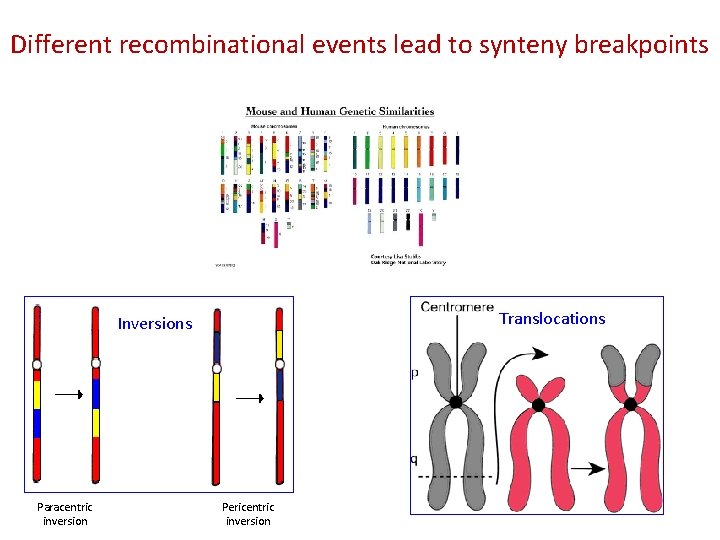
Different recombinational events lead to synteny breakpoints Translocations Inversions Paracentric inversion Pericentric inversion
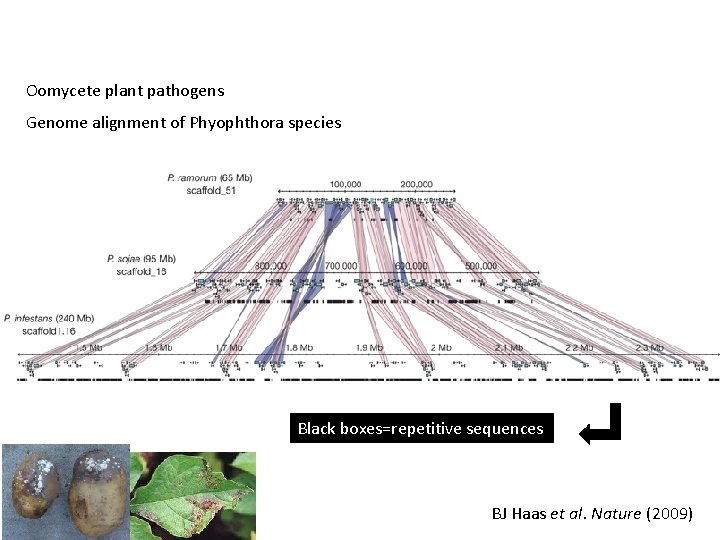
Oomycete plant pathogens Genome alignment of Phyophthora species Black boxes=repetitive sequences BJ Haas et al. Nature (2009)