help yourself to a cup of coffee EMC










- Slides: 44
…help yourself to a cup of coffee!
EMC Technical Assistance Project Andrew Pritchard Director of Policy & Infrastructure
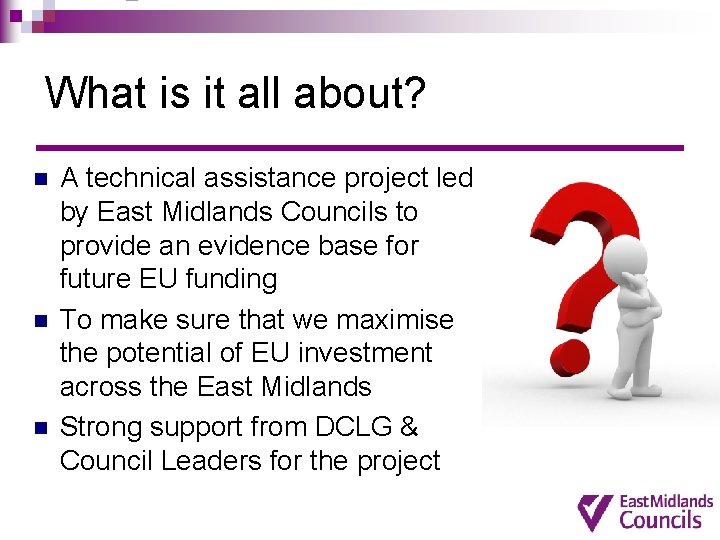
What is it all about? n n n A technical assistance project led by East Midlands Councils to provide an evidence base for future EU funding To make sure that we maximise the potential of EU investment across the East Midlands Strong support from DCLG & Council Leaders for the project
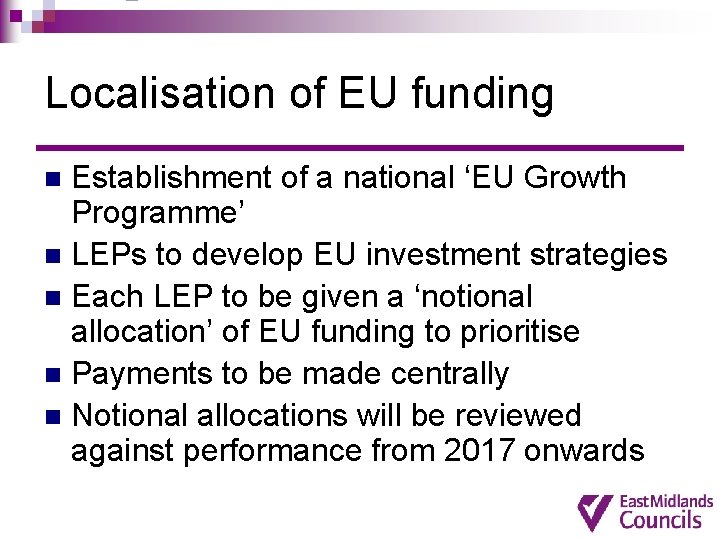
Localisation of EU funding Establishment of a national ‘EU Growth Programme’ n LEPs to develop EU investment strategies n Each LEP to be given a ‘notional allocation’ of EU funding to prioritise n Payments to be made centrally n Notional allocations will be reviewed against performance from 2017 onwards n
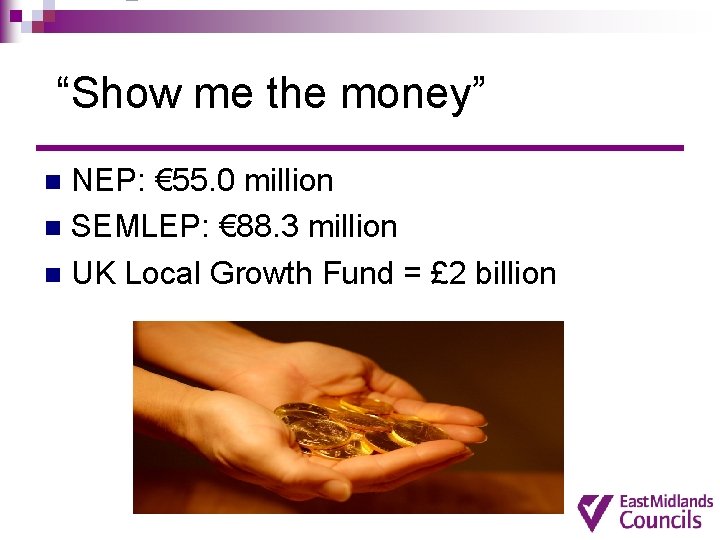
“Show me the money” NEP: € 55. 0 million n SEMLEP: € 88. 3 million n UK Local Growth Fund = £ 2 billion n
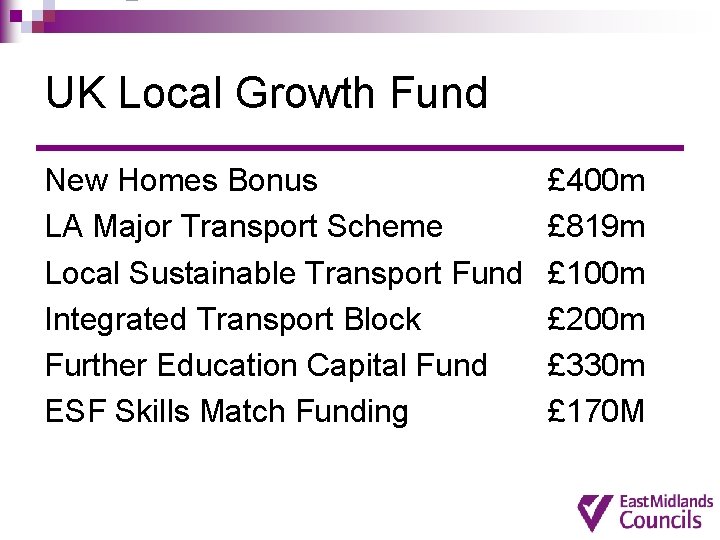
UK Local Growth Fund New Homes Bonus LA Major Transport Scheme Local Sustainable Transport Fund Integrated Transport Block Further Education Capital Fund ESF Skills Match Funding £ 400 m £ 819 m £ 100 m £ 200 m £ 330 m £ 170 M
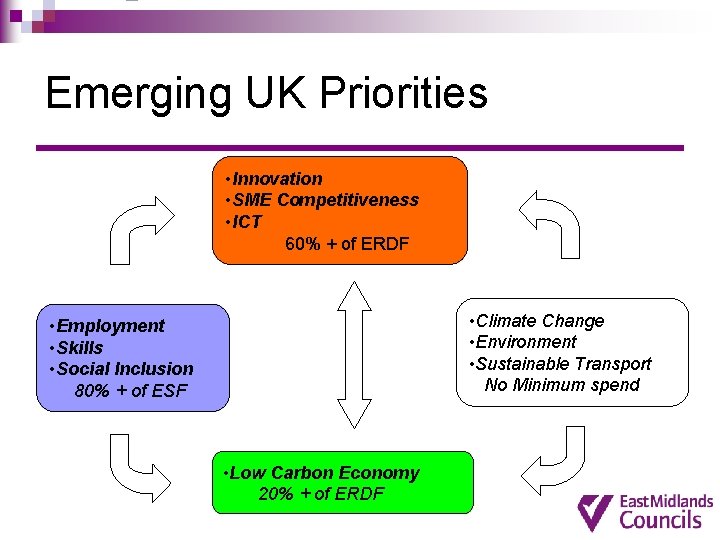
Emerging UK Priorities • Innovation • SME Competitiveness • ICT 60% + of ERDF • Climate Change • Environment • Sustainable Transport No Minimum spend • Employment • Skills • Social Inclusion 80% + of ESF • Low Carbon Economy 20% + of ERDF
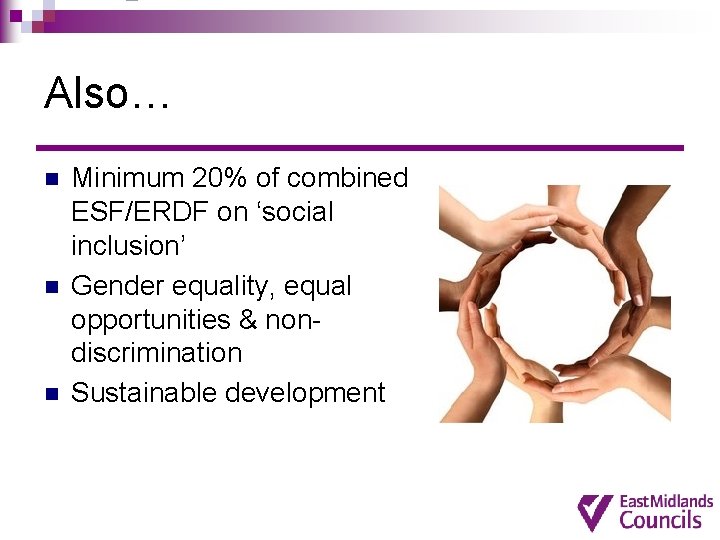
Also… n n n Minimum 20% of combined ESF/ERDF on ‘social inclusion’ Gender equality, equal opportunities & nondiscrimination Sustainable development
Programme Timescales n September 2013: Draft LEP EU Investment Strategies n January 2014: finalise strategies n March 2014: new EU Programme starts n 2017 – first review of notional allocations
Current Experience n n n Spend under the current ERDF Programme has been slow Too many small projects difficult to see a strategic impact Original operational programme did not fully meet local needs - e. g. Broadband
Future Challenges n n n 1 region replaced by 7 LEPs – 4 overlapping Pressure for early spend on projects that will deliver clear outcomes LEP notional allocations to be reviewed in 2017 under-performance could be penalised
Threats v Opportunities
What are we going to do? Facilitate a series of consultation events n Develop an evidence base (or ‘socioeconomic framework’) to inform both the UK Growth Programme and individual LEP Strategies – working with NTU. n Highlight potential areas of collaborative activity that can maximise strategic impact and reduce ‘transaction costs’ n
Events Diary 1 st July: Greater Lincolnshire LEP n 5 th July: Leicester & Leicestershire LEP n 9 th July: Competitiveness Round Table n 16 th July: NEP/SEMLEP n 22 nd July: D 2 N 2 n 25 th July: Green Economy Round Table n
Project Timescales n End of July 2013: Interim Report n September 2013: draft Framework n December 2013 – final Framework n January - June 2014 Awareness raising
Key Outcomes “It’s the economy, stupid” More Jobs n Less Worklessness n
Your mission today… n n n To think about how best EU funding could be used across Northamptonshire To highlight areas or issues where wider collaboration might be helpful. To ask if you do not understand.
East Midlands PA 3 Project Socio-Economic Evidence – the future of European Funds in Northamptonshire 16 th July, 2013 Chris Lawton Nottingham Business School
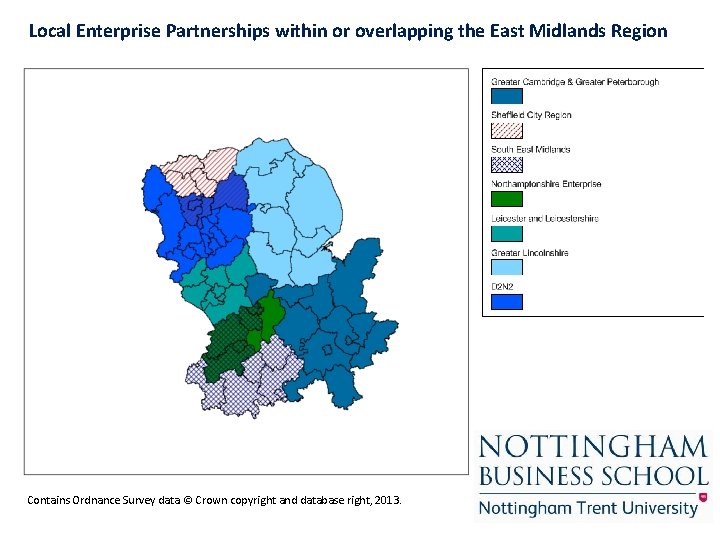
Project Rationale and Objectives • The project aims to provide socio-economic evidence to help identify synergies, linkages and common challenges across LEPs within or overlapping the East Midlands • To identify opportunities for collaboration across themes identified in the ‘Europe 2020’ strategy • The UK Government would: “like to see Local Enterprise Partnerships working with each other to deliver a bigger impact… and achieve economies of scale wherever possible” Source: HM Government, April 2013. ‘Technical Annex: Preliminary guidance to Local Enterprise Partnerships on development of Structural & Investment Fund Strategies. ’ paragraph 2. 8, p. 4.
Local Enterprise Partnerships within or overlapping the East Midlands Region Contains Ordnance Survey data © Crown copyright and database right, 2013.
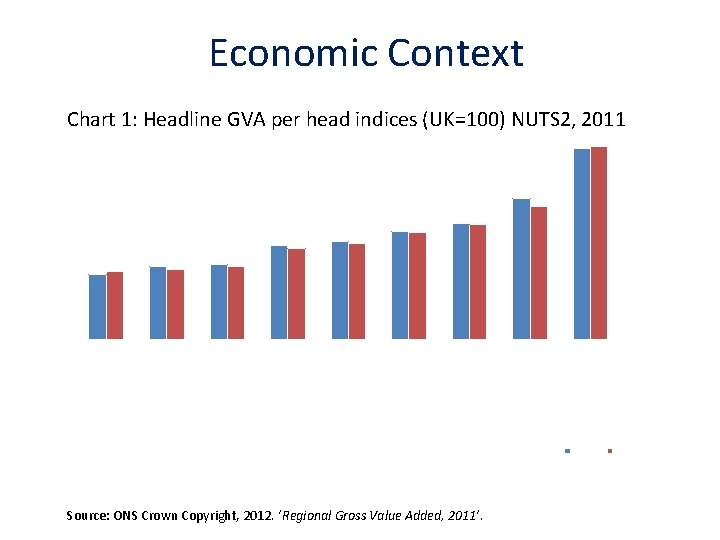
ks Be r re , hi Source: ONS Crown Copyright, 2012. ‘Regional Gross Value Added, 2011’. xf ire sh or d ire sh rd re hi on s er tfo O H d an an d pt am th lia ng s nd id la ire sh t. A Ea s t. M Ea s ha m ng ire sh ol n ire sh rk Yo nc Li ot ti or N N ire sh am gh in ck Bu an d d an n er ut h So th or N rd sh ire df o nd ut la Be ire , R d an sh ire by er ire sh D Yo rk sh er st ce Le i st Ea ns h ol nc Li Economic Context 140 Chart 1: Headline GVA per head indices (UK=100) NUTS 2, 2011 130 120 110 100 90 80 70 60 50 40 2008 2011
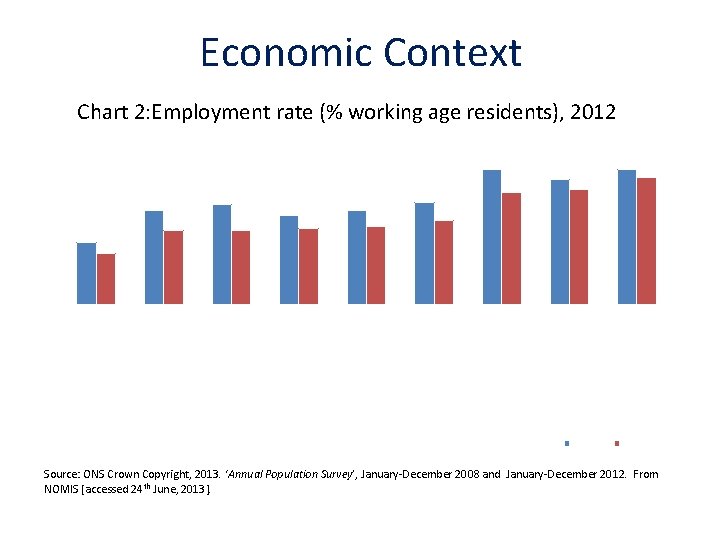
Economic Context Chart 2: Employment rate (% working age residents), 2012 80 78 76 74 72 70 68 66 64 on am pt or th N G re So ut h at er Ea Pe st te M rb or sh ou ire gh s id la nd nd s id la 2008 2012 G re at er C am br id Le ge ic & es te M te r es ic Le ra nd er re at G Ea st sh ire K ns ol nc Li C ld fie ef Sh U hi re 2 2 N D ity R eg io n 62 Source: ONS Crown Copyright, 2013. ‘Annual Population Survey’, January-December 2008 and January-December 2012. From NOMIS [accessed 24 th June, 2013].
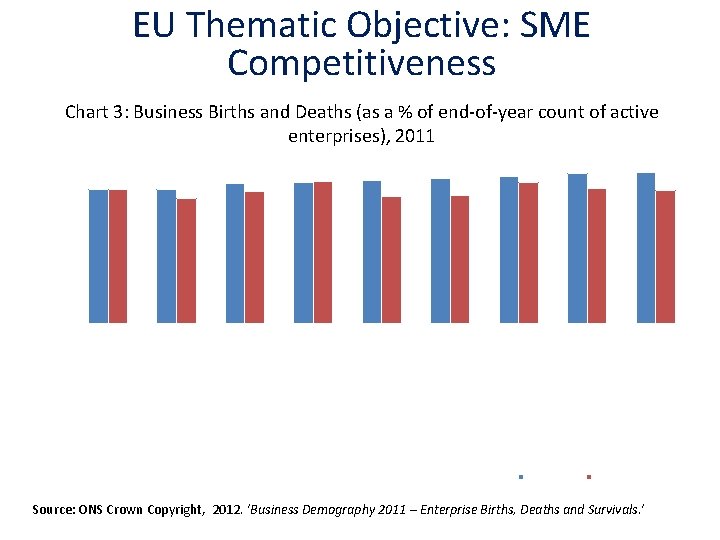
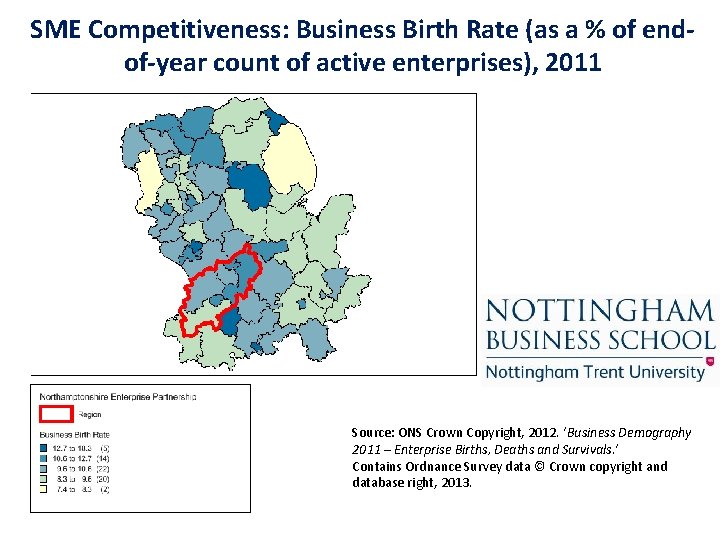
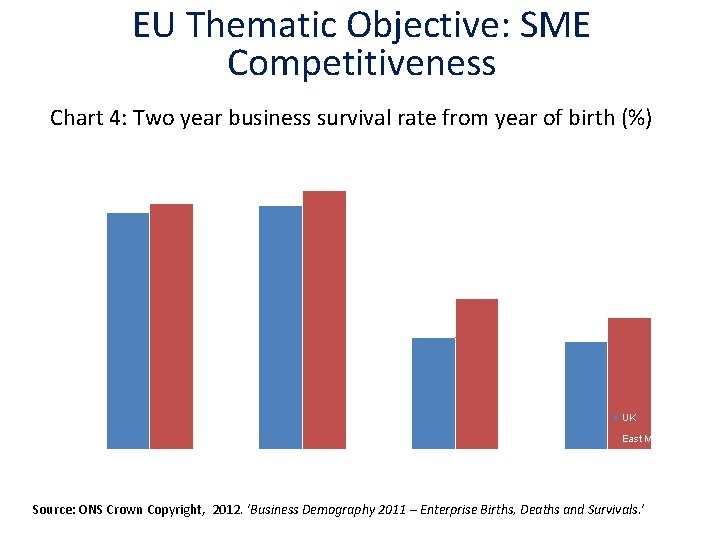
EU Thematic Objective: SME Competitiveness • The SME environment remains difficult, but some signs of improvement: – Business death rates have fallen since 2009 and business birth rates have increased – Survival rates for new businesses have significantly decreased since pre-recession – Small businesses (<50 employees) have been more likely to retain staff but cut/freeze wages and investment, with resulting lost productivity – Large businesses (>250) more likely to cut staff whilst maintaining investment and productivity levels • Lenders report that demand for credit remains low • Despite some structural improvements, firms seeking credit continue to report difficulties in the supply of finance • Exports have been growing moderately in recent months
EU Thematic Objective: SME Competitiveness Chart 3: Business Births and Deaths (as a % of end-of-year count of active enterprises), 2011 12 10 8 6 4 2 G K U re rs te es Le ic Li er & er Le ic es t re at G h ut So hi ire ns h nc M Ea st En ire sh on am pt th N or ol id la rp te R ity C ld fie ef Sh nd s e ris n eg io nd s M id la st Ea re at er C am br id ge & G re at e r. P et er bo D 2 N ro ug 2 h 0 Birth Rate Death Rate Source: ONS Crown Copyright, 2012. ‘Business Demography 2011 – Enterprise Births, Deaths and Survivals. ’
SME Competitiveness: Business Birth Rate (as a % of endof-year count of active enterprises), 2011 Source: ONS Crown Copyright, 2012. ‘Business Demography 2011 – Enterprise Births, Deaths and Survivals. ’ Contains Ordnance Survey data © Crown copyright and database right, 2013.
EU Thematic Objective: SME Competitiveness Chart 4: Two year business survival rate from year of birth (%) 84 82 80 78 76 74 72 70 UK East Midlands 68 2006 2007 2008 2009 Source: ONS Crown Copyright, 2012. ‘Business Demography 2011 – Enterprise Births, Deaths and Survivals. ’
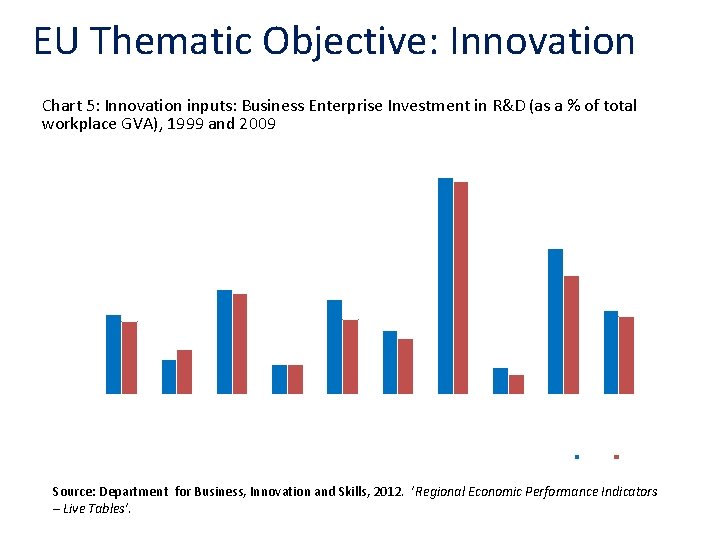
EU Thematic Objective: Innovation Chart 5: Innovation inputs: Business Enterprise Investment in R&D (as a % of total workplace GVA), 1999 and 2009 4. 0 3. 5 3. 0 2. 5 2. 0 1. 5 1. 0 0. 5 0. 0 United Kingdom North East North West Yorkshire and the Humber East Midlands West Midlands East of England London South East South West 1999 2009 Source: Department for Business, Innovation and Skills, 2012. ‘Regional Economic Performance Indicators – Live Tables’.
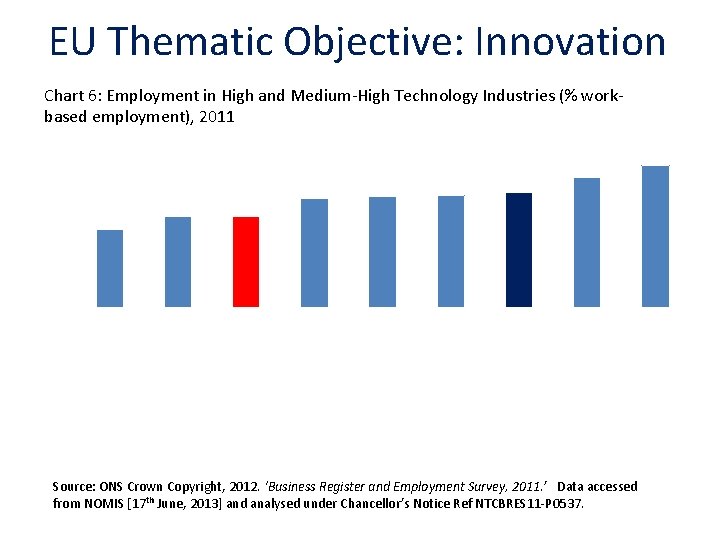
EU Thematic Objective: Innovation Chart 6: Employment in High and Medium-High Technology Industries (% workbased employment), 2011 6 5 4 3 2 1 gh te rb or D ou 2 N 2 nd s M id la at er Ea Pe st te r re G re at er C am br id Le ge ic & es G te So ut h ra nd Le Ea ic st es M on am pt or th N sh ire s id la nd ire sh ita in Br at re G er re at G Sh ef fie ld Li C nc ity ol R eg ns h io ire n 0 Source: ONS Crown Copyright, 2012. ‘Business Register and Employment Survey, 2011. ’ Data accessed from NOMIS [17 th June, 2013] and analysed under Chancellor’s Notice Ref NTCBRES 11 -P 0537.
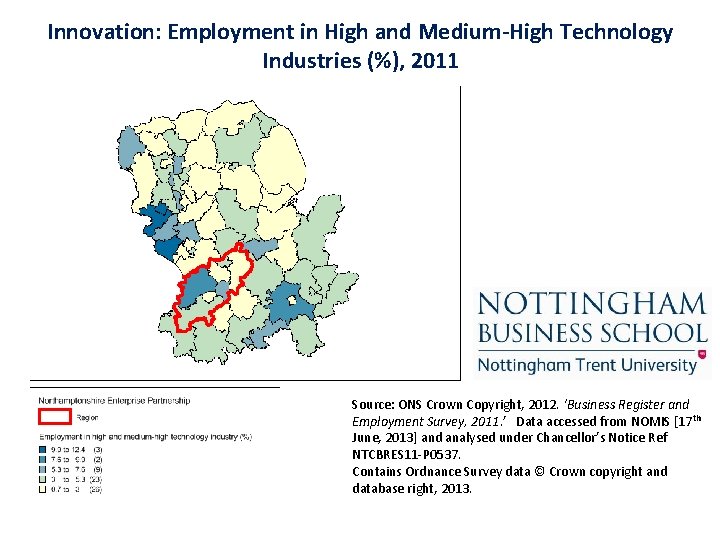
Innovation: Employment in High and Medium-High Technology Industries (%), 2011 Source: ONS Crown Copyright, 2012. ‘Business Register and Employment Survey, 2011. ’ Data accessed from NOMIS [17 th June, 2013] and analysed under Chancellor’s Notice Ref NTCBRES 11 -P 0537. Contains Ordnance Survey data © Crown copyright and database right, 2013.
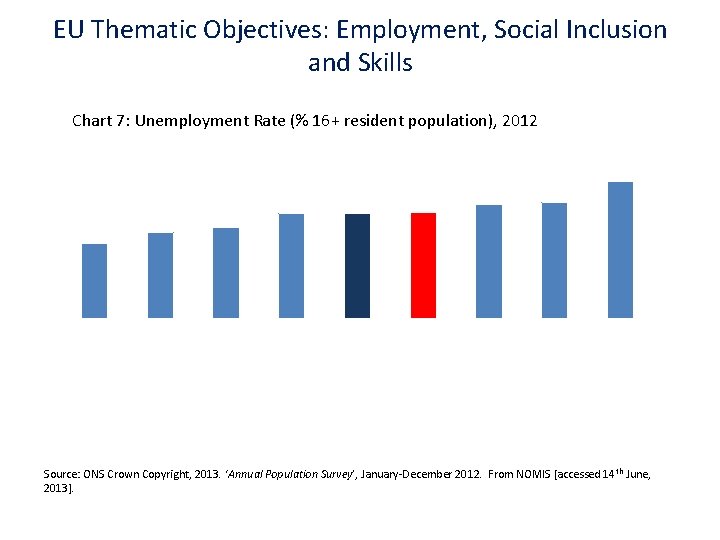
EU Thematic Objectives: Employment, Social Inclusion and Skills Chart 7: Unemployment Rate (% 16+ resident population), 2012 12 10 8 6 4 2 n 2 eg io 2 N R el ef fi Sh G re at er d C Li nc ity ol n D ire sh do m ng Ki U ni te d t. M es ic Le d an er ce st Le i Ea s te rs id la nd s hi re s id la t. M Ea s th So u G re at er C am br id ge & G re at N er or th Pe am te pt rb on sh or ou g nd h ire 0 Source: ONS Crown Copyright, 2013. ‘Annual Population Survey’, January-December 2012. From NOMIS [accessed 14 th June, 2013].
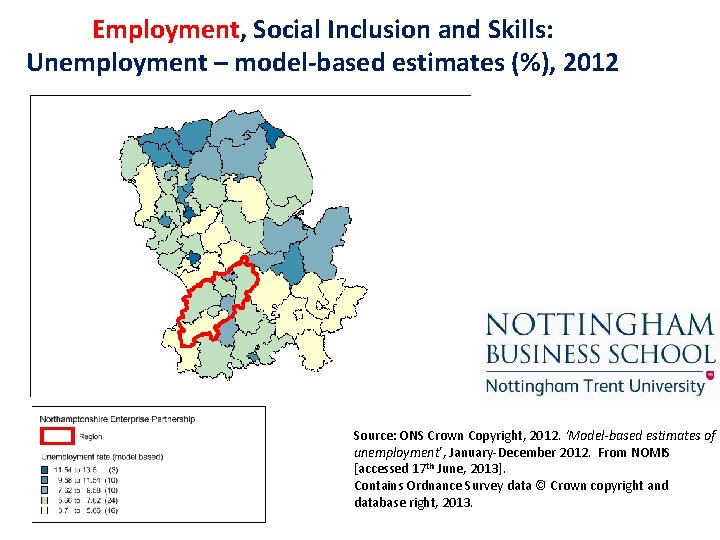
Employment, Social Inclusion and Skills: Unemployment – model-based estimates (%), 2012 Source: ONS Crown Copyright, 2012. ‘Model-based estimates of unemployment’, January-December 2012. From NOMIS [accessed 17 th June, 2013]. Contains Ordnance Survey data © Crown copyright and database right, 2013.
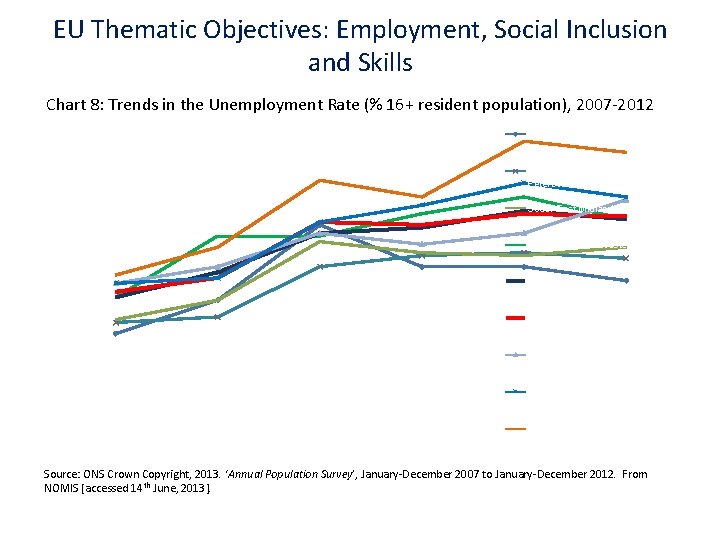
EU Thematic Objectives: Employment, Social Inclusion and Skills Chart 8: Trends in the Unemployment Rate (% 16+ resident population), 2007 -2012 Northamptonshire 10 Greater Cambridge & Greater Peterborough South East Midlands 8 Leicester and Leicestershire 6 East Midlands United Kingdom 4 Greater Lincolnshire 2 D 2 N 2 Sheffield City Region 0 2007 2008 2009 2010 2011 2012 Source: ONS Crown Copyright, 2013. ‘Annual Population Survey’, January-December 2007 to January-December 2012. From NOMIS [accessed 14 th June, 2013].
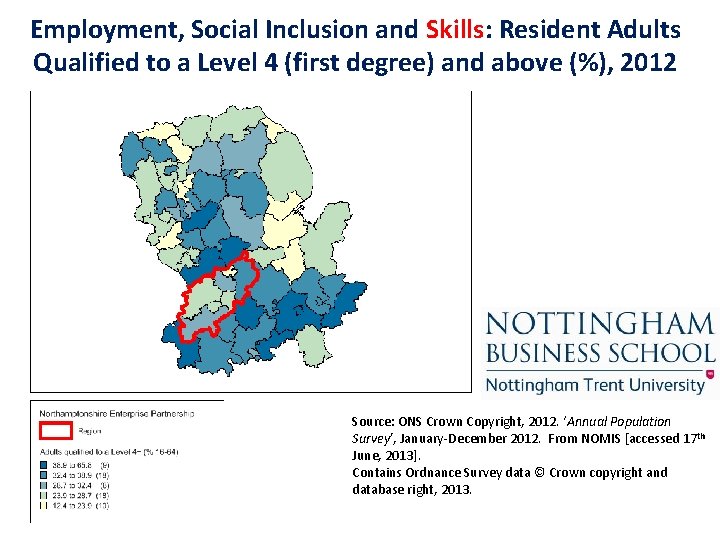
Employment, Social Inclusion and Skills: Resident Adults Qualified to a Level 4 (first degree) and above (%), 2012 Source: ONS Crown Copyright, 2012. ‘Annual Population Survey’, January-December 2012. From NOMIS [accessed 17 th June, 2013]. Contains Ordnance Survey data © Crown copyright and database right, 2013.
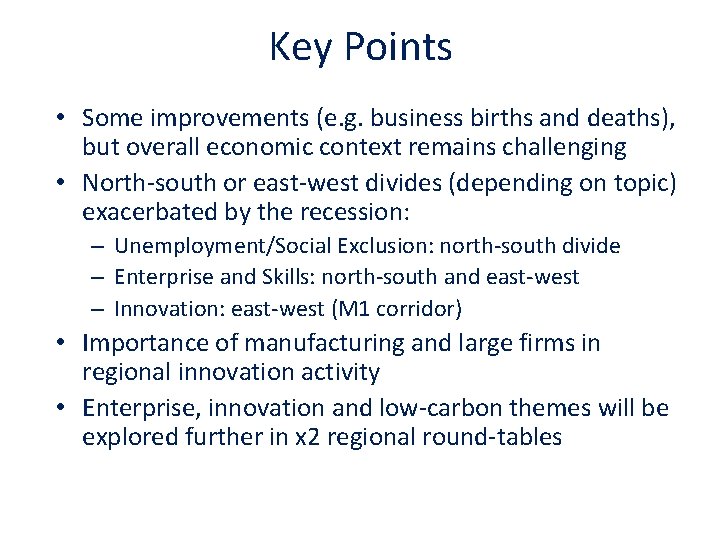
Key Points • Some improvements (e. g. business births and deaths), but overall economic context remains challenging • North-south or east-west divides (depending on topic) exacerbated by the recession: – Unemployment/Social Exclusion: north-south divide – Enterprise and Skills: north-south and east-west – Innovation: east-west (M 1 corridor) • Importance of manufacturing and large firms in regional innovation activity • Enterprise, innovation and low-carbon themes will be explored further in x 2 regional round-tables
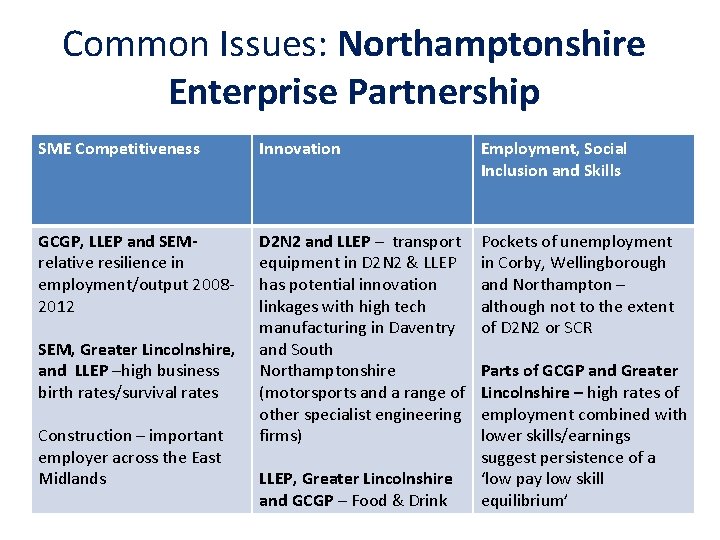
Common Issues: Northamptonshire Enterprise Partnership SME Competitiveness Innovation Employment, Social Inclusion and Skills GCGP, LLEP and SEMrelative resilience in employment/output 20082012 D 2 N 2 and LLEP – transport equipment in D 2 N 2 & LLEP has potential innovation linkages with high tech manufacturing in Daventry and South Northamptonshire (motorsports and a range of other specialist engineering firms) Pockets of unemployment in Corby, Wellingborough and Northampton – although not to the extent of D 2 N 2 or SCR SEM, Greater Lincolnshire, and LLEP –high business birth rates/survival rates Construction – important employer across the East Midlands LLEP, Greater Lincolnshire and GCGP – Food & Drink Parts of GCGP and Greater Lincolnshire – high rates of employment combined with lower skills/earnings suggest persistence of a ‘low pay low skill equilibrium’
The view from…
The view from…
Thank you for coming and have a safe journey home!