Graphing Linear Equations What is a linear equation




- Slides: 48
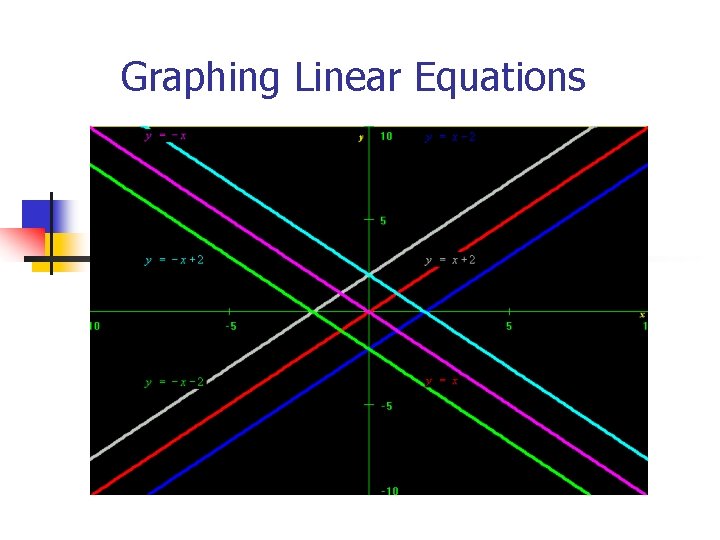
Graphing Linear Equations
What is a linear equation? n n Any equation that can be written as Ax+By=C where A and B are both not 0. Ax+By=C is called the general or standard form of the equation of a line.
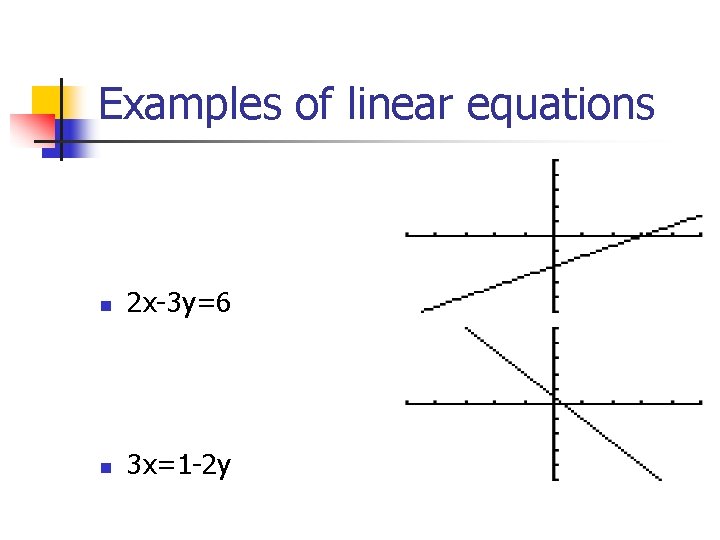
Examples of linear equations n 2 x-3 y=6 n 3 x=1 -2 y
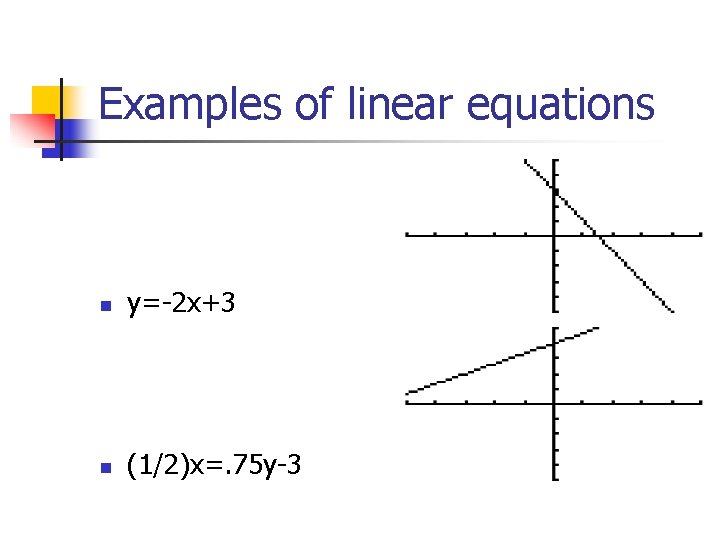
Examples of linear equations n y=-2 x+3 n (1/2)x=. 75 y-3
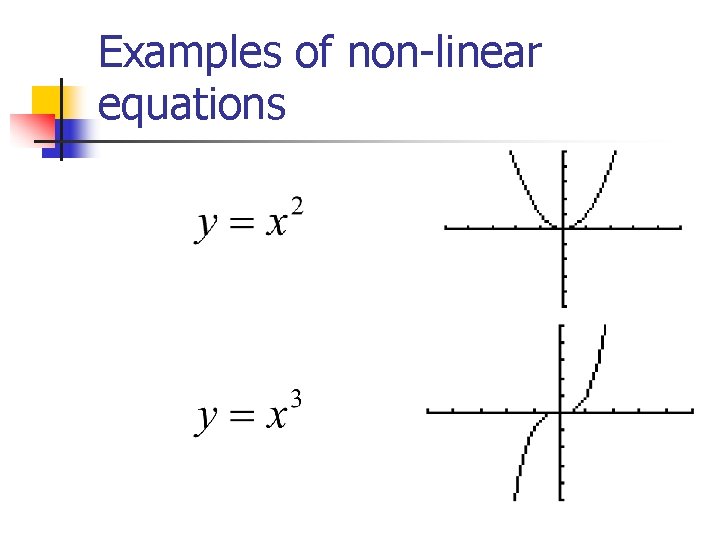
Examples of non-linear equations
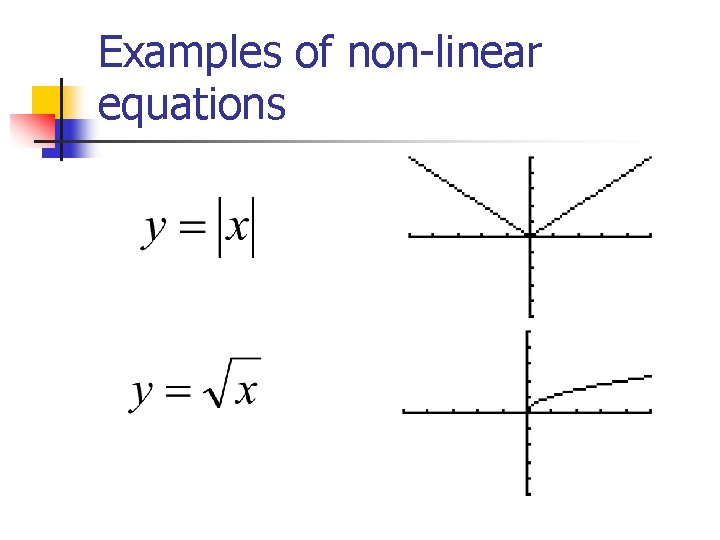
Examples of non-linear equations
Ways to Graph Linear Equations n Table of Values n x and y intercepts n Slope Intercept Form: y = mx + b
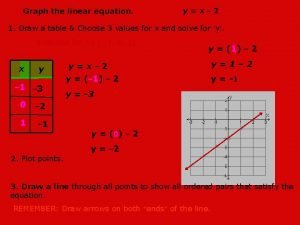
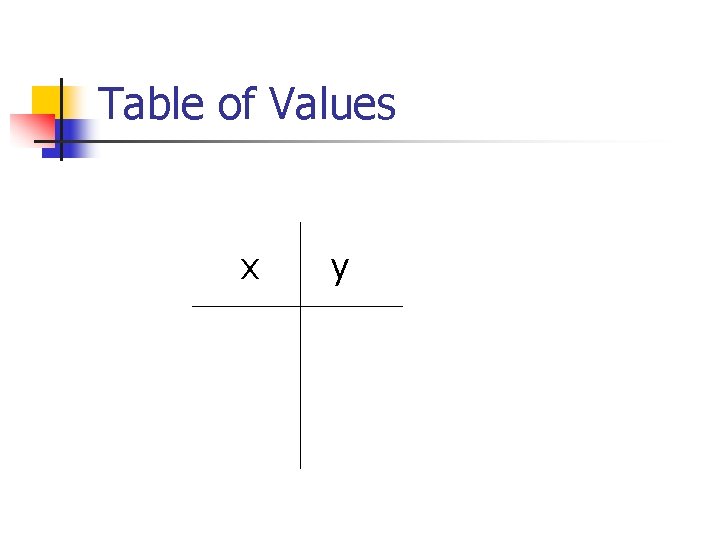
Table of Values x y
Table of Values n n You can select any value for x OR y, then you can solve for the other variable. If you choose a value for x, then input that value into the linear equation and solve for y. If you choose a y value, then solve for x.
Table of Values n n To create a line you need 2 coordinates. To be safe find 3 coordinates. If one point is incorrect, you will know because the coordinates will not create a straight line.
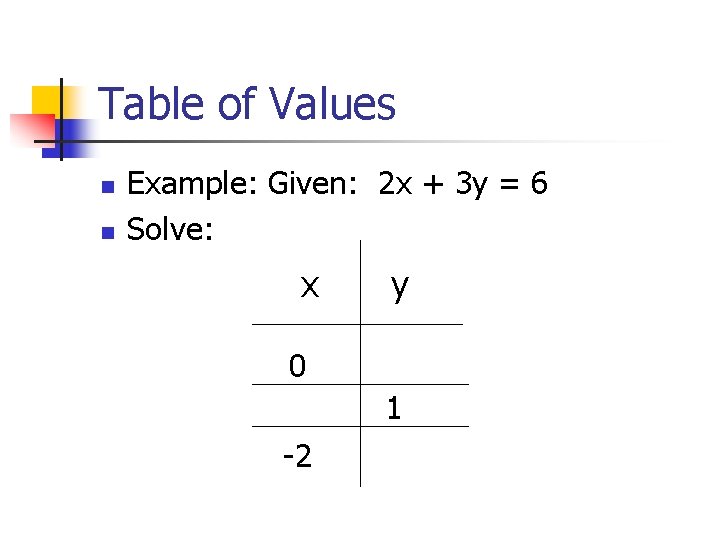
Table of Values n n Example: Given: 2 x + 3 y = 6 Solve: x y 0 1 -2
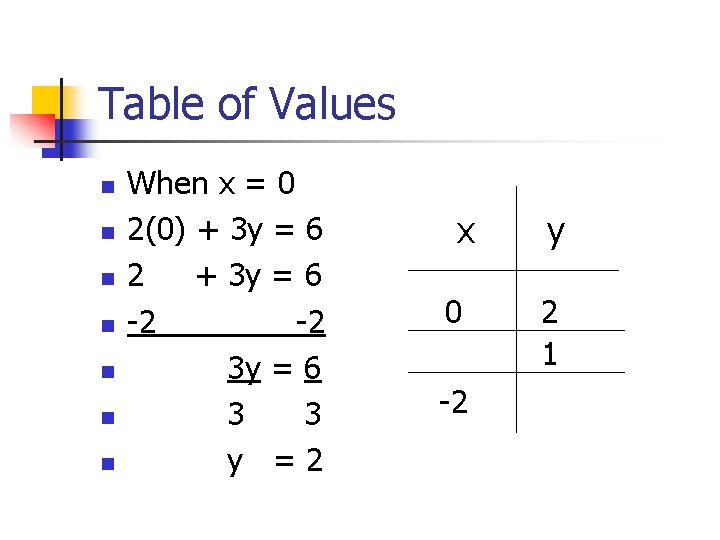
Table of Values n n n n When x = 0 2(0) + 3 y = 6 2 + 3 y = 6 -2 -2 3 y = 6 3 3 y =2 x 0 -2 y 2 1
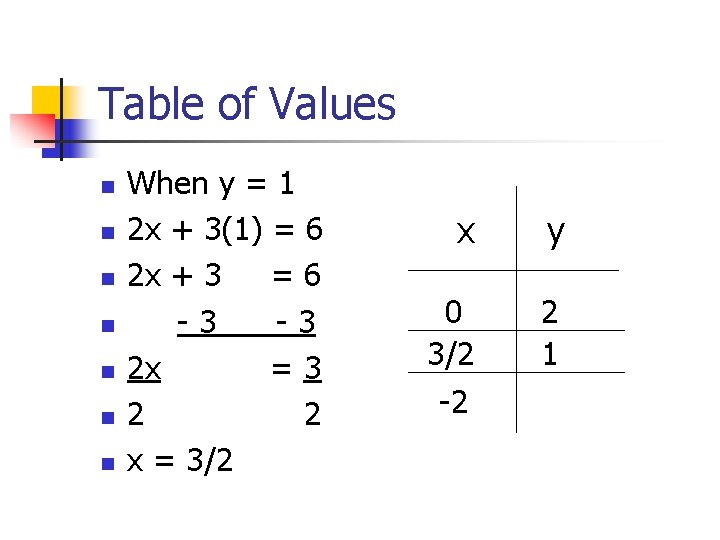
Table of Values n n n n When y = 1 2 x + 3(1) = 6 2 x + 3 =6 -3 -3 2 x =3 2 2 x = 3/2 x y 0 3/2 2 1 -2
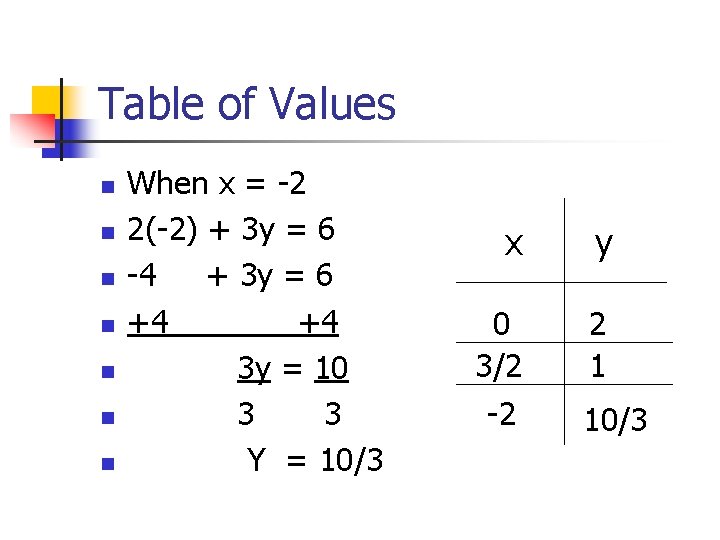
Table of Values n n n n When x = -2 2(-2) + 3 y = 6 -4 + 3 y = 6 +4 +4 3 y = 10 3 3 Y = 10/3 x y 0 3/2 2 1 -2 10/3
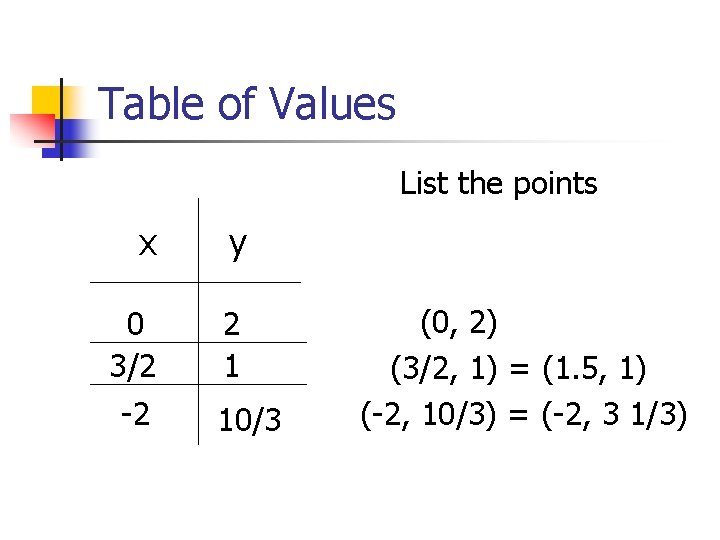
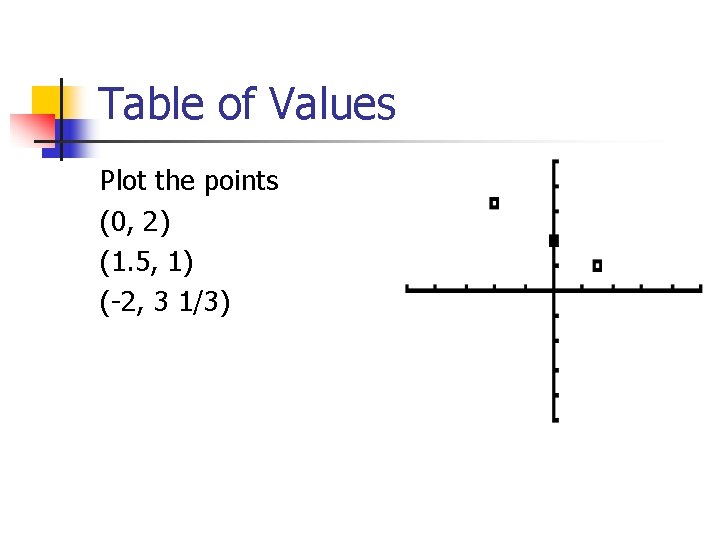
Table of Values List the points x y 0 3/2 2 1 -2 10/3 (0, 2) (3/2, 1) = (1. 5, 1) (-2, 10/3) = (-2, 3 1/3)
Table of Values Plot the points (0, 2) (1. 5, 1) (-2, 3 1/3)
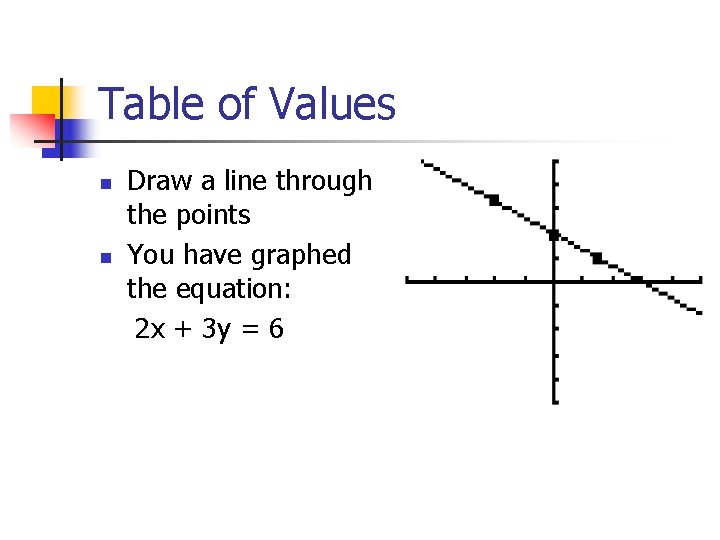
Table of Values n n Draw a line through the points You have graphed the equation: 2 x + 3 y = 6
Graph by x and y intercepts n n The x-intercept of a line is the point (a, 0) where the line intersects the x-axis. To find a, substitute 0 for the y and solve for x. The y-intercept of a line is the point (0, b) where the line intersects the yaxis. To find b, substitute 0 for the x and solve for y.
Graph by x and y intercepts n n Example: Graph 2 x +3 y = 6 by finding the x and y intercepts.
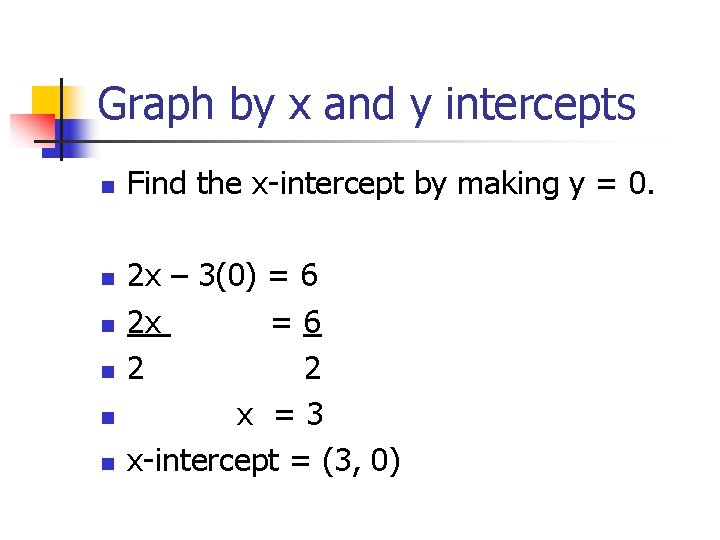
Graph by x and y intercepts n n n Find the x-intercept by making y = 0. 2 x – 3(0) = 6 2 x =6 2 2 x =3 x-intercept = (3, 0)
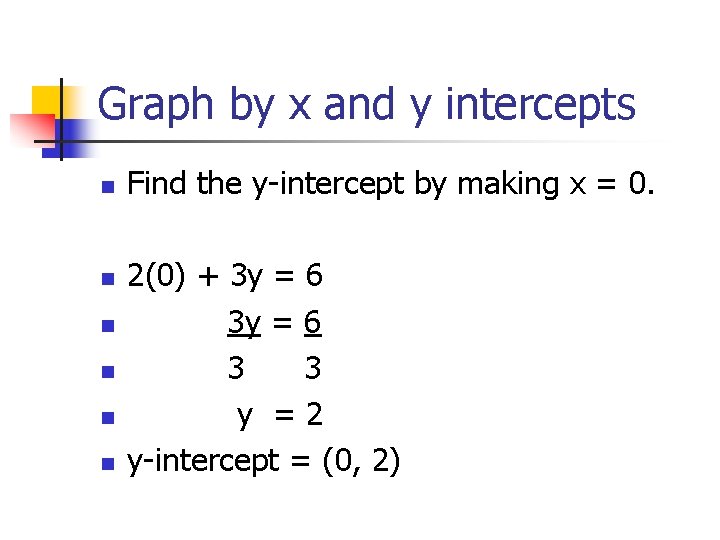
Graph by x and y intercepts n n n Find the y-intercept by making x = 0. 2(0) + 3 y = 6 3 3 y =2 y-intercept = (0, 2)
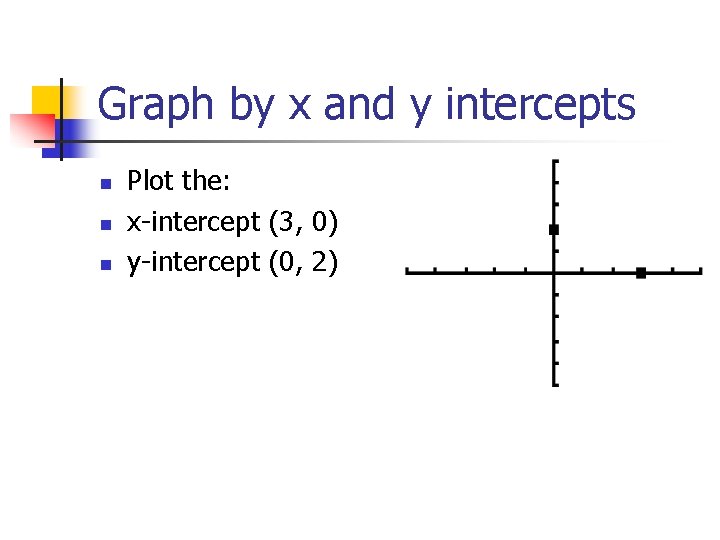
Graph by x and y intercepts n n n Plot the: x-intercept (3, 0) y-intercept (0, 2)
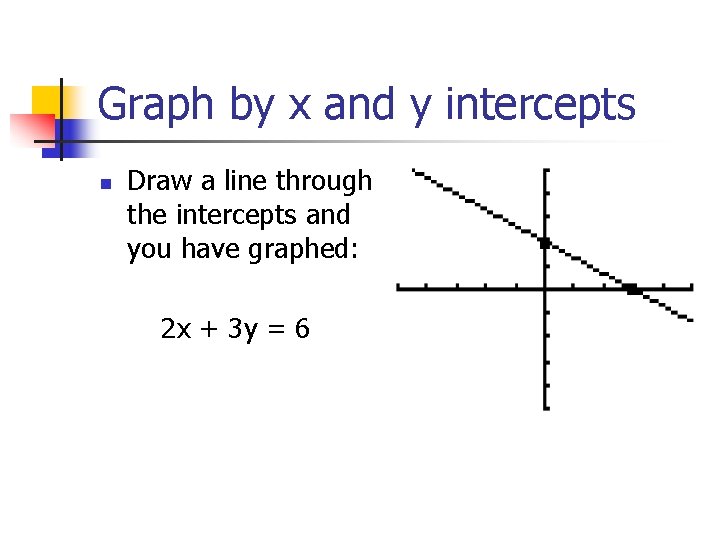
Graph by x and y intercepts n Draw a line through the intercepts and you have graphed: 2 x + 3 y = 6
Slope intercept form: y = mx + b n n The slope intercept form is y = mx + b where “m” is the slope and “b” is the yintercept. The x and y represent the coordinates which satisfy the linear equation.
Slope intercept form: y = mx + b The slope is all of the following: n rate of change of a linear graph. n change in y over the change in x. n vertical change over the horizontal change. n rise over run.
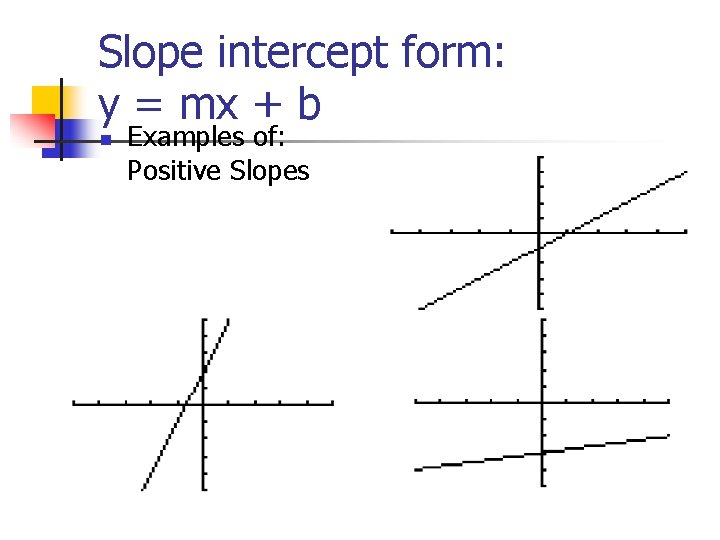
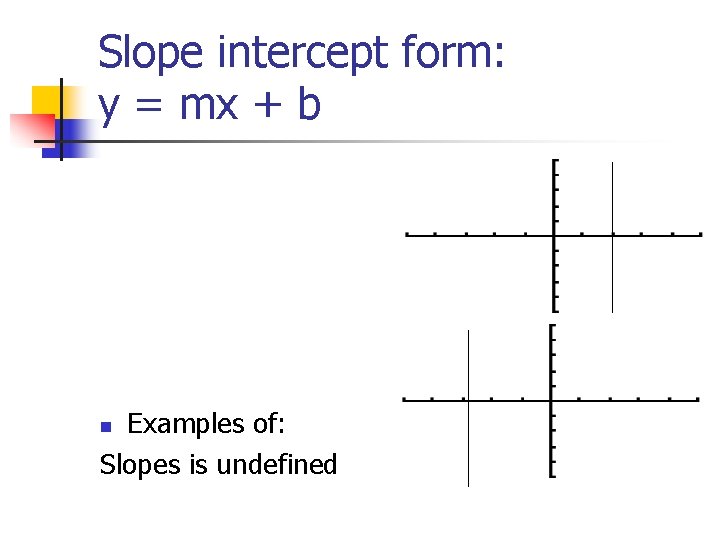
Slope intercept form: y = mx + b n Different Types of slopes n n Positive Negative Slope of zero Slope is undefined
Slope intercept form: y = mx + b n Examples of: Positive Slopes
Slope intercept form: y = mx + b n Examples of: Negative Slopes
Slope intercept form: y = mx + b Examples of: Slopes of zero n
Slope intercept form: y = mx + b Examples of: Slopes is undefined n
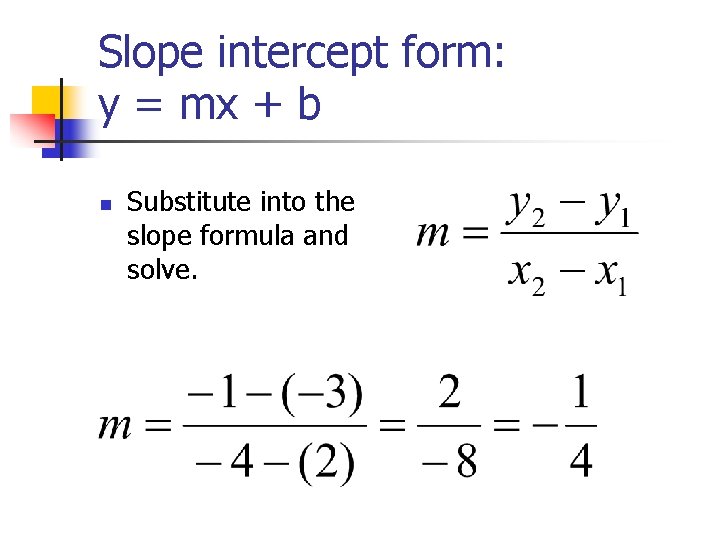
Slope intercept form: y = mx + b n n The slope formula is used to find the slope given two coordinates. Slope formula:
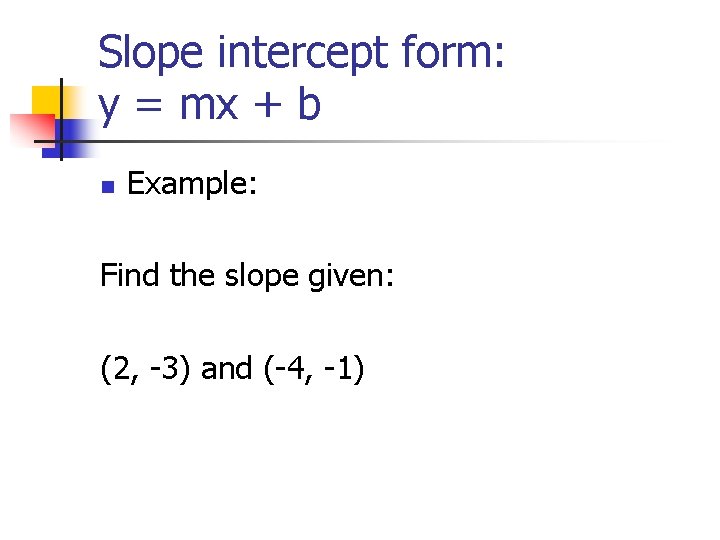
Slope intercept form: y = mx + b n Example: Find the slope given: (2, -3) and (-4, -1)
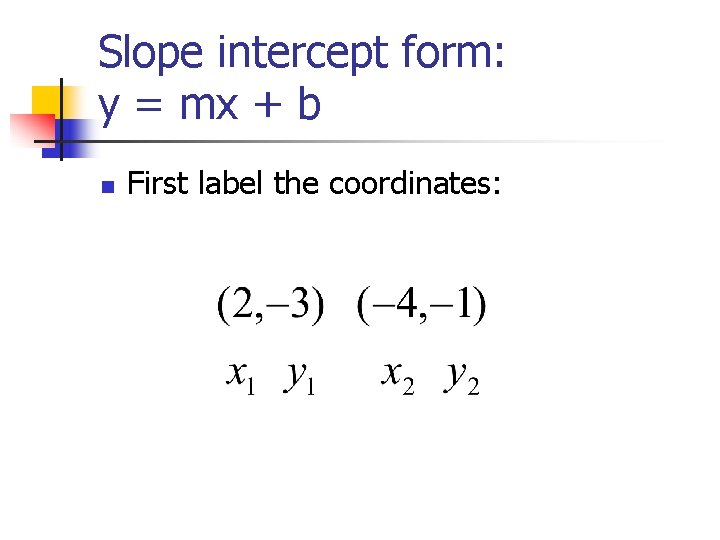
Slope intercept form: y = mx + b n First label the coordinates:
Slope intercept form: y = mx + b n Substitute into the slope formula and solve.
Slope intercept form: y = mx + b n n Slope can be determined by calling it rise/run. The rise determines if you go up or down. If the number is (+), then go up If the number is (-), then go down.
Slope intercept form: y = mx + b n n n The run determines if you go left or right. If the number is (+), then go to the right. If the number is (-), then go to the left.
Slope intercept form: y = mx + b n n n In our example, we got a slope of: (-1/4) The rise is: -1 The run is: 4 This means from a point on the graph, I would go down 1 and to the right 4 to find another point on the graph.
Slope intercept form: y = mx + b n To graph using the slope intercept form: n n n the equation must be in slope intercept form you must determine your “m” and “b” plot your “b” use “m” to find another point then draw a line through those coordinates
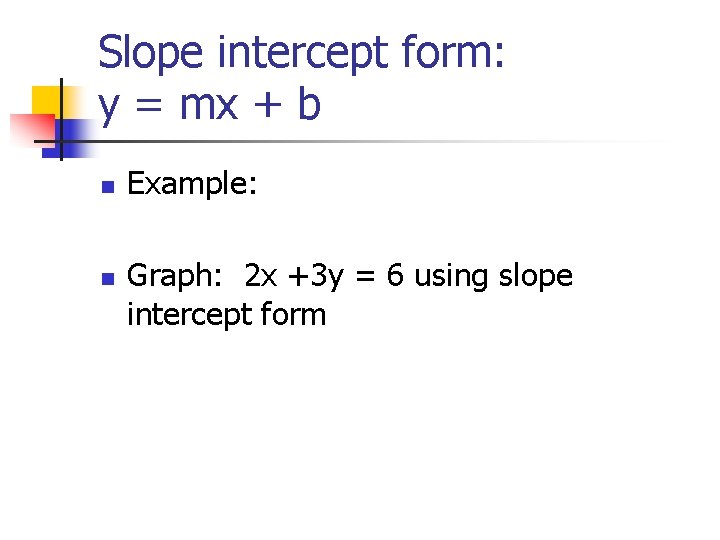
Slope intercept form: y = mx + b n n Example: Graph: 2 x +3 y = 6 using slope intercept form
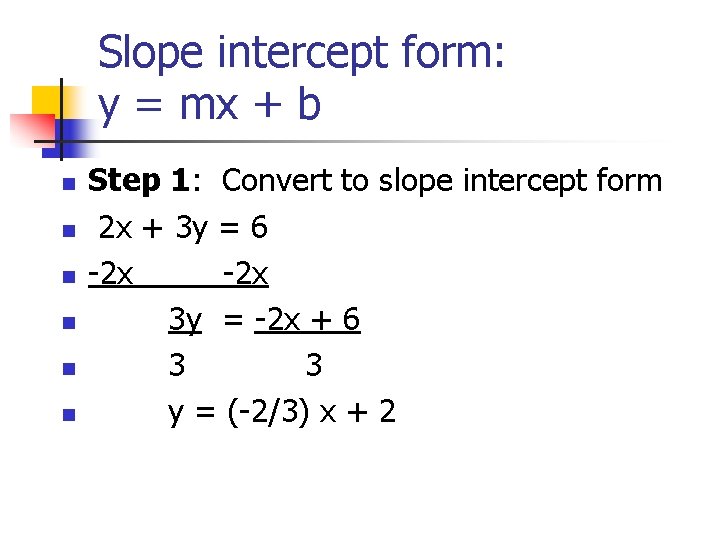
Slope intercept form: y = mx + b n n n Step 1: Convert to slope intercept form 2 x + 3 y = 6 -2 x 3 y = -2 x + 6 3 3 y = (-2/3) x + 2
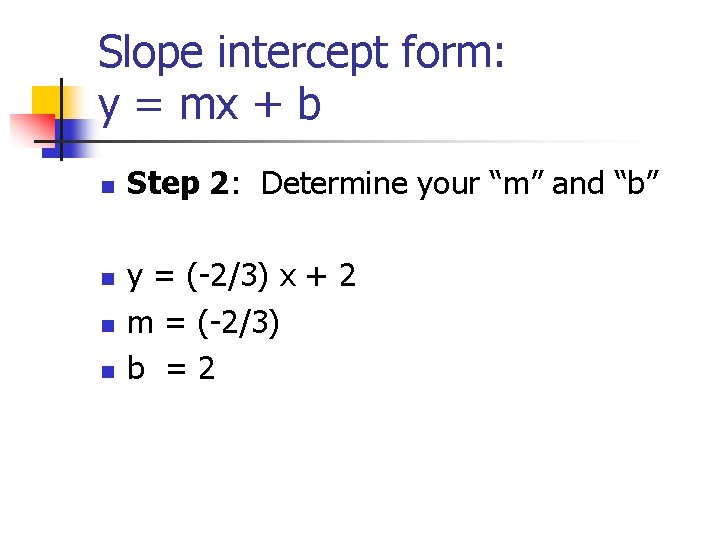
Slope intercept form: y = mx + b n n Step 2: Determine your “m” and “b” y = (-2/3) x + 2 m = (-2/3) b =2
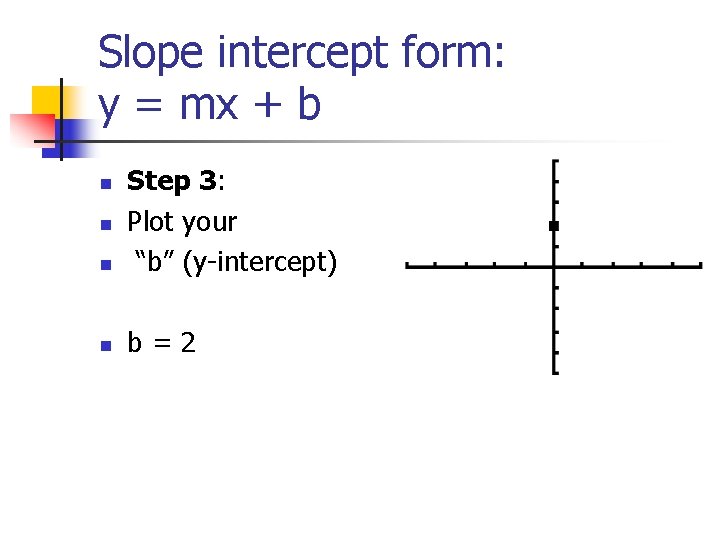
Slope intercept form: y = mx + b n Step 3: Plot your “b” (y-intercept) n b=2 n n
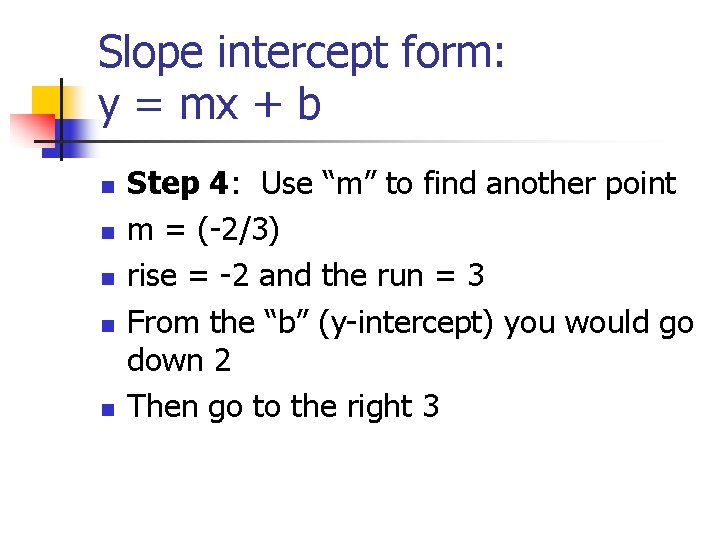
Slope intercept form: y = mx + b n n n Step 4: Use “m” to find another point m = (-2/3) rise = -2 and the run = 3 From the “b” (y-intercept) you would go down 2 Then go to the right 3
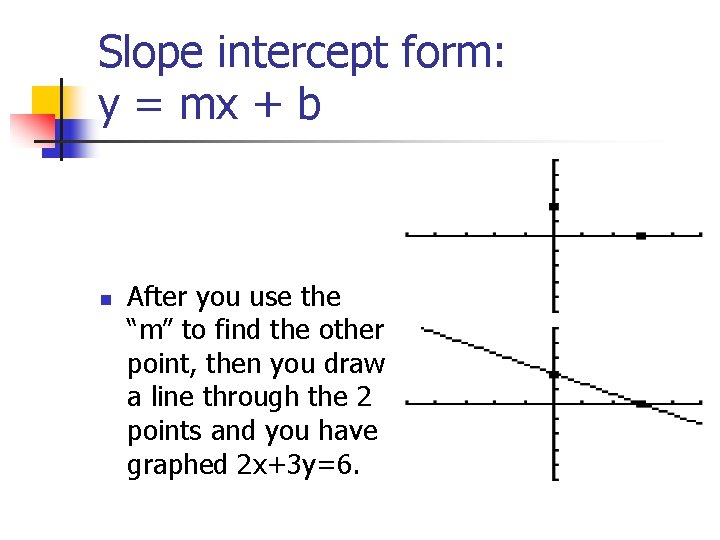
Slope intercept form: y = mx + b n After you use the “m” to find the other point, then you draw a line through the 2 points and you have graphed 2 x+3 y=6.
Now that you are done: “Try these practice problems using the various methods. ”
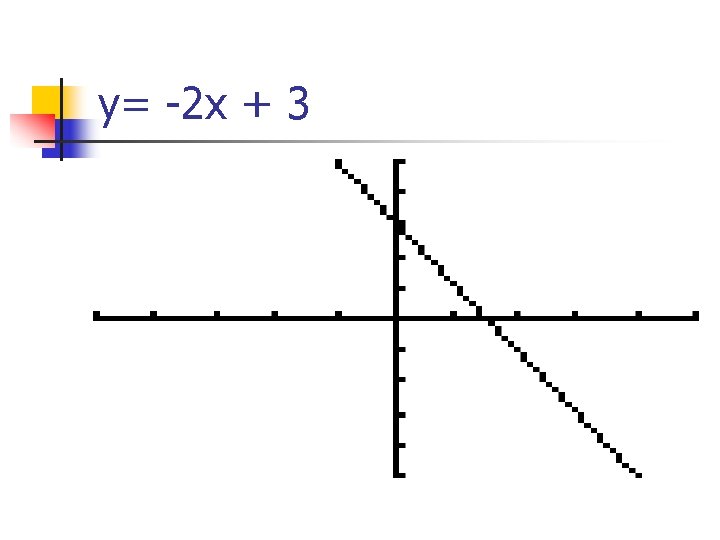
y= -2 x + 3
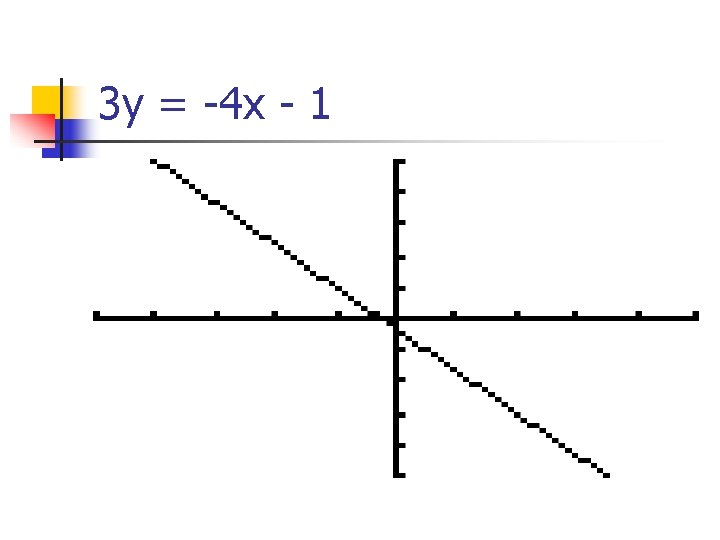
3 y = -4 x - 1