FLAG Capital Management Todays Venture Capital and Private


- Slides: 49

FLAG Capital Management Today’s Venture Capital and Private Equity Markets: How best to gain access? Peter Lawrence, Co-Founding Partner February 13, 2013

LEGAL NOTICE / IMPORTANT INFORMATION THE INFORMATION SET FORTH IN THIS DOCUMENT SHALL NOT CONSTITUTE AN OFFER, SOLICITATION OR RECOMMENDATION TO SELL, OR AN OFFER TO PURCHASE, ANY SECURITIES, INVESTMENT PRODUCTS, OR INVESTMENT ADVSIORY SERVICES. SUCH AN OFFER MAY ONLY BE MADE TO QUALIFIED INVESTORS BY MEANS OF DELIVERY OF A CONFIDENTIAL PRIVATE PLACEMENT MEMORANDUM OR OTHER SIMILAR MATERIALS THAT CONTAIN A DESCRIPTION OF MATERIAL TERMS RELATING TO SUCH INVESTMENT OR SERVICES, AND SHOULD BE THOROUGHLY REVIEWED. IN THE CASE OF ANY DISCREPANCY AMONG THE CONTENTS OF THIS DOCUMENT AND SUCH CONFIDENTIAL PRIVATE PLACEMENT MEMORANDUM OR OTHER SIMILAR MATERIALS, SUCH CONFIDENTIAL PRIVATE PLACEMENT MEMORANDUM OR OTHER SIMILAR MATERIALS SHALL PREVAIL. NO REGULATORY BODY, INCLUDING WITHOUT LIMITATION, THE U. S. SECURITIES AND EXCHANGE COMMISSION, ANY U. S. STATE SECURITIES ADMINISTRATOR AND THE HONG KONG SECURITIES AND FUTURES COMMISSION, HAS APPROVED OR DISAPPROVED, PASSED ON OR ENDORSED THE MERITS OF THE SECURITIES OR SERVICES REFERENCED HEREIN. AN INVESTMENT IN ANY FUND MANAGED OR SPONSORED BY FLAG CAPTAL MANAGEMENT, LLC OR ANY OF ITS AFFILIATES OR SUBSIDIARIES (INCLUDING, WITHOUT LIMITATION, FLAG SQUADRON ASIA LIMITED) (COLLECTIVELY, “FLAG”) IS SPECULATIVE DUE TO A VARIETY OF RISKS AND CONSIDERATIONS AS (OR AS WILL BE) DETAILED IN THE RELEVANT CONFIDENTIAL PRIVATE PLACEMENT MEMORANDUM OR OTHER SIMILAR MATERIALS AND THE INFORMATION CONTAINED HEREIN IS QUALIFIED IN ITS ENTIRETY BY THE MORE COMPLETE INFORMATION THAT IS (OR WILL BE) SET FORTH IN SUCH CONFIDENTIAL PRIVATE PLACEMENT MEMORANDUM OR OTHER SIMILAR MATERIALS. THE FUNDS MANAGED OR SPONSORED BY FLAG AND THE FUNDS IN WHICH THEY INVEST GENERALLY ARE NOT REGISTERED OR REGULATED UNDER U. S. OR OTHER LAWS, CONSTITUTE ILLIQUID INVESTMENTS, MAY NOT BE REQUIRED TO PROVIDE PERIODIC PRICING OR VALUATION INFORMATION TO INVESTORS, AND MAY BE SUBJECT TO HIGHER FEES AND EXPENSES THAN OTHER COMPARABLE FUNDS. EXCEPT AS OTHERWISE PROVIDED HEREIN, THE PERFORMANCE OF THE FUNDS MANAGED OR SPONSORED BY FLAG REFERRED TO HEREIN IS NET OF ALL FEES, CARRY AND EXPENSES. PAST RESULTS ARE NOT INDICATIVE OF FUTURE PERFORMANCE AND THERE IS A POSSIBILITY OF LOSS IN CONNECTION WITH ANY FUND MANAGED OR SPONSORED BY FLAG. THERE CAN BE NO ASSURANCE THAT ANY OF THE FUNDS MANAGED OR SPONSORED BY FLAG WILL ACHIEVE THEIR INVESTMENT OBJECTIVES. ANY STATISTICAL INFORMATION CONTAINED HEREIN HAS BEEN SUPPLIED FOR INFORMATIONAL PURPOSES ONLY AND IS NOT INTENDED TO BE, AND DOES NOT CONSTITUTE, INVESTMENT OR OTHER ADVICE NOR AN OPINION REGARDING APPROPRIATENESS OF AN INVESTMENT IN ANY OF THE FUNDS MANAGED OR SPONSORED BY FLAG. WHILE NEITHER FLAG NOR ANY THIRD PARTY INDEPENDENTLY AUDITED OR VERIFIED THE ACCURACY OF THE STATISTICAL INFORMATION CONTAINED HEREIN, ALL SUCH INFORMATION HAS BEEN OBTAINED FROM SOURCES BELIEVED TO BE RELIABLE. FLAG DISCLAIMS ANY AND ALL LIABILITY RELATING TO SUCH INFORMATION, MAKES NO REPRESENTATION AS TO THE ACCURACY OR COMPLETENESS THEREOF, AND IS UNDER NO OBLIGATION TO KEEP SUCH INFORMATION CURRENT AFTER THE DATE HEREOF. THESE MATERIALS MAY CONTAIN FORWARD-LOOKING STATEMENTS, WHICH INVOLVE RISKS, UNCERTAINTIES AND OTHER FACTORS WHICH MAY CAUSE THE ACTUAL RESULTS, PERFORMANCE OR ACHIEVEMENTS OF THE FUNDS MANAGED OR SPONSORED BY FLAG TO DIFFER MATERIALLY FROM ANY FUTURE RESULTS, PERFORMANCE OR ACHIEVEMENTS EXPRESSED OR IMPLIED BY SUCH FORWARD-LOOKING STATEMENTS. THESE MATERIALS ARE CONFIDENTIAL AND HAVE BEEN PREPARED SOLELY FOR THE INFORMATION OF THE INTENDED RECIPIENT AND MAY NOT BE REPRODUCED, DISTRIBUTED OR USED FOR ANY OTHER PURPOSE. REPRODUCTION OR DISTRIBUTION OF THESE MATERIALS MAY CONSTITUTE A VIOLATION OF U. S. FEDERAL, U. S. STATE OR HONG KONG SECURITIES LAWS. THESE MATERIALS WERE PREPARED EXCLUSIVELY BY FLAG. THE OPINIONS EXPRESSED HEREIN ARE CURRENT AS OF THE DATE INDICATED HEREOF ONLY. THE MANAGERS TO THE FUNDS IN WHICH FUNDS MANAGED OR SPONSORED BY FLAG INVEST HAVE NOT REVIEWED OR APPROVED THE INFORMATION CONTAINED HEREIN. FLAG CAPITAL MANAGEMENT, LLC IS A REGISTERED INVESTMENT ADVISER UNDER THE U. S. INVESTMENT ADVISERS ACT OF 1940, AS AMENDED. FLAG SQUADRON ASIA LIMITED IS REGULATED BY THE HONG KONG SECURITIES AND FUTURES COMMISSION. Confidential - Do Not Distribute 2

Asset allocation Efficient Frontier Expected Return Venture Capital Private Equity Int’l Equity Real Assets Common Stock Mezzanine Cash Fixed Income Risk (Standard Deviation) "A good portfolio is more than a long list of good stocks and bonds. It is a balanced whole, providing the investor with protections and opportunities with respect to a wide range of contingencies. ” Harry Markowitz, Portfolio Selection: Efficient Diversification of Investments, Nobel Laureate in Economics Confidential - Do Not Distribute 3

Are VC & PE meaningful in the ecosystem? Market Size NYSE Count $14 Trillion 3, 600 companies Mutual Funds § World $24 Trillion 69, 000 funds § U. S. $12 Trillion 8, 600 funds NASDAQ $4. 4 Trillion 2, 800+ companies Hedge Funds $2. 1 Trillion 7, 500+ funds U. S. Private Equity $187 Billion “Dry Powder” 1, 114 firms U. S. Venture Capital $62 Billion “Dry Powder” 842 firms NO… a drop in the bucket … Source: NASDAQ, NYSE, 2011 Investment Company Factbook, Morningstar, Dow Jones, Private Equity Growth Council, Preqin, NVCA Yearbook 2011. Confidential - Do Not Distribute 4

… but private markets outperform Source: Cambridge Associates. Returns are time-weighted pooled means net of management fees, expenses and carried interest as of 6/30/12. The pooled means represent the time-weighted rates of return calculated on the aggregate of all cash flows and market values as reported by the General Partners to Cambridge Associates, LLC in their quarterly and annual audited financial reports. U. S. Venture returns based on data compiled from 1, 386 U. S. venture capital funds, including fully liquidated partnerships, formed between 1981 and 2012. U. S. Private Equity returns based on data compiled from 986 U. S. private equity funds (U. S. buyouts, private equity energy, growth equity and mezzanine funds), including fully liquidated partnerships, formed between 1986 and 2012. All data are annualized index returns. S&P and NASDAQ indices assume the reinvestment or dividends and other distributions, if any. Annualized returns for the S&P 500 and NASDAQ are provided for information purposes only and do not reflect a basis of comparison for pooled investment partnerships. Past performance is not indicative of future returns. Confidential - Do Not Distribute 5

Access makes the difference – look at the quartiles! All Funds <$750 M Source: Thomson Venture Economics, Inc. data as of 6/30/12. Past Performance is not indicative of future results. Confidential - Do Not Distribute 6

The value of sourcing the right managers Highly inefficient asset class with outsized return potential… Private Capital …But also a wide divergence in prospective returns Net avg. annual compound returns (%) Top Quartile vs. Median Performance 35 30 25 20 15 10 5 0 + 1, 500 bps + 1, 000 bps Top quartile Median + 100 bps +50 bps Bonds Equities Private equity Venture capital Exposure ≠ Success Key Requisites for Outperformance: § Extensive resources to identify, access and thoroughly diligence investments § Pattern recognition derived from experience and “deal flow” Source: FLAG Capital Management internal research. Bonds and equities data based upon one hundred year historical returns and assumptions of top-quartile outperformance. Private equity and venture capital median and top quartile data based upon Venture Economics, Inc. historical returns dating from 1984 for private equity and 1980 for venture capital. Past performance is not indicative of future performance. Net average annual compound returns for bonds and equities are provided for informational purposes only and do not reflect a basis of comparison for pooled partnership investments. The market volatility, liquidity and other characteristics of private equity and venture capital fund investments are materially different from those of bonds and equities. Confidential - Do Not Distribute 7

HOW BEST TO GAIN ACCESS Is that the real challenge? Confidential - Do Not Distribute 8

The pros and cons Why Bother? But… Illiquidity risk … LPs got overallocated and burned in ‘ 08 Takes “forever” to know how you’re doing Lots of work for small dollars Hard to position yourself for success Done right … a dependable source of alpha Fee drag? Potential for second guessing? Confidential - Do Not Distribute 9

The real challenge: Marshaling the resources How do you: § § § Perform original research? Build relationship networks? Conduct thorough due diligence/negotiations? Construct the portfolio. . . diversification strategy/implementation? Actively manage the portfolio? Cover the geographies? … and in the end, gain access? Confidential - Do Not Distribute 10

Agenda Focus: Private Equity & Venture Capital § Conditions in the PE and VC markets § What are the best tactical approaches to optimize performance? Hint. . . “Lower Middle Market” “Early-stage IT” § How can you play? Confidential - Do Not Distribute 11

PRIVATE EQUITY Why the Lower Middle Market? Confidential - Do Not Distribute 12

PE: An evolving landscape The Case for Private Equity An Increasingly Diverse Asset Class § Diversification benefits § Outsized return potential Annualized Historical Performance 3 years 5 years 10 years 15 years U. S. Gov’t Bond Index 5. 6% 5. 8% 6. 0% S&P 500 (2. 9%) 2. 3% 1. 4% 6. 8% U. S. Private Equity Index 2. 8% 9. 5% 9. 7% 12. 2% Small Buyouts Mega Buyouts Specialist Generalist Operationally Focused Financial Engineering Private Equity Outperformance vs. Public Equities Minority Interests Growth Control Buyout Turnaround Sources: Cambridge Associates U. S. Private Equity Index, S&P, Barclays Capital Gov’t/Credit Bond Index. Data through 12/31/10. Note, the rates of return for the U. S. Gov’t Bond Index and the S&P 500 index are provided for information purposes only and does not reflect a basis of comparison for pooled partnership investments. The market volatility, liquidity and other characteristics of private equity fund investments are materially different from those of the U. S. Gov’t Bond Index and the S&P 500 index. Confidential - Do Not Distribute 13

PE market segmentation Market Strategy to e g lar ? o o rm T o f per The Lo Mar wer M ket i (LM ddle M) Market Segment / Company Size Large Medium Small Turnaround Value Buyout Growth Fund Size >$5 B # of Funds ~2 dozen EV Target* >$1 B $1 BM - $5 B <$1 B ~100 Several hundred $300 M - $1 B <$300 M f o re ** a G w Be MBO M JA Debt Highest Mid/High Lowest Market Efficiency Greatest Middle Least *Enterprise Value **Acronym for “Just Another Middle Market Buy. Out Group” Confidential - Do Not Distribute Financially and operationally distressed Solid but underperforming High growth sectors/companies 14

U. S. Private Equity – New deal environment Deal environment remains healthy Aggregate Deal Value ($B) Market dynamics resemble “pre-peak” period 2008 Source: Preqin 2009 2010 2011 2012 Source: Pitchbook Note: 2012 YTD through 9/30/12. Confidential - Do Not Distribute 15

U. S. Private Equity – Realizations LPs continue to be cash positive in 2012 Exit volumes remain above historic average Private Equity Money In – Money Out Quarterly average 2006 Source: Pitchbook 2007 2008 2009 2010 2011 2012 Source: Thomson Venture Economics. Data displayed for US Private Equity. Note: 2012 through 06/30. Data is continuously updated and is therefore subject to change. Confidential - Do Not Distribute 16

U. S. Private Equity – Fundraising environment remains challenging 2008 Source: Pitchbook 2009 2010 2011 A bifurcated market: “haves” and “have nots” 2012 Source: Preqin; data refers to Private Equity funds worldwide Confidential - Do Not Distribute 17

U. S. Private Equity – Industry Dynamics Smaller deals have commanded lower valuations Dry powder level has been steadily declining North American Buyout Dry Powder by Fund Size Purchase Price Multiple by Deal Size 69% 31% N/A 1 Investment Year Source: Preqin. Source: S&P LCD. “N/A” indicates there is an insignificant sample size for that time period. 1 2012 YTD for deals >$500 M is through October. 2012 YTD for deals <$250 M was unavailable from S&P; Data in the chart is through November and sourced from GF Data’s November 2012 Report. Confidential - Do Not Distribute 18

PE performance drivers Drivers of PE returns Execution Implications for PE funds § Need deal sourcing advantage 1. Must “buy right” § Price discipline § First call § Focus – sector, geography, deal type 2. Operating improvement 3. Top-line growth 4. Leverage 5. Must “sell right” § Strategic/operational expertise § Relevant backgrounds § Grow EBITDA § Less polished targets § Internal growth § Serve as catalyst § Acquisition/Roll up § Reposition sales force § Savvy financial institutions § Necessary but not sufficient § Impeccable reputation with lenders § Subject to general capital market swings § Optimize sale § Plan exit before buying § Capitalize on market cycles § Experience counts … Easier to execute in Lower Middle Market Confidential - Do Not Distribute 19

Why the Lower Middle Market? Less Capital & More Companies(1) U. S. buyout capital raised since 2000 By fund size >$750 M ($1 T) Number of U. S. companies By revenues Consistent Outperformance Over Time(3) >$100 M (20, 000) <$750 M ($250 B) $5 M-$100 M (350, 000) Lower Valuations & Less Leverage (Last 10 Years)(2) VS. Notes: (1) 2007 U. S. Census; Thomson Venture Economics; Pitchbook; Preqin; Dow Jones; Private. Equity. Firms. com. (2) S&P LCD 2010; purchase prices and leverage levels from 12/31/00 -12/31/10. (3) Thomson Venture Economics, cumulative pooled returns for U. S. buyout funds raised between 12/31/90 -12/31/10 and 12/31/00 -12/31/10. Confidential - Do Not Distribute 20

PE and VC are counter-cyclical U. S Buyout and Venture Performance Source: Cambridge Associates. Internal rates of return are net of fees, expenses and carried interest as of 6/30/12. The pooled means represent the time-weighted rates of return calculated on the aggregate of all cash flows and market values as reported by the General Partners to Cambridge Associates, LLC in their quarterly and annual audited financial reports. U. S. Venture returns based on data compiled from U. S. venture capital funds, including fully liquidated partnerships, formed between 1981 and 2008. U. S. Private Equity returns based on data compiled from U. S. private equity funds (U. S. buyouts, private equity energy, growth equity and mezzanine), including fully liquidated partnerships, formed between 1986 and 2008. All data are annualized index returns. Past performance is not indicative of future results. Confidential - Do Not Distribute 21

VENTURE CAPITAL Why early-stage information technology? Confidential - Do Not Distribute 22

Venture is the growth engine of the U. S. Revenue of Venture-Backed Companies Relative to U. S. GDP (data as of 2010) Employment and Revenue Growth at Venture-Backed Companies vs. Total Private Sector (data as of ’ 08 -’ 10) ~ 21% of U. S. GDP Venture-Backed Company Employment at IPO vs. after IPO Total Private Sector Employment (in 2010) Venture-Backed companies account for 11% of private sector employment Source: NVCA, Venture Impact 6 th edition, 2011 (data as of 2010). NVCA Yearbook 2011. Confidential - Do Not Distribute 23

A small industry, but a growth engine Comparison of economic, public and venture growth rates 2011 GDP growth 2011 YOY revenue growth Revenue growth of recent VC backed IPOs 1 Source: FLAG internal analysis, PE Hub Note: ¹ Average revenue growth of the companies that went public between 5/16/11 and 11/28/11 with revenues that were trading above IPO price (Source: PEHub). Confidential - Do Not Distribute 24

VC performance drivers VC Market Dynamics Technology Trends Exit Markets § Capital efficiency changes the game § Fundraising challenges persist … capital flows to the best-known managers § Access to “top” funds is still crucial …but a changing of the guard § Moore’s Law … relentless doubling of compute power (speed, price, scale) § Mobile + Networks = exponentially expanding, real-time, global connectivity § Leading to universally disruptive, investable business models § Number and scale of exits rising § VC investors benefitting from higher pre-IPO valuations § JOBS Act alleviates certain IPO roadblocks Confidential - Do Not Distribute 25

U. S. VC environment $’s Invested Outpacing Fundraising (By amount raised/invested during period) Sources: NVCA, Thomson Reuters. Data is as of 12/31/12. Confidential - Do Not Distribute 26

Continued consolidation and concentration Increasingly Concentrated Capital 20 largest funds accounted for 72% of 2012 total 20 Largest Funds: 42% 47% 42% 63% 79% 62% 77% 72% (Vintage year of fund) Finally a shakeout in active VC firms Sources: Dow Jones Venture. Source, CB Insights and 2012 NVCA Yearbook. In the ‘Increasingly Concentrated Capital’ chart fundraising totals are by vintage year of fund and data is as of Q 3’ 12. Thomson Venture Economics, NVCA Yearbook 2012, FLAG internal analysis. * “Active U. S. VC firms” on this slide are defined by FLAG as those firms that have made four or more new investments during the year with a minimum average quarterly transaction size of $1 M. Confidential - Do Not Distribute 27

Access Makes the Difference 20 -Year U. S. Venture Pooled Average Returns* § § Venture Capital is an Access Class not an Asset Class – Substantial concentration of historical returns in the venture industry created by “franchise funds” – “Success is sticky”…only a select group of managers deliver superior returns; access to these successful managers is critical Successful manager characteristics: – Attract entrepreneurs with the best ideas – Preferred syndicate partners – Unparalleled networks – Pattern recognition “Historical Franchise Funds Universe” Source: *Thomson Venture Economics as of 6/30/12. Past performance is not indicative of future results. The returns set forth above do not reflect the deduction of any advisory fees, carried interest or expenses that would be incurred by an investor in a FLAG fund that would have invested in these pooled venture funds. No FLAG fund has invested in the entire pooled venture fund depicted in this chart. Note: Managers highlighted above represent “franchise funds” as defined by FLAG. There is no guarantee that any FLAG Venture Partners fund has invested, or will invest, in each of these 28 managers. Confidential - Do Not Distribute

Access: The Game has Changed The New Environment § Franchise funds have grown larger, gone global § New innovation cycle § Ecosystem evolution − Driven by a new set of entrepreneurs − Cloud computing…a utility − New York emerges as #2 geography − Internet commerce § − Social networking − Mobile everything (i. Pad, Android) 5 x less expensive to start a company today and prove its business model − Capital still needed to scale new business models The Opportunity Emergence of Micro VC’s to Fill the Gap Note: Managers highlighted above represent “Emerging Managers” as defined by FLAG. There is no guarantee that any FLAG Venture Partners fund has invested, or will invest, in each 29 of these managers. Confidential - Do Not Distribute

Disruptive new technologies… Computing Growth Drivers Over Time (1960 -2020 E) More Than Just Phones Smartphone Tablet Units Over Time e. Reader Cell Phone / PDA Car Electronics (GPS, ABS, A/V) Desktop Internet Mobile Video 10 B+ Units? Games Wireless Home Appliances 1 B+ Units PC Television 100 M+ Units Mainframe 1 M+ Units 1960 1970 Fitness Tracker Minicomputer 10 M+ Units 1980 1990 2000 Source: Morgan Stanley research Confidential - Do Not Distribute 2010 2020 30

…lead to new market leaders New Entrants Often Win Big in New Cycles While Incumbents Often Falter Mainframe Computing 1965 IBM NCR Control Data Honeywell Burroughs Sperry 1970 1975 HP Data General Prime Computervision Wang Labs Digital Equipment 1980 1985 Mobile Internet Computing Desktop Internet Computing Personal Computing 1990 Microsoft Cisco Intel Apple Oracle EMC Dell Compaq 1995 2000 2005 Facebook Linked. In Zynga Groupon Google AOL e. Bay Yahoo! Netscape Amazon. com 2010 ? And… Asia New Winners 1960 Mini Computing Tencent Alibaba Baidu Rakuten Sources: Factset, Fortune, Morgan Stanley research. Winners from 1960 s to 1980 s based on Fortune 500 rankings; desktop internet winners based on wealth created from 1995 to peak market capitalizations. Confidential - Do Not Distribute 31

Social behavior accelerating mobile growth Location Sharing Foursquare Waze Services Airbnb Angie’s List Communication Group. Me Twitter Music Sharing Spotify Social Gaming Zynga OMGPop Confidential - Do Not Distribute Shazam Health Fitbit Health. Tap 32

Mobile revolutionizing commerce Location–Based Transparent Pricing Discount Offers Instant Gratification Enable real-time physical retail / service opportunities Instant local and online price comparison Accept credit cards and cash over mobile devices Over-the-air instant digital product & content delivery Uber Saving. Star Square Confidential - Do Not Distribute Dropbox 33

Online community-based platforms Education Marketplace & Curation Finance Educational platforms create an interactive way to learn Marketplace and curation platforms offer new e-commerce options New forms of financial services firms have emerged Confidential - Do Not Distribute 34

“Big Data” drives innovation Storage Management § Estimated 1. 8 zettabytes of data created and replicated in 2011 § Emphasis will shift from optimizing storage to efficiently indexing and searching data § Equivalent to 57. 5 B i. Pads… Analytics § Organizations that apply advanced data analytics have achieved 12 x more profit growth and 33% more revenue growth Future in Analytics: Currently, ~80% of a company’s data is unstructured Trend Forecasting § …Or an i. Pad mountain 25 x taller than Mt. Fuji § In 2009, $4 T IT-related expenses § Average employee spends 2 hours daily on information searches Sources: Mashable June 2011, ed. Cetra. Training. Confidential - Do Not Distribute More Cloud Portability Across Devices 35

Healthcare is feeling the pressure … good for VC? Productivity Crisis § Fewer product approvals § Rising R&D budgets Reimbursement Pressure Patent Cliff § Over $200 B in lost revenue over § Meaningful efficacy is needed the next five years due to patent expirations on blockbusters to grant reimbursement § Pressure on “me too” products Generic Competition Innovation Gap § Fewer novel products § Generics capture markets in days Regulatory Challenges § Higher safety hurdles § Rising R&D budgets Source: Third Rock Ventures. Confidential - Do Not Distribute 36

Cleantech sector … disappointing to date Cleantech investing has been highly correlated to oil prices … but … Capital intensity does not fit the venture capital model WTI Spot Prices ($) Invested Globally ($B) Amount Raised ($M)1 Noteworthy Developments $3, 747 M Pulled IPO on 4/12/12 $2, 056 M Filed for bankruptcy on 9/1/11 $1, 711 M Stopped production; looking for investors / acquirers $717 M Filed for bankruptcy on 10/12/12 $565 M Fighting federal lawsuit in DE $524 M Acquired for $30 M on 1/10/13 $492 M Latest down round financing closed 6/12/12 Sources: Cleantech Group, NVCA, EIA, Venture. Source Note: Includes equity, debt securities and government loans Confidential - Do Not Distribute 37

Sustained momentum in the exit markets $121* Announced Transactions Source: Dow Jones Venture. Source as of 12/31/12. Announced IPO volume reflects market capitalization at time of IPO. *Includes Facebook IPO, which represents $104 B of the $121 B Announced IPO Volume in Q 2’ 12. Confidential - Do Not Distribute 38

IT acquisitions likely to continue Cash Balances As of December 31, 2012 ($ in Billions) Sources: Dow Jones Venture. Source, company filings. Recent Major Acquisition Confidential - Do Not Distribute Price 2012 - 2013 Acquisitions $1. 2 B 6 $450 M 12 $1. 2 B 11 $356 M 3 $810 M 11 $1. 7 B 8 $2. 4 B 0 $2. 4 B 13 $7. 7 B 12 $775 M 8 39

Private investors benefiting More $1 B+ Deals Value Accruing to Private Investors $104. 2 B $100 PRIVATE investors are poised to capture the value this cycle PUBLIC investors were primary beneficiaries of valuation increases in past cycles Current market cap: $107 B $86 B $260 B Notable Exits: Cisco Amazon Microsoft Linked. In Zynga Groupon Facebook Earlier Tech Cycles New Tech Cycle Sources: Dow Jones Venture. Source, FLAG internal analysis, public filings / news search. Confidential - Do Not Distribute 40

SO HOW DO YOU PLAY? You probably need a partner Confidential - Do Not Distribute 41

Investment Process: detailed and perpetual Sourcing § “See everything” to build comparative context § Employ systematic approach to culling through managers § Need to be proactive § Supplement with thematic mapping Due Diligence Performance § Build proprietary database of historical notes / perspective § Employ a quantitative/qualitative framework Benchmarking § Build models to analyze track records / sources of value creation § Perform extensive referencing Deal Level Analysis Active Portfolio Management § Rigorous monitoring at deal level, fund level and portfolio level Manager Communication and News § Track granular data on every portfolio company § Gain insights: log conversations, rumors, news clippings, etc. § Actively manage portfolios as necessary Team and Strategy Evaluation Confidential - Do Not Distribute 42

Concentration: Venture is a “hits” business 3, 500 Average # of VC-Backed Investments Per Year 3% # Investments 100 Average # of IPO and M&A Exits > $100 M Per Year # Hits Successful venture investing requires casting a wide enough net to capture the winners… but not so wide as to dilute performance Sources: Thomson Venture Economics, Pricewaterhouse. Coopers/National Venture Capital Association Money. Tree™ Report. Investments includes all investments greater than $100 K from 2002 -2012. Total M&A and IPO exits constitutes all announced M&A and IPO deals over $100 M from 2002 to 2012. A lag exists between the time of investment and the exits achieved during the same time period. Confidential - Do Not Distribute 43

VC portfolio construction philosophy Concentration § Venture Capital is a “hits business”: – Requires casting a wide enough net to capture winners … – … but not so wide as to dilute performance Sector Stage § Anchored by technology-focused funds – the epicenter of entrepreneurial innovation § Balanced by select healthcare managers with the rare combination of relevant networks, commercialization expertise and demonstrated track records § Cautious but opportunistic in emerging sectors (e. g. , cleantech) § Targeted blend of early-stage, multi-stage and venture growth equity managers: – Emphasis on early-stage companies, balanced with the relative stability of more mature growth businesses – Captures the lifecycle of Venture Capital … and the Right Access § A blend of § Renowned franchise funds § Compelling new players Confidential - Do Not Distribute 44

Navigating the Lower Middle Market Over 70% of Funds Raised since 2000 <$750 M(1) The challenge LMM fund characteristics ~1, 100 LMM private equity funds raised since 2000 Hard to Diligence Hard to Access Hard to Find Wider Dispersion of Returns in LMM(2) Turnaround Last 20 Year Net IRR Fund Size < $750 M > $750 M Top Quartile 16. 9% 12. 4% Median 5. 3% 5. 7% Spread 11. 6% 6. 7% Value Buyout Growth Sources: Thomson Venture Economics; FLAG proprietary research Notes: (1) Represents U. S. private equity funds raised since 2000. (2) Performance through 12/31/2010 of all U. S. buyout funds raised from 12/31/90 -12/31/10. (3) Examples for illustrative purposes only. Listed managers will not necessarily be included in the FLAG Private Equity V, L. P. (FPE V) portfolio, or in any portfolio of any successor fund to FPE V. Confidential - Do Not Distribute 45

International: another layer of complexity/opportunity Europe¹ Asia² 17. 6 T ~25% $ GDP / % of Global 11. 6 T ~17% 0. 5 B 3. 6 B 0. 3% ~1% Population / Growth Rate 471 38³ Passenger Cars (per 1, 000 people) 72 34³ Internet Users (per 100 people) Sources: The World Bank. IMF World Economic Database. ¹ Data for European Union (2011; “Passenger cars per 1, 000 people” metric from 2009) ² Data for South Asia and East Asia & Pacific (2011; “Passenger cars per 1, 000 people” metric from 2009) ³ Data for East Asia & Pacific only. ⁴ Data as of Q 1 2012 for Europe, 2011 for China and 2011 for India. Confidential - Do Not Distribute Primary Focus Secondary Focus 46

How can you invest in VC & PE? Direct Investments in Private Companies Investments in VC & PE Funds Investor Acquire Multiple Fund Interests via Fund-of-Funds Investor Fund-of-Funds VC / PE Fund VC / PE Fund Portfolio Company Portfolio Company Portfolio Company Portfolio Company Portfolio Company Portfolio Company Confidential - Do Not Distribute 47

Agenda Focus: Private Equity & Venture Capital § Conditions in the PE and VC markets Favorable: - But don’t attempt to market time - Invest consistently across cycles § What are the best tactical approaches to optimize performance? Overweight: - Proven yet less efficient sectors - Fund managers that add value § How can you play? Get help: - A trusted partner - a properly diversified portfolio of leading funds Confidential - Do Not Distribute 48

THANK YOU! Questions? Confidential - Do Not Distribute 49
 Private equity glossary of terms
 Flag private equity
 Stages of venture capital financing ppt
 Venture capital telecommunications
 Advantages of venture capital
 Emarketing plan
 Vina meaning in vietnam
 Advantages of venture capital
 Venture capital method
 Argentina venture capital
 Venture capital definition
 Venture capital
 Venture capital method
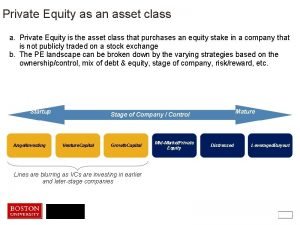
 Private equity asset class
 Irish venture capital association
 Warrants venture capital
 Intro to venture capital
 Bdc vc
 Venture capital bubble
 Lista funduszy venture capital
 When new port shipping uses segmented marketing
 Assessing a new venture's financial strength and viability
 Creating and starting the venture
 Joint venture and merger example
 Generations
 What about today's class
 Todays with apostrophe
 Todays worldld
 Whats todays temperature
 Todays globl
 Whats todays wordlw
 Chapter 13 marketing in todays world
 Todays plan
 Todays sabbath lesson
 Welcome remarks for sabbath school program
 Walsall rugby club
 Todays health
 How to identify simile
 Todays objective
 Todays objective
 Todays whether
 Todays vision
 Todays objective
 Today planetary position
 Todays date in mla format
 Todays final jeopardy
 Handcuff nomenclature
 Todays weather hull
 Todays objective
 Date frui
