Faculty of Medicine Introduction to Community Medicine Course
 Introduction to Statistics and. By.")


 based on average birth rates • Mali and Niger")
 Mortality rates by age-sex")


 Mathematical Methods : Some")
 Arithmetic Growth Method : In this method it is assumed")
 Geometric Growth Method : This method assumes the population")
 Exponential Growth Method : In this method it is")


 • RNI Birth rate – Death rate = --------------10 in")


 : The first stage is associated with")
 : The third stage is characterized by")


 Age groups (Cohorts) Percentage of the whole population")


- Slides: 44
Faculty of Medicine Introduction to Community Medicine Course (31505201) Introduction to Statistics and. By. Demography Hatim Jaber MD MPH JBCM Ph. D 27+29 - 11 - 2016 1
• Demography, Statistics, Introduction to Statistics in Medicine, Demography • Epidemiology, Epidemiological methods • Study design: Why to study and How? Study design… Crosssectional, Case-control, Cohort design, Clinical trials • Measurement of Association (Risk factors & disease) • Health Education and Communication: What is communication and why in medicine? Elements and Types of communication , Health education • Primary Health care: Levels of Health care; Primary Health care • Maternal Health Care, Child Health Care • Healthcare Management and Health Administration, Management, Health Administration and Health Policy , The planning cycle and Health Systems Planning Health policy • Health and Research, What is research? Evidence based Medicine, Research proposal
Introduction to unit 4 Epidemiology • Definition , History of Epidemiology Purpose/Use of Epidemiology • Concepts in the infectious diseases • Disease Causation • Measurements of Morbidity and Mortality • Levels of prevention and vaccination • Screening for diseases and vaccination • Sources of Data and methods of data collection • Epidemiological Surveillance • Epidemic Investigation and Management 4
Presentation outline Time Introduction and Definitions 12: 00 to 12: 10 Demography and Public health 12: 10 to 12: 20 Sources of data 12: 20 to 12: 30 Population Pyramid 12: 30 to 12: 40 Demographic Transition 12: 40 to 12: 50 5
Demography and Public Health • Demography is the scientific study of human populations. It is mainly concerned with • Size : It refers to the total number of persons in the given population. • Distribution : It refers to the arrangement of entire population with respect to the geographical areas at a given point of time. • Structure : It refers to the distribution of the given population with respect to age and sex. • Change : It refers to the increase or decrease in the size of the given population due to fertility, mortality and migration. • Development : It refers to the development of the given population with respect to socio economic aspects. • Other characteristic like genetic inheritance, intelligence and health.
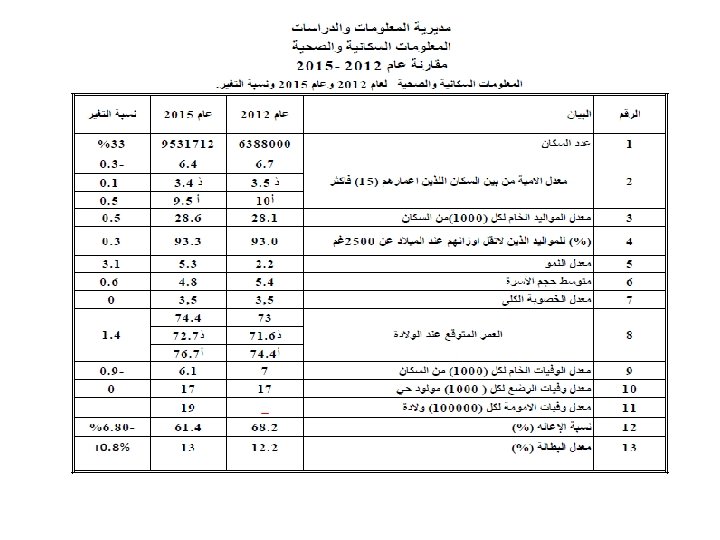
Other terms Mortality rates - number of deaths per thousand people. It is 6. 1 in Jordan. 8. 37 per 1, 000 for the world and U. S. 23. 74 in Angola. Birth rates – number of births per 1, 000 people per year. In Jordan 28. 6. 13. 83 in US, 51. 08 in Niger. Growth rate – percent change in population over time. growth rate = birth rate — death rate + net immigration rate ÷ 1, 000 Dependency ratio – comparison of working age with those who don’t work (in Jordan 61. 4) Formula: People 65 and over + children 14 and Under ÷ people who work × 100 Migration rate – Immigrants – emigrants ÷ 1, 000. US is 4. 25; United Arab Emirates is 21. 71 Life expectancy – number of years a person is expected to live. In Jordan 74. the US is ranked 36 th at 78. 3. Japan is 1 st at 82. 6. Swaziland is last at 31. 88
Age Dependency ratio – comparison of working age with those who don’t work Formula: People 65 and over + children 14 and Under =---------------------------× 100 people who work (15 -64 year) (in Jordan 61. 4)
Total Fertility Rate • (TFR) based on average birth rates • Mali and Niger in West Africa have TFRs over 7 • The average number of births per woman Mali will double its population in 26 years • Singapore has a TFR of 1. 07 and Canada 1. 61. China is 1. 75. They will lose population. • The EU is 1. 5! • The TFR for the world is 2. 59 • In Jordan 3. 5
• • Role of Demography in Public Health 1) Mortality rates by age-sex and its geographical distribution with respect to various diseases are helpful in locating and identifying diseases of public health importance. ii) Percentage distribution of population by age-sex-location are helpful in understanding health and health care needs of various age groups by sex by location, for planning, : Vaccination and immunization program for children under 5 years of age, Mother and Child Health program for mother and new born, Family planning program, old age program, nutritional program etc. iii) Determining the success or failure of health programs. iv) To describe the level of community health. v) To determine the leading causes of mortality and morbidity. vi) To determine the relative importance of different fatal diseases with respective to age and sex. vii) To discover solution to health problems and find clues for public health administration.
Sources of Demographic Data : The following are the sources of demographic data. The details of these sources have already been dealt with in detail in an exclusive chapter in the section on epidemiology : • 1. Census • 2. Vital Events Registers • 3. Surveys • 4. Sample Registration System
Methods for Estimating and Characterizing Populations • Census: provides information about the number of people in an area and population characteristics such as age, gender, or race/ethnicity, economic status, and housing statistics; measures people based on their place of residence only; in most industrialized countries, censuses are conducted once every 10 years with intercensal updates provided by a variety of surveys.
Methods for Estimating and Characterizing Populations • • Population surveys: local, national and international actors involved in development and humanitarian activities carry out surveys on a regular basis to scope information on health, nutrition, access to water, housing, poverty eradication, etc. ; surveys produce baseline population data and indicators relevant for risk and vulnerability assessment and identify specific characteristics of subnational groups; these can be used to update census data. • • Population projections: mathematical projections use available data and formulas that incorporate predictions of mortality, birth rates, health and education status to estimate the growth of various parts of a population over time; often used for countries where no recent, reliable population data exist.
Methods for Estimating and Characterizing Populations • • National and global population databases: global spatial databases of population applied to identify populations at risk; use models to allocate national-level population data to a global grid consisting of quadrilateral areas of specified size; capture total population size in the grid but not demographic information; supplementary source for population size and distribution where little reliable information exists, or is not available. • • Proxy measures: remotely sensed imagery serves as a supplementary source for population size and distribution and improves population estimates and locations for areas where little reliable information exists, or is not available. Determining any personal information about individuals directly from remotely sensed imagery is nearly impossible, although the social status of residents in an area by interpreting characteristics such as building size and shape and amenities such as vegetation and road networks may be indirectly inferred.
Measures of Population Projection • By “Population projections”, we mean estimating and forecasting the population of a country or a region for a given time. There are mainly three types of population estimates namely • inter-censal (during any two consecutive census period), • post-censal (any period following latest census up to the present moment of time) • and future (any period time after the present moment).
The following measures of population estimates are commonly used. i) Mathematical Methods : Some of the mathematical models which are commonly used for estimating inter-censal and postcensal population estimates are : ● Arithmetic Growth Method ● Geometric Growth Method ● Exponential Growth Method ● Component Projection Method
Mathematical Methods : a) Arithmetic Growth Method : In this method it is assumed that there is an equal addition every year to the population during the inter censal period and this addition is taken to be average increase per year. Arithmetic Growth Method for estimating population is where P 0 population at time t is, P 0 and P 1 are populations at two consecutive censuses. a = P 0 and b = ((P 1 - P 0 ) ÷ 10) and inter census period = 10 years. For example populations of a town A at censuses 1 st Mar 1981 and 1 st Mar 1991 were 50, 000 and 90, 000. Estimate population of the town on 1 st Mar 1985. Here a = 50, 000, inter-censal period = 10 years, b =4, 000 per year and t =4, = 66, 000
Mathematical Methods : • b) Geometric Growth Method : This method assumes the population begets population at a constant rate of increase on the compound interest law.
Mathematical Methods : • c) Exponential Growth Method : In this method it is assumed that there is an exponential growth. • d) Component Projection Method : This method is mainly used for future population projections (future estimates).
Figure World Population Growth Source: Joseph A. Mc. Falls, Jr. Population: A Lively Introduction. Third edition. Population Reference Bureau 53(3); 1998: 38
23
Replacement Rate • The TFR that is needed for a population to replace itself or zero population growth. • It is 2. 1 babies in developing countries. Higher in countries with high death and emigration rates • BUT, it is only 2. 1 if (mortality) rates and migration rates remain constant.
• Natural increase method Using The differences between live births and deaths • Graphic method
Rate of natural increase(RNI) • RNI Birth rate – Death rate = --------------10 in Jordan 28. 6 -6. 1/10= 22. 5/10= 2. 25
Law of 70 Calculation of population doubling time is facilitated by the Law of 70. If a population is growing at a constant rate of 1% per year, it can be expected to double approximately every 70 years -- if the rate of growth is 2%, then the expected doubling time is 70/2 or 35 years. In Jordan 70/2. 25= 31. 1
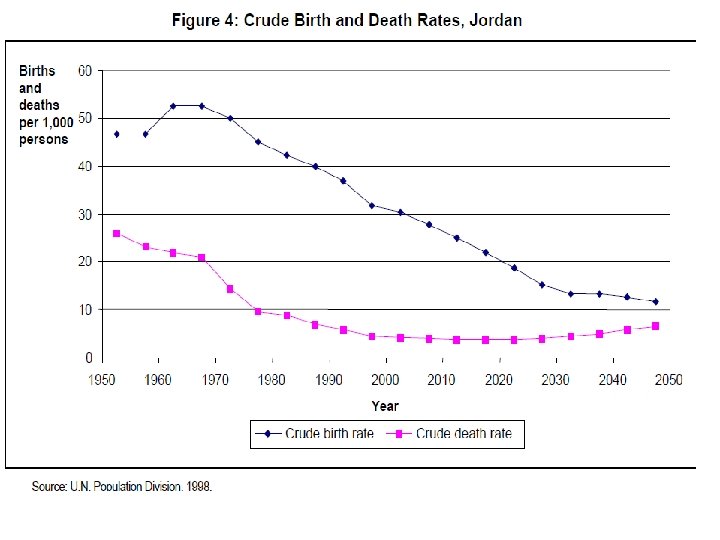
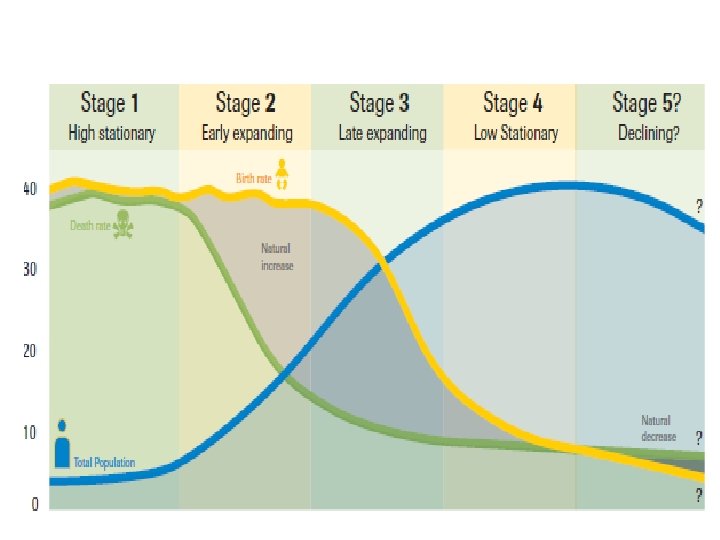
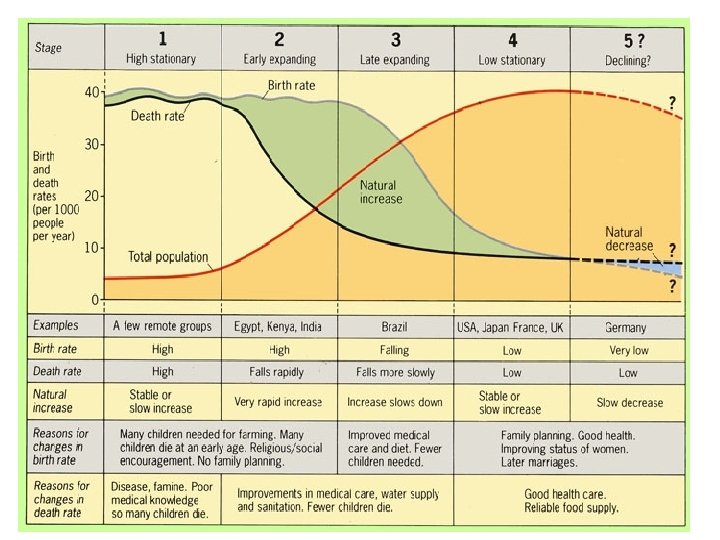
Demographic Transition • In 1929 the American demographer Warren Thompson, observed changes in birth and death rates in industrialized societies over the past two hundred years or so and then formulated a model called “Demographic Transition” • Demographic Transition model recognizes five demographic stages : namely • high stationary, • early expanding, • late expanding, • low stationary • and declining.
demographic stages ●● High stationary (first stage) : The first stage is associated with pre Modern times, and is characterized by very high birth rates and very high death rate (30 -50 per 1000) balance between them results in only very slow population growth that is referred to as the “High Stationary Stage” of population growth. ●● Early expanding (second stage) : The second stage is characterized by a rise in population caused by a decline I the death rate while the birth rate remains unchanged, or perhaps even rises slightly.
demographic stages ●● Late expanding (third stage) : The third stage is characterized by further decline in the death rate while birth rate tends to fall that results in increase in the population growth. ●● Low stationary (fourth stage) : The fourth stage is characterized by a low birth rate and low death rate; the balance between them results in no population growth that is referred to as the “low Stationary Stage” of population growth. ●● Declining (fifth stage) : The fifth stage is characterized by a birth rate lower than death rate the balance between them results in decline in population growth that is referred to as the “Declining Stage” of population growth.
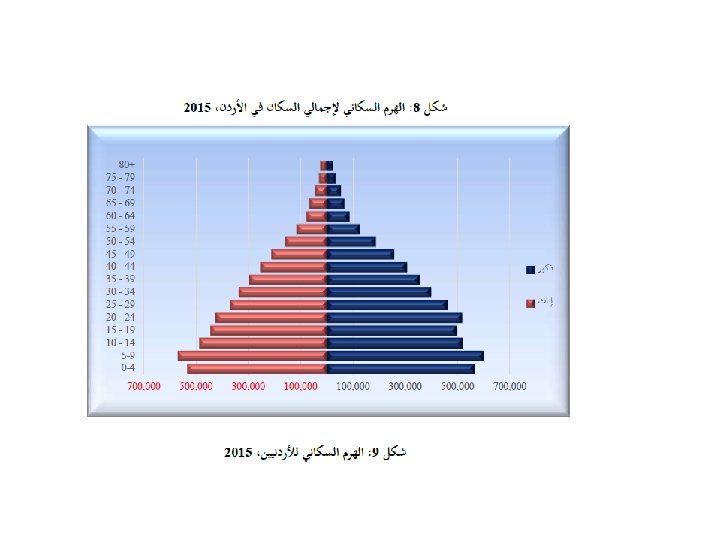
Age structure • Population profiles shows the age structure of a population, which is the distribution of population by age and sex • These profiles help demographers project how populations will change over time. • shows the age and gender composition of a region • horizontal axis: divides gender and shows absolute number of people or in percentage of population o male: left-hand female: right-hand • vertical axis: age in 5 -year or 10 -year intervals
65+ 4% 15 -64 62% 0 -14 34%
Population Pyramids • Population Pyramid definition • A series of bar graphs that show age structure of a population by sex • characteristics shapes of ‘pyramids’ o wide base (true pyramid) o wide middle (bulge), somewhat wider base o urn- or bottle-shaped o reversed pyramid • Pre-reproductive Age: 0 -14 • Reproductive Age: 15 -44 • Post-Reproductive Age: 45 and older
POPULATION STRUCTURE The population pyramid displays the age and sex structure of a country or given area OLD DEPENDANTS Population in Five Year Age bands ECONOMICALLY ACTIVE YOUNG DEPENDANTS MALES To the left Usually, but not always, in % to make for easier comparisons between countries FEMALES To the right
Parts of the Pyramid Gender (Sex) Age groups (Cohorts) Percentage of the whole population
Population Pyramids
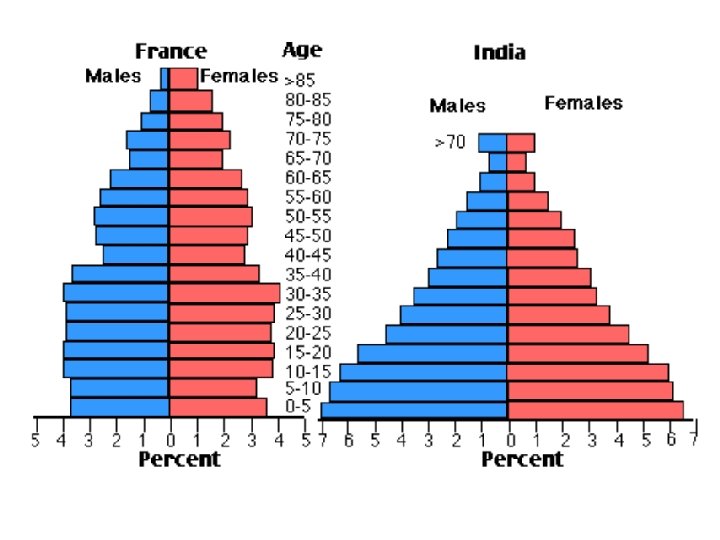
3 main types of Pyramids Baby Boom Expansive Rapid growth – big base “The Christmas Tree” Stationary Slow growth – “The box”. The United States Constrictive Negative growth – loss of population. “The Cup”
Comparing 3 different growth pyramids
Overview of pyramids