DOSRESPONSE JAPAN NUCLEAR RADIATION Hazard identification Recommendation RISK


 Pb Maximum Concentration (mg/L) Zone I 0")

 BY DEVENDER KUMAR AND GROUP MEMBERS.")


, which becomes C (the blood")


/(BW*AT); HQ>1 – risk present. METAL Cadmium Nickel")


 A REPORT ON “RISK ASSESSMENT ON BOMBAY HIGH OIL")


 Health Impacts & Risk Assessment of")


 PONNI MARIET")


 Proper Maintenance")


.")
- Slides: 80
DOS-RESPONSE JAPAN NUCLEAR RADIATION
Hazard identification
Recommendation .
RISK CHARACTERIZATION • In a narrow sense, risk characterization is an integral component of risk assessment process and involves complex and value-related judgments [1]. • Based on hypothetical exposures considered, lifethreatening damage could reach the possible or likely range if the worker is exposed to a very large gamma spike during a work shift, say owing to a hydrogen explosion. The Fukushima Disaster • A radiological emergency situation currently exists at the Fukushima Dai-ichi (No. 1) nuclear power station (NPS) in Japan as a result of the Mar 11, 2011, magnitude 9. 0 earthquake, which triggered a massive tsunami that killed thousands of Japanese citizens • If a person is exposed to a large gamma dose delivered to the entire body, cells in irradiated tissues can be destroyed in large numbers. This can lead to deterministic radiobiological effects
Modeling Methods • The cumulative normalized dose is indicated by , and for a given absorbed radiation dose differs for different deterministic effects.
Risk managment • • Yamashita kept repeating that the radiation dose between 10 to 100 millisievert (m. Sv) was an “uncertain” level, whereas the dose over 100 m. Sv was associated with a dose dependent cancer risk throughout life. “Evacuation – Most people within 20 kilometers of the nuclear power plant were rapidly evacuated Moreover, in terms of iodine tablet intake for children, refer to the disaster manual and administer iodine syrup. Also, for individuals over age 40, administer stable iodine tablets only if they want to. ” If radioactive particles exist, worry about rain. For the amount of radioactivity in Tokyo area, rain is important to wash out such kind of fallout in this area. • Production of food was stopped, locally produced food was no longer distributed outside Fukushima or even from Ibaraki • Distribution of food was indeed halted during the acute stage, but over time this protocol was relaxed, with rice grown in contaminated areas being sold to wholesalers or mixed in with uncontaminated rice for distribution to food industry, destined for hospital food and school lunches.
CEL 899 ENVIRONMENTAL RISK ASSESSMENT OF OCEANIC OIL SPILL Somya Singla Harsh Arya Kshitij Mittal
OIL SPILL: CAUSES OIL SPILL Natural fault zone extending to seabed absence of impervious cap rock Ship-borne leakage from shallow oil sources Operational Malfunction of oil separator Malfunction of shipboard system Contravention of conventions Accidental Ship collision Structural failure Oil tanker wash out in open sea
RISK IDENTIFICATION • For spill, we need to estimate: – – The duration of input The rate of dispersion The period of time over which the components will persist The concentrations at which biological effects will and will not be observed • For the fate of the material, consider its: – Environmental component (water, air, sediment) – Form in which it’ll be present – Concentrations • Information to be collected: – Types of oils frequently stored in, or transported through, that area – Locations where oil is stored in large quantities and the mode of transportation used to move the oil
• Vulnerability analysis information: – List of public safety officials in the community – List of facilities such as primary health centres, nursing homes and hospitals – List of recreational areas, such as camping grounds – List of critical habitats that can be affected when a spill occurs – Identification of parts of the environment that are particularly susceptible to oil or water pollution • Direct impacts – – Localized nutrient enrichment Saprogenic effects Temperature increase Pollution from oils and chemicals ØOil: toxic initially, later emulsifies
IMPACT OF OIL SPILL • Oil: contains hydrocarbons • Can affect air quality • Potential fire hazard • Effect on recreational areas, harbors, industries, commercial fishing grounds and tourist attractions • Effect on marine life: – Cut-off of oxygen from Risk assessment matrix for oil spill
CONTINGENCY PLAN • First step towards effective oil spill response • Aspects: sources of spillage, prevailing risk with possible • size, maximum rate of oil discharge, likely reasons, types of oil handled, oil characteristics, spill movement data, trajectory, fate of the spilled oil through time, mechanical recovery plan, application of dispersants, sensitivity mapping and logistics Response actions: – Notifying all private companies or government agencies – Getting trained personnel and equipment to the site quickly – Defining the size, position and content of the spill, direction and speed of movement, likelihood of affecting sensitive habitat – Ensuring the safety of all response personnel and the public – Stopping the flow of oil and preventing ignition
HUMAN HEALTH RISK ASSESSMENT of HEAVY METALS from BHALASWA LANDFILL Balsher Singh Sidhu (2009 CE 10292) Dikshant Sharma (2009 CE 10297) Smit Gupta 2009 CE(10344) Tushar Tuteja (2009 CE 10351)
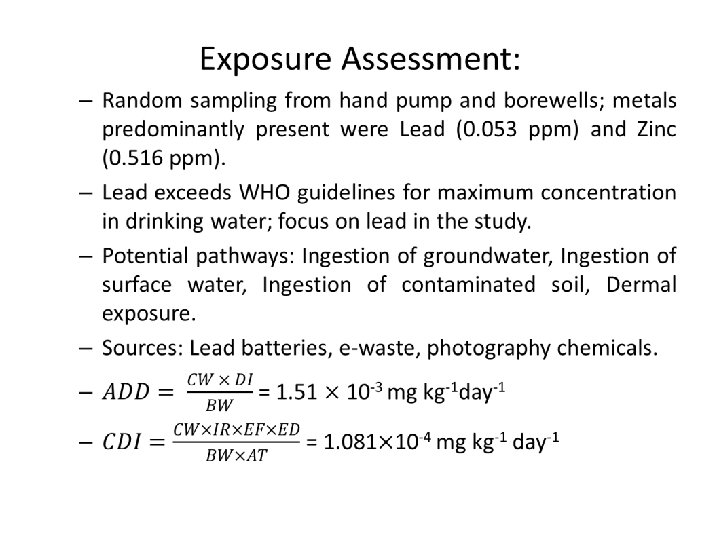
Introduction • Bhalaswa Landfill: – North Eastern part of Delhi – 21. 06 acres – Unlined, so hazardous leachate situation – 2200 tonnes of waste per day • Health Hazards: – Leachate contaminated groundwater, used for consumption without proper treatment – Focus of this study: Heavy metals • Methodology: – Reviewed research papers on landfills & heavy metals – Study by “Bhalaswa Lok Shakti Manch”; chose Zinc and Lead
Hazard Identification: – Lead: • Affects children more than adults: reduced IQ, stunted growth, impaired hearing, kidney damage, death. • Among adults: fertility problems, nerve disorders, muscle pain, memory problems, nausea, diarrhoea, weight loss, gastrointestinal disorders. • Lack of studies to document its carcinogenic effects. – Zinc: • Indirectly causes copper deficiency, leading to anaemic symptoms, like fatigue and weakness. • Irritates the intestinal tract, causing nausea, vomiting, diarrhoea, appetite loss, fever, loss of consciousness.
Risk Characterization: Zones Radial Distance (in metres) Pb Maximum Concentration (mg/L) Zone I 0 -2520 m 0. 053 Zone II 2520 -3740 m 0. 027 Zone III Beyond 3740 m ND Zones Non-Carcinogenic Risk (HQ) Carcinogenic Risk Lead Acetate Lead Sub-acetate Decision Zone I 5. 3 Risk Zone II 2. 7 Risk Zone III NA NA NA No Risk
Risk Management and Communication: Risk management Step Initiation Preliminary analysis Risk Estimation Risk Evaluation Risk Communication Task Stakeholder identification Issue identification and familiarity Involves Exposure Assessment Communication of results with stakeholders Assess stakeholders perception of risk Create awareness programmes Informing stakeholder of benefits, cost and new risk associated Risk Control Evaluate acceptance of control Trade off possibility Monitoring Ensure implementation of communication strategies Regular monitoring of hazards
RISK ASSESMENT ON MINAMATA DISEASE (JAPAN) BY DEVENDER KUMAR AND GROUP MEMBERS.
STEPS FOLLOWED DURING RISK ASSESMENT. • CAUSE OF MINAMATA DISEASE WAS METHYL MERCURY POISIONING IN MINAMATA BAY IN JAPAN AND RESULTS IN MINAMATA DISEASE TO LACALITY PEOPLE. • 1. - HAZARD IDENTIFICATION : - SINCE IT WAS OFFICIALLY DISCOVERED IN 1956 THAT DANGEREOUS MINAMATA DISEASE WAS CAUSED BY METHYL MERCURY POISIONING AND NEEDS A WAY TO COME OUT. • SO THERE WAS NO ISSUE OF IDENTIFICATION OF HAZARD CAUSED BY METHYL MERCURY POISIONING. • THERE WAS TOTAL OF APPROX. 2000 PATIENTS WERE IDENTIFIED AND LATOR ON THAT WAS CONTINUED BECAUSE OF UN AWARENESS OF THEIR GOVERNMENT. • 2. EXPOSURE ASSESMENT: - ACCORDING TO AVAILABLE DATA AROUND 67% LOCALITY PEOPLE WAS INFECTED. SO ON AN AVERAGE 65% TIME IN A YEAR POPULATION WAS IN EXPOSURE OF METHYL MERCURY.
DOSE RESPONSE ASSESSMENT The influence of age and sex on the threshold dose of mercury in Minamata disease was studied by dose-response analysis based on mercury concentrations in hair obtained mainly from adults living near the Agano River at the beginning of Niigata Minamata disease outbreak in 1965. • The subjects were 174 male and 694 female inhabitants of polluted areas including 55 males and 66 females officially recognized as Minamata disease patients. • Symptoms were ataxia, numbness in the hands and feet, general muscle weakness, narrowing of the field of vision and damage to hearing and speech. In extreme cases, insanity, paralysis, coma and death follow within weeks of the onset of symptoms. A congenital form of the disease can also affect foetuses in the womb. • One-compartment model is widely used in the EPA for the following reasons: 1 Methylmercury exposure via foods is continuous and relatively stable. 2 Methylmercury is not unevenly distributed to a specific organ in the body. 3 Methylmercury is difficult to metabolize (into inorganic compounds) in the body •
ONE COMPARTMENT MODEL Daily methylmercury intake d (μg/kg bw/day), which becomes C (the blood mercury level) (μg/L) in the steady state, is calculated using the following formula: Maternal daily methylmercury intake: d (μg/kg bw/day) d =C × b × V/A × f × bw • In this b = elimination rate constant= 0. 014 per day bw = body weight =60 kg V = blood volume= 0. 09× 60 liters A = fraction of the dose absorbed=0. 95 f = the absorbed fraction distributed to the blood =0. 05 • 10 ppm was taken as the NOAEL and the Rf. D came out to be 2. 0μg/kg bw/week of Hg by using the following formula: Rf. D = NOAEL/VF 1*VF 2*…VFn where VF is the variance factor. • ONE COMPARTMENT MODEL IS FITTED TO ANALYSE IT. •
RISK MANAGEMENT AND COMMUNICATION • In order to understand the level or magnitude of risk associated with the disease and to create a clear risk perception, it’s good to evaluate it using the following major dimensions: 1. Catastrophic potential- Besides the direct damage to nature and people’s bodies, the damage brought to Minamata by pollution is incalculable. 2. Familiarity- Minamata Disease was reported by the Chisso Corporation Hospital as a strange disease of unknown cause, and was officially discovered in May, 1956. 3. Voluntariness- Since the disease reaches a human body with unconscious ingestion of Methyl mercury poisoned media(food and water), the infection is involuntary 4. Origin- As it is indicated before, the disease is caused by human actions or failures 5. Effects on future generations- Minamata disease is not a hereditary disease. If proper care is in place its effect on future generation is rare.
DIAGRAM SHOWING THE ENTRANCE OF MERCURY IN DAILY LIFE
VARIOUS CONTAMINANTS IN YAMUNA RIVER AND ITS RISK ASSESSMENT SREELAKSHMIBABU 2012 CEV 2267 (GROUP LEADER) KARISHMA BHATNAGAR 2012 CEV 2274 MEGHA KANOJE 2012 CEV 2283 SADAF NOORUDHEEN 2012 CEV 2279 BIKRAM SINGH 2012 CEV 2285
INTRODUCTION • The main objective – compare concentrations of metal contaminants present in the Yamuna water (Delhi) with the permissible limits & do risk assessment. • Area of study-Yamuna River between Wazirabad barrage and Okhla barrage because drains between them contribute 80 % of total pollution load. • The steps done -Hazard identification, exposure assessment, dose – response assessment, risk characterisation, risk
1. HAZARD IDENTIFICATION The metal concentrations in the specific region of Yamuna were obtained. NAME OF THE METAL Cadmium Nickel Copper Lead Cobalt Chromium Iron Manganese CONCENTRATION ND-0. 20 6. 42 -9. 90 6. 25 -16. 31 ND-0. 9 4. 40 -9. 96 18. 08 -34. 15 42 -68 62. 3 -84. 3
2. EXPOSURE ASSESSMENT • Possible exposure routes are: Ingestion: finished drinking water, Accidental ingestion during recreational activities, Food pathway: consumption of fishes, vegetables grown on the banks, River bathing and washing. • Exposed Population- blood lead level when LOCATION River Water Abstraction Use exposed to Yamuna bank area -8 times that in Abstraction(MLD) rural area. Wazirabad 1, 100 Drinking water Wazirabad to Okhla Stretch 5, 000 supply Irrigation and others
3. DOSE RESPONSE ASSESSMENT Chronic Daily Intake=(CW*IR*EF*ED)/(BW*AT); HQ>1 – risk present. METAL Cadmium Nickel Copper Lead Cobalt Reference HQ=CDI/R Dose f. D CDI (mg/kg/day) 0. 00085714 1. 71 0. 0005 3 0. 04242857 2. 12 0. 02 1 0. 0699 0. 0272 2. 57 0. 00385714 9. 64 0. 0004 3 0. 04268571 ND 4 Risk Yes Yes -
4. RISK COMMUNICATION AND RISK MANAGEMENT Risk Communication • Objective-Educating target audience, health professionals, municipal Corporation, improving the quality of information in public domain on the issue. • Methods-putting some hoardings near polluted zones, distributing pamphlets, brochure etc to people residing by the river. Risk Management • Risk assessors -Analyse are in terms of cost
THANK YOU
ENVIROMENTAL RISK ASSESSMENT (CEL 899) A REPORT ON “RISK ASSESSMENT ON BOMBAY HIGH OIL SPILL” Submitted by: Manish Bhardwaj 2011 AST 3530 Rahul Saini 2011 AST 3566 Amrendra Kumar 2011 AST 3564 Pawan Pal 2011 AST 3563 Rajeev K Singh 2011 AST 3572 Karanjeet Singh 2011 AST 3578
INTRODUCTION • Bombay high field discovered in 1974 and it is located in Arabian sea 160 km west of the Mumbai coast. • The oil operations are run by Oil & Natural gas Corporation. • The rupture in pipeline in Bombay high was on 17 may 1993 which results in spillage of crude oil. • The exact amount of oil spill is not known, thus spilling roughly expected 3000600 tonnes of oil into the sea. • Oil continued to leak out of the pipeline at the rate of around three barrels per minute.
Objectives : To identify immediate change if any in marine environmental quality of Murud in the event of pollution by petroleum hydrocarbon residue. Water samples were collected at different depths for dissolved-dispersed petroleum hydrocarbon residues (DPH) using Niskin water samplers All the water samples were analysed for their DPH by spectrofluorometry after preconcentration by hexane extraction.
Result The sizes of oil patches were estimated to vary between 1 x 0· 5 m to 10 x 2 m. Only onepatch of untreated oil (about 100 x 2 m) was observed Aerial survey carried out on 25 May however showedseveral oil patches of varying sizes drifting towards thecoast of Murud. Zanzira, south of Bombay. Table 1: : Comparison of data of floating tar ball and DPH concentration Variable Spill Area Normal Area Remarks Floating Tar ball 0 - 95. 82 0 -6 Increased 0. 19 – 3. 65 0. 003 – 0. 022 Increased (mg/m 2) DPH Concent. (mg/l)
Table 2: : Data on chl a, phaeophytin and primaryproductivity in the oil spill area. Variable Extinction Coeff. Spill Area Normal Area Max Min Mean SD 0. 12 0. 15 0. 14 0. 01 0. 09 0. 95 0. 36 0. 33 SURFACE WATER Chlorophyll a (mg/m 3) 0. 24 1. 78 0. 64 0. 07 0. 27 3. 18 1. 21 1. 1 Phaeophytin 1. 37 8. 32 3. 2 3 1. 39 12. 4 5. 44 4. 2 0. 79 4. 36 2. 58 32 4, 8 65. 5 23. 2 20. 4 (mg/m 3) 9. 3 Primary Productivity (mg. C/m 3/day) Zooplankton biomass 13. 1 100 19. 4 (mg/100 m) VERTICAL WATER COLUMN Chlorophyll a (mg/m 2) 3. 9 37. 4 14. 2 13. 6 10. 4 85 30. 9 24 Phaeophytin 21 190 77. 9 66 63. 7 407 152. 6 112 0. 29 0. 25 (mg/m 2) Primary Productivity (mg. C/m 2/day) 0. 19
Observational Impact Localized impacts in terms of decrease in its rate of primary productivity and changes in the composition of zooplankton were evident. The beach tar melted under the summer heat and percolated into the sand spreading the contamination at least up to 5 cm below surface.
CEL 899 -ENVIRONMENTAL RISK ASSESSMENT OF BHOPAL GAS TRAGEDY GUIDED BY SUBMITTED BY Dr. ARUN KUMAR RAVEEN PPATEL (ENTRY NO. -2012 CEW 2296) AMIT KUMAR VYAS (ENTRY NO. 2012 CEW 2289) PARAG AGRAWAL (ENTRY NO. -2012 CEW 2292) HARSHA YADAV (ENTRY NO. -2012 CEW 2297) DEPARTMENT OF CIVIL ENGINEERING INDIAN INSTITUTE OF TECHNOLOGY –DELHI NEW DELHI-110016
INTRODUCTION: • The incident took place in the mid night of 3 rd December 1984. It was one of the greatest industrial disaster ever happened. During the incident 40 tones of MIC ( methyl isocyanate ) and various products such as mono – methyl amine , hydrogen cyanide and other lethal gases were released from UNION CARBIDA CORPORATION pesticide factory in Bhopal, India which flooded the atmosphere of Bhopal. The immediate effects on the people due to the exposure were vomiting, headache, burning of lungs and searing in their eyes. Within 72 hours of the incident about 8, 000 people had died and total of 25, 000 have since died due the released gases. METHODOLOGY Hazard identification Exposure assessment Dose response assessment Risk characterization Risk communication
RESULTS • Effect On society: • After 28 years after the bhopal gas tragedy the victims continue to suffer from problems like mental retardation cerebral palasy and multiple disabilities. • Economically they became very week only 70% of the exposed population were earning minimal wages. • Ground water became polluted as tones of toxic substance are underlying under ground. • It was noticed that a large amount of heat was generated during the release of MIC. It is known that MIC reacts with moisture rapidly. In addition, MIC could have undergone a series of chemical reactions. • They are still carrying the load of the past hazzards on their shoulders.
METHODOLOGY • Hazard identification: During this disaster various gases like CO, HCL, CO 2, HCN, Mono Methyl Amine, MIC(methyl isocyanate) were released. Incident took place mainly due to release of MIC and its reaction products. Having such a pressure that it rises up to 33 meter from the ground. Due to prevailing wind and temperature conditions the gas was taken from release valve to the residential areas of the city. • Exposure assessment: . Initially it was due to respiratory tract and eyes, and for long term it was through the GI tract from ingestion of food and water. A number of contaminants still remain on site. So it would be difficult to link an illness specially to MIC leak exposure. The leak itself lasted for 90 minutes. However the gas remained in the area for many hours after the leak. Between 210 -270 min after the release of the gas, it mixed with the air, cooler and descended on the city still moving downwind.
. • Dose response: After lot of studies it has been found that MIC(methyl isocyanate) is of non-carcinogenic nature. Cal. EPA(California Environmental Protection Agency) calculated a chronic inhalation reference exposure level of 0. 001 milligrams per cubic meter (mg/m 3). Refrence limit/refrence dose: A chronic non-cancer Reference Exposure Level (REL) of 3. 6 x 10 -1 µg/m 3 is listed for methyl isocyanate in the California Air Pollution Control Officers Asociation. Symptoms may include cough, chest pain, shortness of breath, watery eyes, eye pain (particularly when exposed to light), profuse lid edema, and corneal ulcerations. Respiratory symptoms such as pulmonary edema and bronchial spasms may occur in immediate response to exposure or develop and progress in severity over a period of hours to days post-exposure.
. • Risk characterization: SEVERE EFFECTS: Initial effects of exposure were: Coughing, Vomiting, Severe eye irritation, Feeling of suffocation Acute symptoms were: -Burning in the respiratory tract and eyes, Blepharosphasm, Breathlessness, Stomach pains and vomiting. Causes of death were: Reflexogenic circulatory collapse, Pulmonary oedema, Tubular necrosis of kidney, Fatty degeneration of liver. • Risk management: It was suggested to people to close there windows and doors and spread the water to their floors and lay down on the floor. The State Government established a number of hospitals, clinics and mobile units in the gas-affected area to cure the victims.
CEL 899: Oil Spill Risk Assessment • • • Name Arnav Kumar Guha Samarpreet Singh Swaagat Das Dheeraj Chaudhary Govind Narain Neeraj Golhani Entry Number 2012 CEV 2268 2012 CEV 2270 2012 CEV 2275 2012 CEV 2284 2012 CEV 2280 2012 CEV 2281
Oil Spill Risk Assessment Introduction Oil spill is release of liquid petroleum, hydrocarbon into the ocean or coastal waters, due to human activity, mainly: • Sinking or leakage of oil carrying vessels or oil pipelines. • Countries at war • Illegal damping by industries • Terrorist activities • Natural disaster The oil spill basically covers the surface of water by a thick film and thereby • Effects the entire marine life • Fishes die, because they cannot breathe
Methodology Our study will focus on risk assessment due to oil spill and taking BP’s oil spill’s as a prime case example. The study will be having following steps: • Study of major oil spills • Establishing the system Boundaries • Risk assessment through : – Hazard Identification – Frequency Analysis – Consequence Analysis – Risk Evaluation and Calculations • Suggesting mitigation strategies
Fault Tree of a oil spill Risk Perception Psychometric Map Location of risk in factor space (based on Slovic et. al)
Frequency Analysis Frequency analysis is important as it enables us to estimate the probability of another oil spill based on trends of spill accidents in time for example the following graph [Source : www. itopf. com/stats. html ] shows that in the coming decades the number of spill will be less than 7. 3 spill per ten year: Rank Figure 3: International Oil spill trends 1 2 3 Oil spill probabi per lty of decade exceedi ng n oil spills per decade 24. 1 0. 25 8. 8 0. 20 7. 3 0. 17
Risk Communication • • • The main part of risk communication includes bridging the gap between the actual facts and scientific revelations with the perception of the people to be affected. In case of oil spills, the risk communication should primarily include: Making the people aware of the exact scale and circle of loss due to the mishap. Analysing and discussing the future related occurrences (if any). Making the communicators aware of the various standard allowable guidelines related to the spill, as led down by the concerned authorities. Circulating proper preventive suggestions and controlling measures which ought to be taken by the audience on their own and also helping them implementing those techniques. Assuring the people of the measures being taken on behalf of the organization as a whole in order to counter act and minimize the losses, if possible. Making publis certain important figures related to the mishap like– – – Origin of the spill Cause(s) and there proper and understandable analysis. Degree of occurrence Areas most adversely affected Maximum people and property expected to have been affected
Term Paper Report: Environmental Risk Assessment (CEL 899) Health Impacts & Risk Assessment of Cutting-fluids and Lubricating oil By Arun Unnikrishnan 2012 MEZ 8250
Methodology Followed Ø For the health impact for the direct body contact with cutting fluids, the scientific approach descried on the Greba risk assessment hand out was used. Steps: 1. Hazard identification— Defining the hazard and nature of the harm, identifying a chemical contaminant, and documenting its toxic effects on metal workers. 2. Exposure assessment— Determining the concentration of a contaminating agent in the environment and estimating its rate of intake 3. Dose–response assessment— Quantifying the adverse effects arising from exposure to a hazardous agent based on the degree of exposure 4. Risk characterization— Estimating the potential impact of a hazard based on the severity of its effects and the amount of exposure Ø Systems analysis: - Fault tree analysis and Reliability block diagram. Ø Risk Zonation
• Hazard Identification : The major detrimental effects of the metal working fluids were taken from the article published by NIOSH in 1998. • Direct exposure measurement of metal working fluids on skin and through inhalation: Data were taken from B van Wendel de Joode, et al. Three methods were used for this study conducted on 80 metal workers. 1. Video imaging technique for assessing dermal Exposure (VITAE) 2. Surrogate Skin Technique (Pads method ) 3. Dermal Exposure Assessment Method (DREAM)( Semi- Quantitative) The average exposure concentration on the Skin from VITAE method was found to be 1354 mg/hr and from Pads method it was 3706 mg/hr. DREAM as a pessimistic method came up with the value 14985 mg/hr(which was used for this paper) and the air borne inhalation rate was found to be 0. 63 mg/m 3.
• Dose–response assessment and risk characterization: As a general approach Compound A has been identified having a concentration of 2% in the Metal working fluid. • Average daily dose = 8 hrs* 14985 Mg/hr* 0. 02/ 70 kg= 34. 25 mg/kg/day • Hazard quotient (HQ) = ADD/Rfd= = 34. 25 (mg/kg/day)/ 2(mg/kg/day)= 17. 125 • The incremental risk of cancer=[(8 hrs* 14985 Mg/hr* 0. 02*250*5 years)/ (70 kg*365* 70 years)] * 1(mg/kg/day)-1 = 1. 68 • The risk of the aerosol mist for a worker = 0. 63 mg/m 3/0. 4 mg/m 3=1. 57 (0. 4 mg/m 3 is the allowable concentration) • Risk Management There are four ways for managing these risks were proposed by NIOSH: (1) safety and health training, (2) worksite analysis, (3) hazard prevention and control, and (4) medical monitoring of exposed workers.
SYSTEMS ANALYSIS Fault Tree The failure probability of the top event P = (P 1* P 2* P 3)+( P 4* P 5)+ ( P 7+ P 8)+ (P 9* P 10)+ (P 11* P 12)+( P 6)
Reliability Block Diagram So the overall reliability of the system S = (1 -S 1)(1 -S 2)(1 -S 3))*(1 -(1 -S 4)(1 -S 5))*S 7*S 8*(1 -(1 -S 9)(1 -S 10))*(1 -(1 -S 11)(1 -S 12))*S 6 S = (1 -P 1*P 2*P 3) *(1 -P 4*P 5)(1 -P 6)* (1 -P 7)* (1 -P 8)* (1 -P 9*P 10)* (1 -P 11*P 12) Risk Zonation Zone I : cutting zone where the cutting fluid is applied as spraying, dropping or flooding Zone II equipments, helping and machining tools, clamping devices, material handling devices, storage devises etc : Zone III : far away area from cutting zone, other departments in the shop, offices etc
RISK ASSESSMENT OF ENDOSULFAN ISSUE IN KERALA GAYATHRI KRISHNA K (CEW 122291) PONNI MARIET GEORGE (CEW 122293) VILAKSHNA PARMAR (CEW 122287) SANDHYA GUPTA (CEV 122276) SOWJANYA UPPULURI (CEW 122288) SYEEDAH RAAZIA (CEW 122290)
Introduction • Use of endosulphan in Kasaragod district of Kerala. • Endosulfan is a pesticide used to control insects on food crops. • It is a chlorinated pesticide (C 9 H 6 Cl 6 O 3 S) of the cyclodiene group. • It has two stereo isomers alpha-endosulfan and betaendosulfan in an approximate ratio of 70: 30. • Endosulfan was aerially sprayed for period of 25 years by Plantation Corporation of Kerala (PCK). • Health effects: - deaths, retarded growth and mental illness. • Effects on animals, biodiversity and ecology of the area.
Methodology • • • 1 - Hazard Identification 2 - Exposure Assessment 3 - Dose Response Assessment 4 - Risk Characterization 5 - Risk Management 6 - Risk Communication
RESULTS
RESULTS
Risk management and communication • Risk management includes social, economic, political and engineering issues. • management system should be such that unacceptable risk is brought to acceptable risk with alternatives and minimal cost. • Hoardings, Pamphlet, Radio telecast, Programs on national television, Newspapers and articles, Working with the media, Social service schemes.
ENVIRONMENT RISK ASSESSMENT OF RELEASED RADIONUCLEOTIDES DUE TO CHERNOBYL ACCIDENT GROUP MEMBERS: SAUJANYA KUMAR SAHU 2012 CEW 2286 ARVIND KUMAR BAIRWA 2012 CEW 2302 RAHUL GAUTAM 2012 CEW 2301
Outline of Presentation • Introduction • Environmental Risk Assessment – – – Hazard Identification Exposure Assessment Dose Response Assessment Risk Characterization Risk Management and Communication • Analysis – Event Tree – Fault Tree – Reliability Block Diagram • Conclusion • Reference
Chernobyl Nuclear Disaster Introduction • Occurred on 26 th April 1986 at reactor No. 4 of nuclear power plant at Chernobyl. • The operators switched off an important control system -> reactor reached unstable state -> A sudden power surge -> steam explosion -> rupture of reactor vessel -> destruction of reactor core and reactor building. • Intense graphite fire -> release of radioactive materials like 131 I and 137 Cs • Regions affected - Belarus, Russia and Ukraine.
Environmental Risk Assessment of Chernobyl Nuclear Disaster Step 1: Hazard Identification: – Dose of 131 Iand 137 Cs estimated to be around 1, 760 and 5 PBq, respectively (1 PBq = 1015 Bq). Doses estimated on basis of environmental and thyroid or body measurement – Main areas of contamination with 137 Cs deposition density > 37 k. Bq m 2(1 Ci km 2) : Belarus, the Russian Federation and Ukraine Step 2 : Exposure Assessment : – Pathways • Ground – Consumption of leafy vegetable(short lived 131 I) – deposited on soil, contaminated milk, meat and potatoes ( for long lived 137 Cs • Aquatic – Runoff of surface layers of soil in the watershed to water bodies containing radioactive substance
Environmental Risk Assessment… Step 3 : Dose response – External exposure where Da= the absorbed dose in air ; Fk=the conversion factor, Li, k=location factor ; Bi, k=the occupancy factor, – Internal exposure where D =the thyroid dose; n = the age of the individual (years); K = scaling parameter Step 4 : Risk Characterization – – group 1: persons engaged in the recovery operations group 2, persons evacuated from contaminated areas (131 Cs deposition >1, 480 k. Bq m 2) group 3, residents of highly contaminated areas (131 Cs deposition >555 k. Bqm 2) group 4, children born after the accident registered above Step 5 : Risk Management and Communication – Compulsory registration and continuous health monitoring of recovery operation workers – Systematic linkage of the Chernobyl registry population data with existing mortality and/or cancer incidence registries
Event Tree for Release of Nucleotides at Chernobyl Disaster Preventive Aids present Manual Flaws Improper Maintenance p 3 No Release S Release F No Release S p 4 Preventive Aids absent 1 -p 4 p 1 Operator turned off important switch 1 -p 3 Control Systems working p 5 Control Systems not working Sudden Power Surge 1 -p 5 Building not damaged Reaction vessel ruptured p 7 No Release S Release F p 6 Building damaged 1 -p 6 Design Flaws Outcome Reactor Core destroyed p 8 Building not damaged p 9 Reactor Core intact 1 -p 8 Building damaged 1 -p 9 p 2 Reaction vessel intact (not ruptured) 1 -p 7 No Flaws 1 -p 2 S S
Fault Tree for Release of Nucleotides at Chernobyl Disaster Release of Radio nuclides OR Improper Maintenance Reaction Core Destroyed Control System failure AND Prevention aids absent Sudden Power Surge Design Flaws Sudden Power surge AND Manual Flaws Reaction building damage Control system not working properly Manual Flaws Rupture of reactor vessel Operator turned off important switch Reaction building damage
Reliability Block Diagram of Chernobyl Nuclear Power Plant No manual flaws (A`) Proper Maintenance (B`) Preventive aids present (C`) Here A : Failure event A` : No Manual Flaws B` : Proper Maintenance C` : Preventive Aids Present D` : Operator didn’t turn off switch E` : Building not damaged Operator didn't turn off imp. Switch (D`) Control system working (E`) Building not damaged (F`) No design Flaws (G`) Reactor vessel intact (H`) Reactor core intact (I`) A` : Success event F` : Building not damaged G` : No Design Flaws H` : Reactor vessel intact I` : Reactor core intact
Conclusion • accident at the Chernobyl nuclear power plant in 1986, a tragic event. Many lost lives and still a many suffering from radiation hazards. • necessary to expand research of long term effects of the acute radiation sickness to support survivors. • Its findings ; methods developed to combat and manage radiation hazards can be readily applicable to disaster of similar kind, e. g. Fukushima Diiachi nuclear disaster • Need to generate positive public opinion about harnessing of clean nuclear energy.
Reference • www. unscear. org/unscrea • http: //www. who. int/ionizing_radiation/chernobyl/backgrounder/en/inde x. html • http: //www. worldnuclear. org/uploaded. Files/org/WNA_Personal_Perspectives/jaworowski_ chernobyl. pdf • http: //en. wikipedia. org/wiki/Chernobyl_disaster • http: //www. davistownmuseum. org/cbm/Rad 7 b. html
MICROBIAL RISK ASSESSMENT OF SELECTED SEWAGE TREATMENT PLANTS IN NCR REGION REPORT BY: TROPITA PIPLAI- 2012 CEZ 8079 AGNES SHIJI JOY-2011 CEV 2845 SANGEETA PEGU-2011 CEV 2865 MALAVIKA VARMA-2011 CEU 2873 KAVITA GANESH-2011 CHE 3091
OVERVIEW AND SCOPE An analysis was done to study and quantify the Microbial Risk Analysis of the selected Sewage Treatment Plants (STP’s) based on the five step methodology. The objective of this study is to perform a • Microbial Risk Analysis of the selected Sewage Treatment Plants • Identification and Solutions applicable to these risks • Management and Communication of these risk effectively The limitation of our study we have conducted on are • Of the many pathogens only 3 commonly found pathogens were considered • Ingestion route was considered as the mode of infection • The effects was considered on specific sub populations • Awareness study was evaluated on students • Delhi was taken as the study area
HAZARD IDENTIFICATION Pathogens selected: • Salmonella • Shigella • E. coli Site-Description: Two Sewage Treatment Plants has been selected for our study having different treatment methods. • NOIDA: It is a Sequential Batch Reactor (SBR) based STP having a capacity of 27 MLD. It was started in March 2012 and its source of water in the treatment plant is completely domestic. • VASANT KUNJ: It is based upon Extended Aeration Process and has a capacity of 22. 7 mld and flow of 18. 16 mld. The source of water in the treatment plant is completely domestic.
EXPOSURE ASSESSMENT The reference risks of the micro organisms which we are studying, as per the U. S. EPA are: • Salmonella – 0. 0001; Shigella – 0. 0001; E. coli – 0. 0001 The Hazard Quotient is calculated by dividing the Annual risk calculated (both Exp and Poisson) by the reference risks listed by US EPA. If the Hazard Quotient is above 1, a definite step has to be taken towards improving the whole scenario as the situation is definitely at risk. If it less than 1, then the situation is under control and not at risk. The most common pathways for these pathogens to enter the human body are ingestion, inhalation and dermal, can be listed as: S. No Target Subpopulation Ingestion rate (m. L/day) Frequency (times/year) 1 Workers working in 6 260 WWTP’s 2 Children Playing 6 3 3 Recreational activities 50 10 4 Exposure to leafy vegetables 3 15
DOSE-RESPONSE ASSESSMENT For estimation of Risk on a daily basis, the following mathematical models were used. They are: • Exponential : p(daily) = 1 - (-exp r*N) • Poisson: p(daily) = 1 -(1+N) –α β After estimating the daily risk, the annual risk was calculated using the following equation: • RISK ANNUAL = 1 -(1 -Pdaily)Exposure time TARGET SUBPOPULATION Workers working in HAZARD QUOTIENT SALMONELLA SHIGELLA E. COLI 52. 26 4. 03 4. 15 Children Playing 2. 01 0. 04 Recreational activities 25. 15 1. 29 1. 33 0. 119 WWTP’s Exposure to leafy vegetables
RISK CHARACTERIZATION, MANAGEMENT AND COMMUNICATION Risk Characterization From the previous table it can be seen that, • “Workers working in WWTP’s”; “Children playing”; “Recreational Activities” are at RISK from SALMONELLA. • “Workers working in WWTP’s”; “Recreational Activities” are at RISK from SHIGELLA. • “Workers working in WWTP’s”; “Recreational Activities” are at RISK from E. COLI. • Also Ingestion through swimming (Recreation) case needs to be addressed with top priority for both Salmonella and Shigella as it poses maximum risk the concern population. Risk Communication and Management Based on a student survey conducted in the campus, • Most of the students rank all the above diseases between 2 to 6. 5 and considered as dread. • As expected the most fimiliar disease was diarrhoea. • Unlike expected most of the students did not consideres Hepatitis as a dreadful disease. • Most of the students were fimiliar with urinary tract infection and did not considered it very dreadful. • People had very little knowledge about Salmonellas and Neonatal meningitis. And considered these diseases as dreadful.
REFERENCES……. . • • • • Pant , A. and Mittal, A. K. (2008). “New protocol for the enumeration of Salmonella and Shigella from wastewater”. J. Environ. Engg. , 134(3), 222. Pant, A. and Mittal , A. K. (2007). “Monitoring of pathogenecity of effluents from the UASB based sewage treatment plant”. Environ Monit Assess, 133, 43. Jamwala P, Mittal A K. , (2009). “Reuse of treated sewage in Delhi city: Microbial evaluation of STPs and reuse options”. Resources, Conservation and Recycling , 54 (2010) 211– 221 Hencha K. R, Bissonnettea G. K, , Sexstonea A. J, Colemanb J. G, Garbuttb K, . Skousena J. G. , (2002) “Fate of physical, chemical, and microbial contaminants in domestic wastewater following treatment by small constructed wetlands” : Water Research 37 (2003) 921– 927 Mara D D, Sleigh P. A, Blumenthal U. J and Carr R. M (2007); “Health risks in wastewater irrigation: Comparing estimates from quantitative microbial risk analyses and epidemiological studies” : Journal of Water and Health (2007) doi: 10. 21. 66/wh. 2006. 055 Y. Karamoko, K. Ibenyassine, M. M. Ennaji, B. Anajjar, R. Ait Mhand, M. Chouibani, (2007) “Bacterial Pathogens Recovered from Vegetables Irrigated by Wastewater in Morocco", Journal of Environmental Health, June 2007 Sadovski A Y, Fattal B, Goldberg D, Katzenelson E and Shuval H I (1978); “High levels of microbial contamination of vegetables irrigated with wastewater by the drip method”, Appl Environ Microbiol. 1978 December; 36(6): 824– 830. Clemens P. L. , (1990); “Event Tree and Fault Tree Analysis”, Sverdrup, 2 nd Edition. Ahmed AM, Furuta K, Shimomura K, Kasama Y, Shimamoto. T. Genetic characterization of multidrug resistance in Shigella spp. Japan. J Med Microbiol 2006; 55 : 1685 -91. Calamusa A, Verani M, Carducci A, ” Communication of Microbial Risk to Workers in a Wastewater Treatment Plant”, 2008 AND MANY MORE…………. .