Disproportional Difference Data Analysis Sonia Dominguez Administrative Supervisory






- Slides: 50
Disproportional Difference Data Analysis Sonia Dominguez Administrative Supervisory, Austin ISD sonia. dominguez@austinisd. org Caitlin Hamrock Senior Research Advisor, E 3 Alliance chamrock@e 3 alliance. org Susan Dawson President, E 3 Alliance sdawson@e 3 alliance. org © 2016 E 3 Alliance
Is your community making a concerted effort to eliminate equity gaps? How long have you been working to eliminate equity gaps? R Quickly capture the top few things your community is doing to address equity gaps © 2016 E 3 Alliance 2
Truthfully, would you say your community has made substantial and measurable progress in eliminating equity gaps? © 2016 E 3 Alliance 3
Disproportional Difference Data Analysis Eliminating the Gap Sonia Dominguez Administrative Supervisory, Austin ISD sonia. dominguez@austinisd. org Caitlin Hamrock Senior Research Advisor, E 3 Alliance chamrock@e 3 alliance. org Susan Dawson President, E 3 Alliance sdawson@e 3 alliance. org © 2016 E 3 Alliance
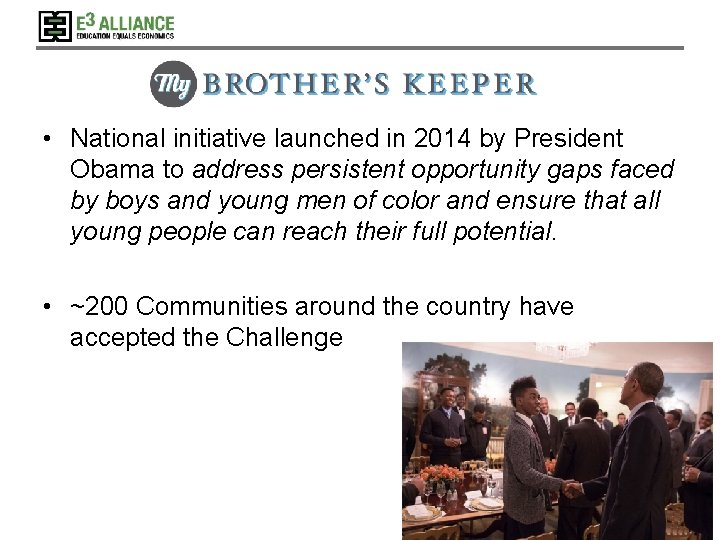
• National initiative launched in 2014 by President Obama to address persistent opportunity gaps faced by boys and young men of color and ensure that all young people can reach their full potential. • ~200 Communities around the country have accepted the Challenge © 2016 E 3 Alliance 5
• Vision: Become a national model for boosting academic achievement, enhancing health and well-being and elevating the lifetime prosperity for young boys and men of color. • Committee Structure: 1. 2. 3. 4. 5. 6. Ensure all children enter school ready & read at grade level by 3 rd grade Ensure middle school students have advanced opportunities by 8 th grade Ensure all youth graduate high school college & career ready Ensure all youth complete post-secondary and are employed Ensure males of color have equitable access to healthcare Ensure violence to and by males of color is prevented and increase 6 second chances © 2016 E 3 Alliance
Pick Your Focus Topic We have six committees on our MBK Team looking at equity gaps for young men of color. What topic area do you want focus on today? Capture it on your worksheet W © 2016 E 3 Alliance 7
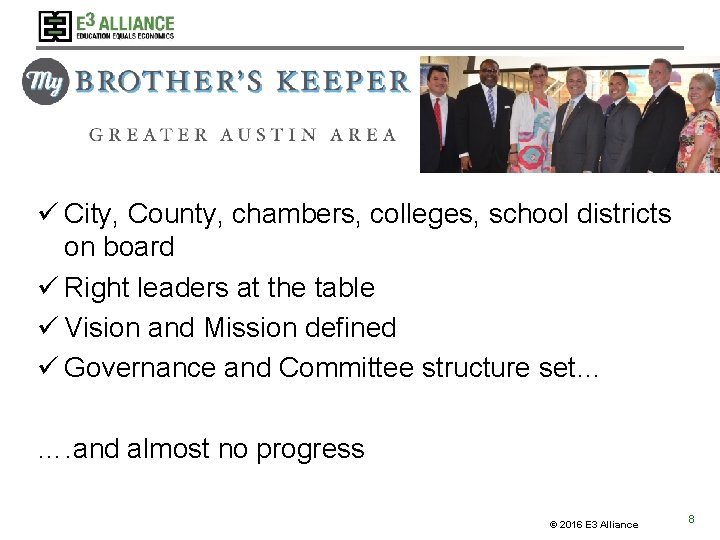
ü City, County, chambers, colleges, school districts on board ü Right leaders at the table ü Vision and Mission defined ü Governance and Committee structure set… …. and almost no progress © 2016 E 3 Alliance 8
Eliminating the Gap Data Analysis: WHY? 1. Provide Focus: use objective data analysis to identify those metrics that will make the biggest difference in closing gaps for young men of color A. Choose range of metrics at each level of the education pipeline B. Determine disproportional difference for all metrics C. ID 2 focus metrics based on disproportional difference & other factors 2. Support Action: Provide comparative data sets to help institutions and our community move the needle on these metrics A. What factor(s) most influence metric? (Gender/ethnicity/income) B. Which schools are bright spots across the region? C. Provide districts data to compare schools and focus actions © 2016 E 3 Alliance 9
Data Analysis Goal 1 1. Provide Focus: use objective data analysis to identify those metrics that will make the biggest difference in closing gaps for young men of color © 2016 E 3 Alliance 10
Disproportional Difference Comparisons • Each Committee chose a range of 6 -10 metrics at that level of the education pipeline of interest for our MBK populations • Every metric calculated by income (low income or not), Gender (male or female), and Ethnicity (Black, Hispanic, White, Asian) – 16 total categories • “Target Population”: weighted average of Black and Hispanic low income males • “Comparison Population”: White, non-low income females • Disproportional difference is the percentage point difference between the target and comparison groups © 2016 E 3 Alliance 11
Eliminating the Gap Data Analysis: 1. Provide Focus: use objective data analysis to identify those metrics that will make the biggest difference in closing gaps for young men of color A. Choose range of metrics at each level of the education pipeline © 2016 E 3 Alliance 12
Which education metrics would you need to look at to really understand gaps? Capture the main metrics you think you would need to understand gaps? W © 2016 E 3 Alliance 13
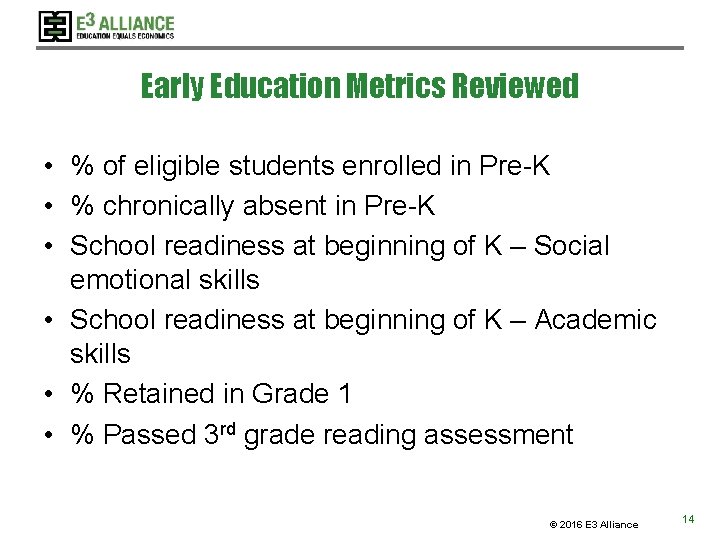
Early Education Metrics Reviewed • % of eligible students enrolled in Pre-K • % chronically absent in Pre-K • School readiness at beginning of K – Social emotional skills • School readiness at beginning of K – Academic skills • % Retained in Grade 1 • % Passed 3 rd grade reading assessment © 2016 E 3 Alliance 14
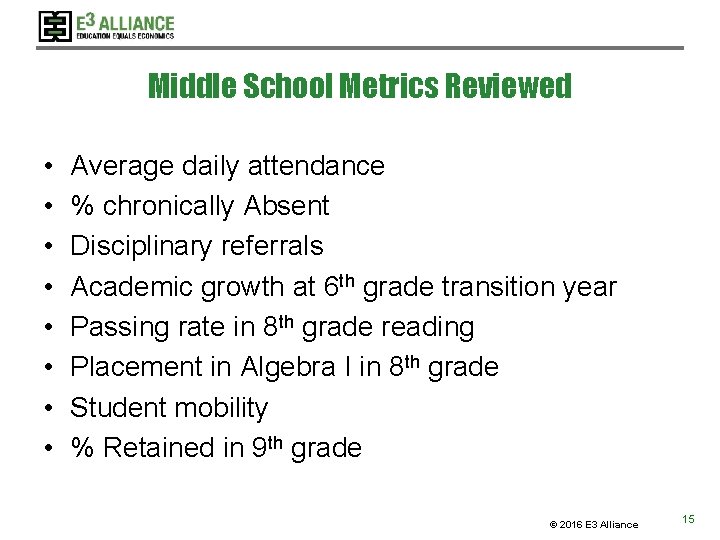
Middle School Metrics Reviewed • • Average daily attendance % chronically Absent Disciplinary referrals Academic growth at 6 th grade transition year Passing rate in 8 th grade reading Placement in Algebra I in 8 th grade Student mobility % Retained in 9 th grade © 2016 E 3 Alliance 15
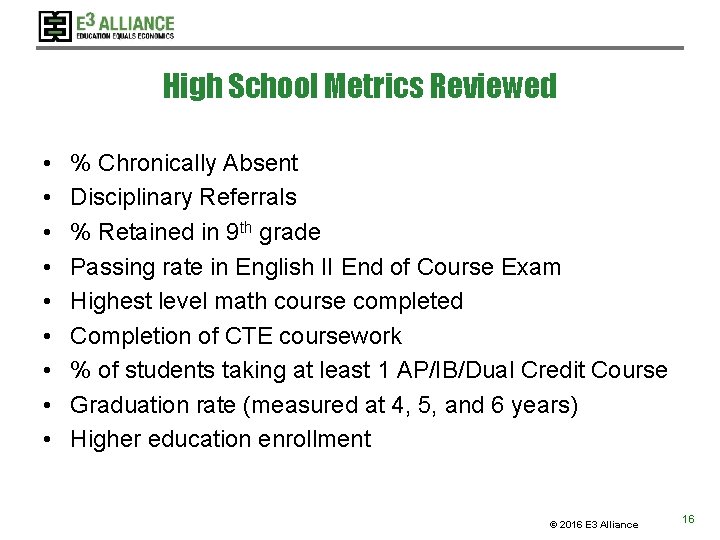
High School Metrics Reviewed • • • % Chronically Absent Disciplinary Referrals % Retained in 9 th grade Passing rate in English II End of Course Exam Highest level math course completed Completion of CTE coursework % of students taking at least 1 AP/IB/Dual Credit Course Graduation rate (measured at 4, 5, and 6 years) Higher education enrollment © 2016 E 3 Alliance 16
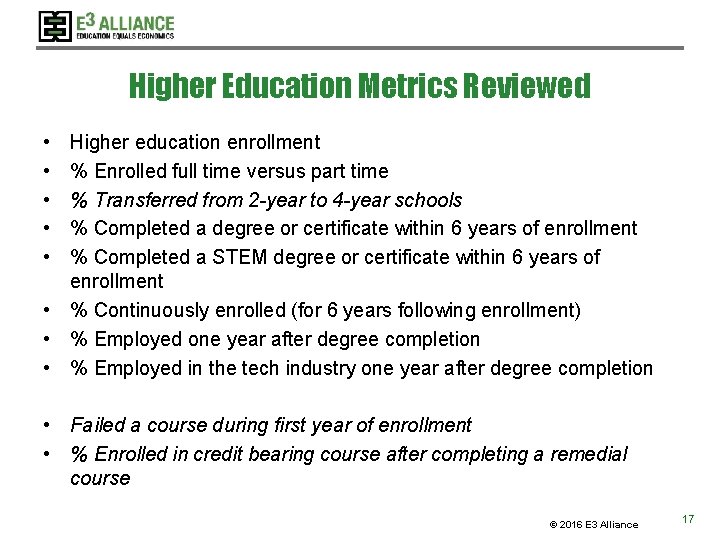
Higher Education Metrics Reviewed • • • Higher education enrollment % Enrolled full time versus part time % Transferred from 2 -year to 4 -year schools % Completed a degree or certificate within 6 years of enrollment % Completed a STEM degree or certificate within 6 years of enrollment • % Continuously enrolled (for 6 years following enrollment) • % Employed one year after degree completion • % Employed in the tech industry one year after degree completion • Failed a course during first year of enrollment • % Enrolled in credit bearing course after completing a remedial course © 2016 E 3 Alliance 17
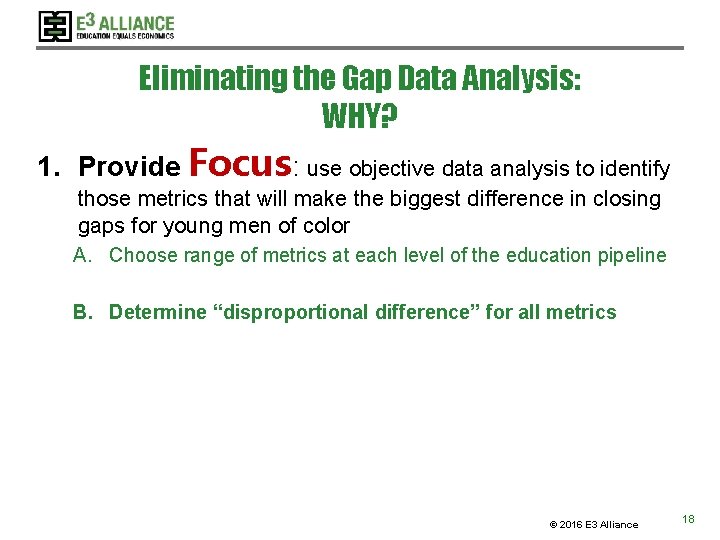
Eliminating the Gap Data Analysis: WHY? 1. Provide Focus: use objective data analysis to identify those metrics that will make the biggest difference in closing gaps for young men of color A. Choose range of metrics at each level of the education pipeline B. Determine “disproportional difference” for all metrics © 2016 E 3 Alliance 18
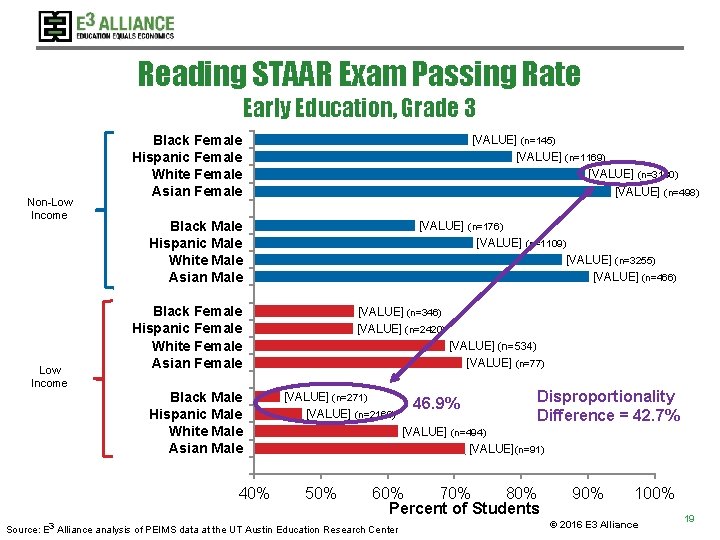
Reading STAAR Exam Passing Rate Early Education, Grade 3 Non-Low Income Black Female Hispanic Female White Female Asian Female [VALUE] (n=145) [VALUE] (n=1169) [VALUE] (n=3180) [VALUE] (n=498) Black Male Hispanic Male White Male Asian Male [VALUE] (n=176) [VALUE] (n=1109) [VALUE] (n=3255) [VALUE] (n=466) Black Female Hispanic Female White Female Asian Female Black Male Hispanic Male White Male Asian Male 40% [VALUE] (n=346) [VALUE] (n=2420) [VALUE] (n=534) [VALUE] (n=77) [VALUE] (n=271) [VALUE] (n=2160) 46. 9% Disproportionality Difference = 42. 7% [VALUE] (n=494) [VALUE](n=91) 50% 60% 70% 80% Percent of Students Source: E 3 Alliance analysis of PEIMS data at the UT Austin Education Research Center 90% 100% © 2016 E 3 Alliance 19
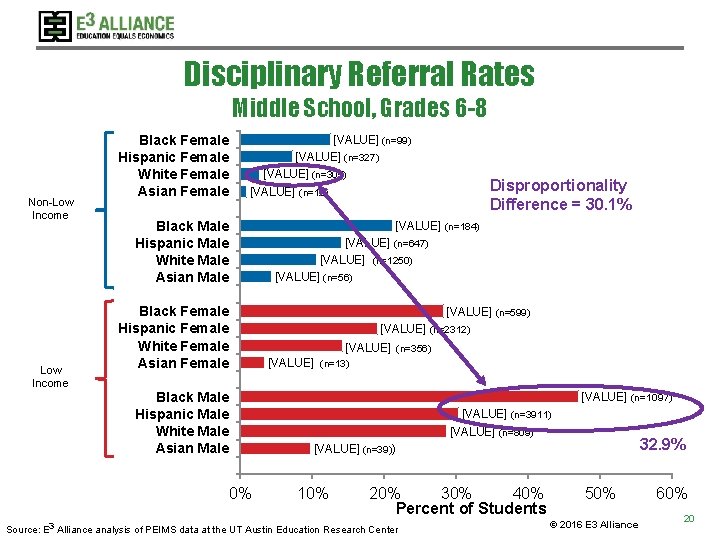
Disciplinary Referral Rates Middle School, Grades 6 -8 Non-Low Income Black Female Hispanic Female White Female Asian Female [VALUE] (n=99) [VALUE] (n=327) [VALUE] (n=305) [VALUE] (n=12) Black Male Hispanic Male White Male Asian Male Disproportionality Difference = 30. 1% [VALUE] (n=184) [VALUE] (n=647) [VALUE] (n=1250) [VALUE] (n=56) Black Female Hispanic Female White Female Asian Female [VALUE] (n=599) [VALUE] (n=2312) [VALUE] (n=356) [VALUE] (n=13) Black Male Hispanic Male White Male Asian Male [VALUE] (n=1097) [VALUE] (n=3911) [VALUE] (n=809) 32. 9% [VALUE] (n=39)) 0% 10% 20% 30% 40% Percent of Students Source: E 3 Alliance analysis of PEIMS data at the UT Austin Education Research Center 50% © 2016 E 3 Alliance 60% 20
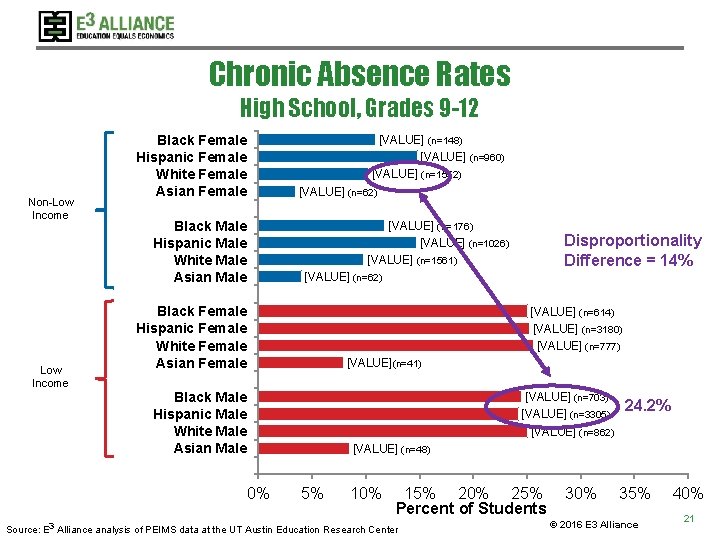
Chronic Absence Rates High School, Grades 9 -12 Non-Low Income Black Female Hispanic Female White Female Asian Female [VALUE] (n=148) [VALUE] (n=960) [VALUE] (n=1552) [VALUE] (n=62) Black Male Hispanic Male White Male Asian Male [VALUE] (n=176) [VALUE] (n=1026) [VALUE] (n=1561) Disproportionality Difference = 14% [VALUE] (n=62) Black Female Hispanic Female White Female Asian Female [VALUE] (n=614) [VALUE] (n=3180) [VALUE] (n=777) [VALUE](n=41) Black Male Hispanic Male White Male Asian Male [VALUE] (n=703) [VALUE] (n=3305) [VALUE] (n=862) 24. 2% [VALUE] (n=48) 0% 5% 10% 15% 20% 25% Percent of Students Source: E 3 Alliance analysis of PEIMS data at the UT Austin Education Research Center 30% 35% © 2016 E 3 Alliance 40% 21
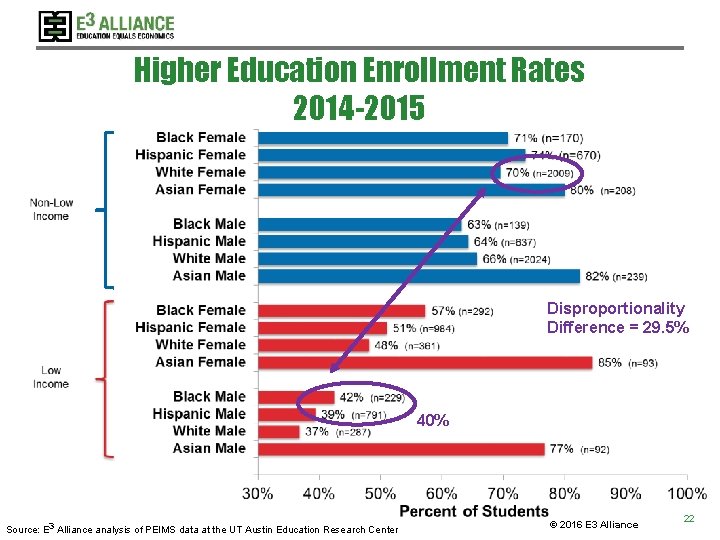
Higher Education Enrollment Rates 2014 -2015 Disproportionality Difference = 29. 5% 40% Source: E 3 Alliance analysis of PEIMS data at the UT Austin Education Research Center © 2016 E 3 Alliance 22
R Take a few moments and reflect on the data – what does it tell you? What “ah hah’s do you have? © 2016 E 3 Alliance 23
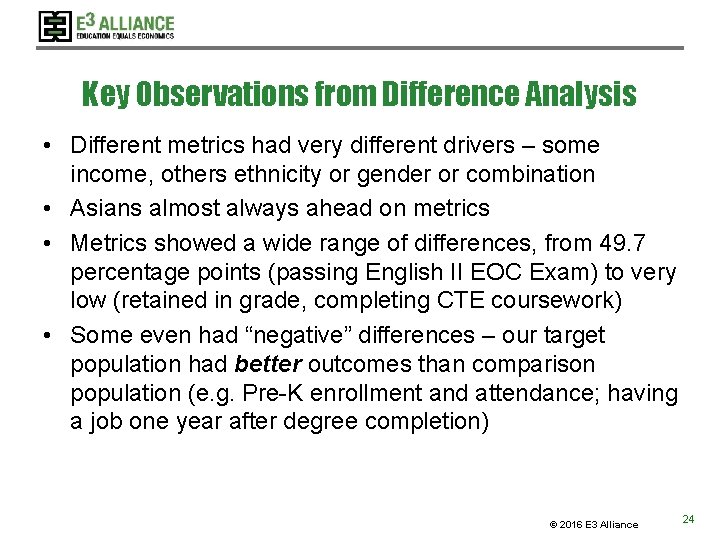
Key Observations from Difference Analysis • Different metrics had very different drivers – some income, others ethnicity or gender or combination • Asians almost always ahead on metrics • Metrics showed a wide range of differences, from 49. 7 percentage points (passing English II EOC Exam) to very low (retained in grade, completing CTE coursework) • Some even had “negative” differences – our target population had better outcomes than comparison population (e. g. Pre-K enrollment and attendance; having a job one year after degree completion) © 2016 E 3 Alliance 24
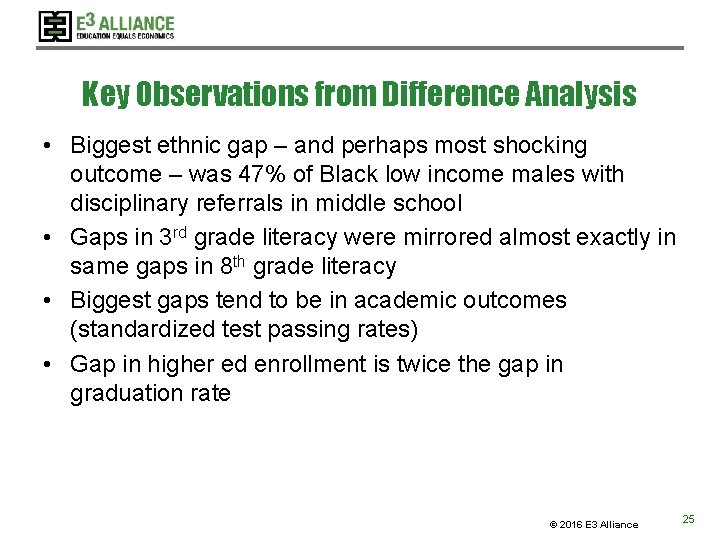
Key Observations from Difference Analysis • Biggest ethnic gap – and perhaps most shocking outcome – was 47% of Black low income males with disciplinary referrals in middle school • Gaps in 3 rd grade literacy were mirrored almost exactly in same gaps in 8 th grade literacy • Biggest gaps tend to be in academic outcomes (standardized test passing rates) • Gap in higher ed enrollment is twice the gap in graduation rate © 2016 E 3 Alliance 25
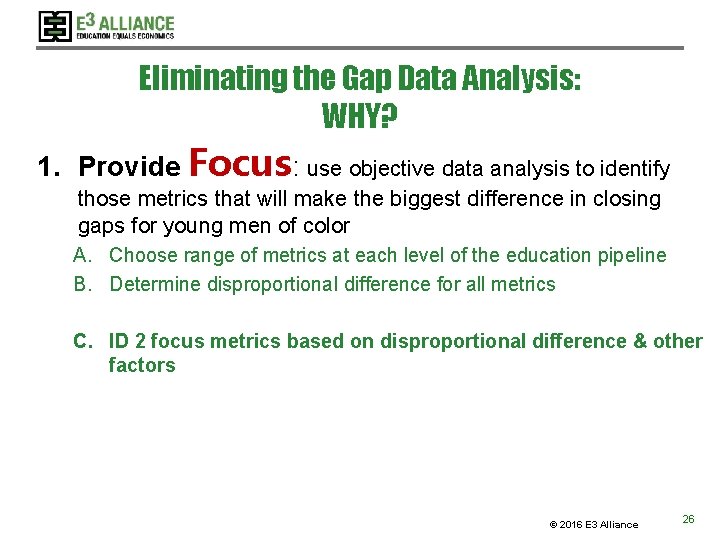
Eliminating the Gap Data Analysis: WHY? 1. Provide Focus: use objective data analysis to identify those metrics that will make the biggest difference in closing gaps for young men of color A. Choose range of metrics at each level of the education pipeline B. Determine disproportional difference for all metrics C. ID 2 focus metrics based on disproportional difference & other factors © 2016 E 3 Alliance 26
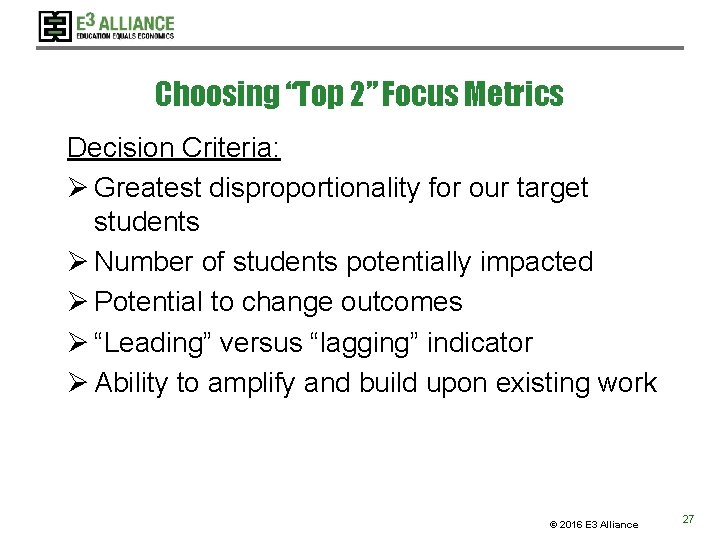
Choosing “Top 2” Focus Metrics Decision Criteria: Ø Greatest disproportionality for our target students Ø Number of students potentially impacted Ø Potential to change outcomes Ø “Leading” versus “lagging” indicator Ø Ability to amplify and build upon existing work © 2016 E 3 Alliance 27
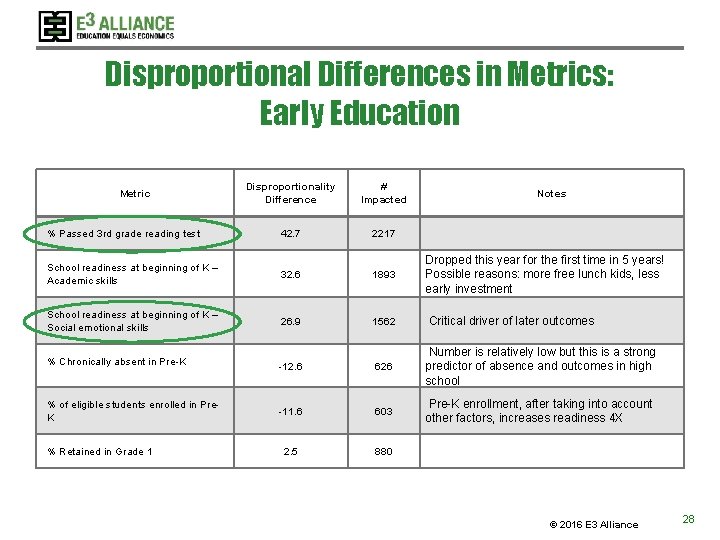
Disproportional Differences in Metrics: Early Education Metric % Passed 3 rd grade reading test Disproportionality Difference # Impacted 42. 7 2217 Notes School readiness at beginning of K – Academic skills 32. 6 1893 Dropped this year for the first time in 5 years! Possible reasons: more free lunch kids, less early investment School readiness at beginning of K – Social emotional skills 26. 9 1562 Critical driver of later outcomes % Chronically absent in Pre-K -12. 6 626 Number is relatively low but this is a strong predictor of absence and outcomes in high school % of eligible students enrolled in Pre. K -11. 6 603 Pre-K enrollment, after taking into account other factors, increases readiness 4 X 2. 5 880 % Retained in Grade 1 © 2016 E 3 Alliance 28
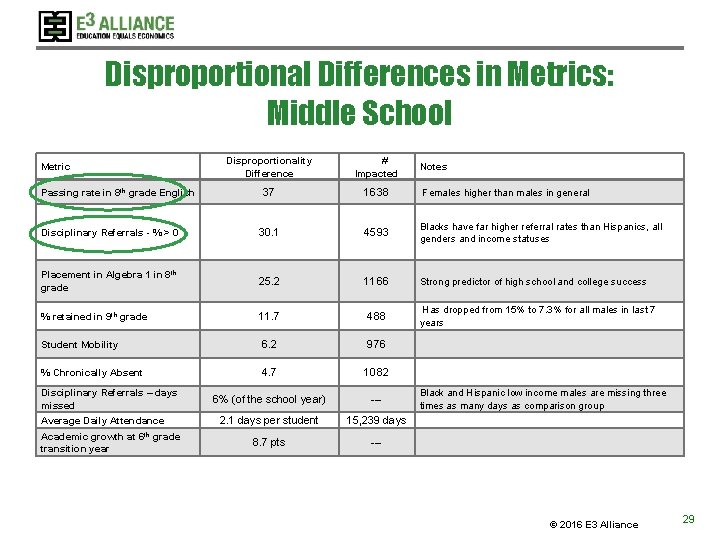
Disproportional Differences in Metrics: Middle School Disproportionality Difference # Impacted 37 1638 Females higher than males in general Disciplinary Referrals - % > 0 30. 1 4593 Blacks have far higher referral rates than Hispanics, all genders and income statuses Placement in Algebra 1 in 8 th grade 25. 2 1166 Strong predictor of high school and college success % retained in 9 th grade 11. 7 488 Student Mobility 6. 2 976 % Chronically Absent 4. 7 1082 6% (of the school year) --- 2. 1 days per student 15, 239 days 8. 7 pts --- Metric Passing rate in 8 th grade English Disciplinary Referrals – days missed Average Daily Attendance Academic growth at 6 th grade transition year Notes Has dropped from 15% to 7. 3% for all males in last 7 years Black and Hispanic low income males are missing three times as many days as comparison group © 2016 E 3 Alliance 29
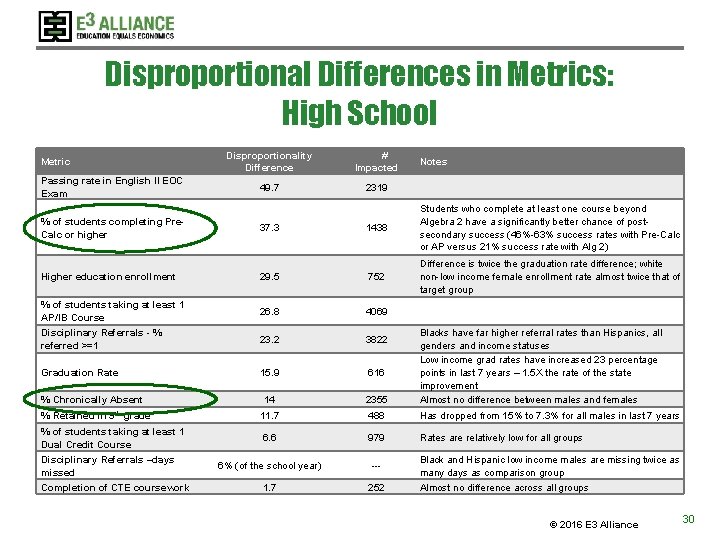
Disproportional Differences in Metrics: High School Metric Passing rate in English II EOC Exam Disproportionality Difference # Impacted 49. 7 2319 Notes % of students completing Pre. Calc or higher 37. 3 1438 Students who complete at least one course beyond Algebra 2 have a significantly better chance of postsecondary success (46%-63% success rates with Pre-Calc or AP versus 21% success rate with Alg 2) Higher education enrollment 29. 5 752 Difference is twice the graduation rate difference; white non-low income female enrollment rate almost twice that of target group % of students taking at least 1 AP/IB Course 26. 8 4069 Disciplinary Referrals - % referred >=1 23. 2 3822 Graduation Rate 15. 9 616 14 2355 Blacks have far higher referral rates than Hispanics, all genders and income statuses Low income grad rates have increased 23 percentage points in last 7 years – 1. 5 X the rate of the state improvement Almost no difference between males and females % Retained in 9 th grade 11. 7 488 Has dropped from 15% to 7. 3% for all males in last 7 years % of students taking at least 1 Dual Credit Course 6. 6 979 Rates are relatively low for all groups 6% (of the school year) --- 1. 7 252 % Chronically Absent Disciplinary Referrals –days missed Completion of CTE coursework Black and Hispanic low income males are missing twice as many days as comparison group Almost no difference across all groups © 2016 E 3 Alliance 30
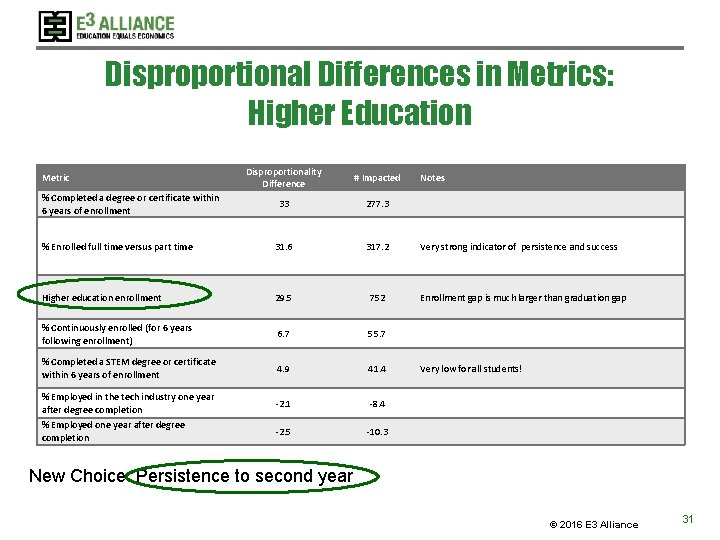
Disproportional Differences in Metrics: Higher Education Disproportionality Difference # Impacted 33 277. 3 % Enrolled full time versus part time 31. 6 317. 2 Higher education enrollment 29. 5 752 % Continuously enrolled (for 6 years following enrollment) 6. 7 55. 7 % Completed a STEM degree or certificate within 6 years of enrollment 4. 9 41. 4 % Employed in the tech industry one year after degree completion -2. 1 -8. 4 % Employed one year after degree completion -2. 5 -10. 3 Metric % Completed a degree or certificate within 6 years of enrollment Notes Very strong indicator of persistence and success Enrollment gap is much larger than graduation gap Very low for all students! New Choice: Persistence to second year © 2016 E 3 Alliance 31
Do the chosen “gaps” metrics make sense to you? Do these match what you said on your worksheet? Based on our findings, would you change your worksheet metrics? W © 2016 E 3 Alliance 32
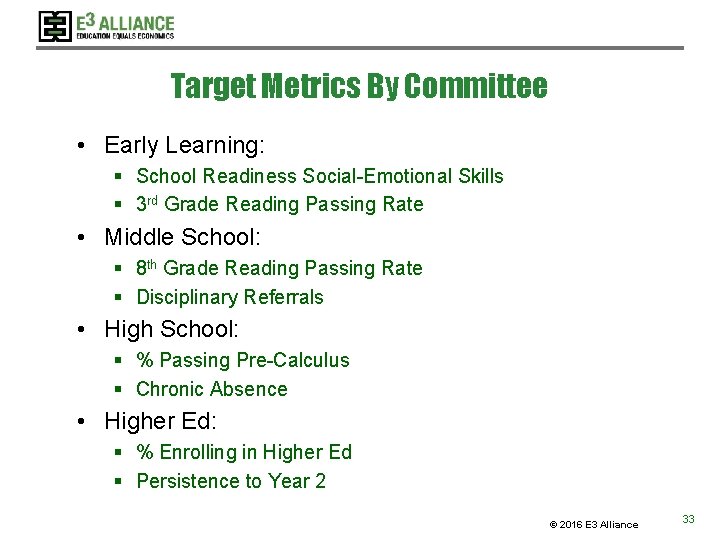
Target Metrics By Committee • Early Learning: § School Readiness Social-Emotional Skills § 3 rd Grade Reading Passing Rate • Middle School: § 8 th Grade Reading Passing Rate § Disciplinary Referrals • High School: § % Passing Pre-Calculus § Chronic Absence • Higher Ed: § % Enrolling in Higher Ed § Persistence to Year 2 © 2016 E 3 Alliance 33
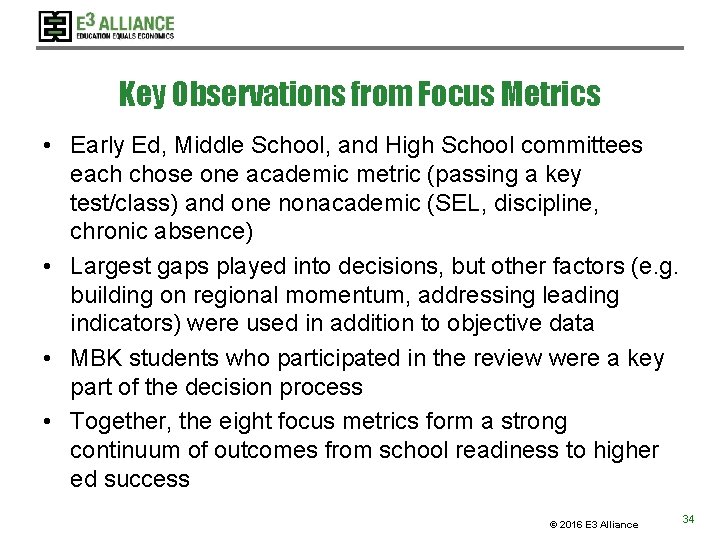
Key Observations from Focus Metrics • Early Ed, Middle School, and High School committees each chose one academic metric (passing a key test/class) and one nonacademic (SEL, discipline, chronic absence) • Largest gaps played into decisions, but other factors (e. g. building on regional momentum, addressing leading indicators) were used in addition to objective data • MBK students who participated in the review were a key part of the decision process • Together, the eight focus metrics form a strong continuum of outcomes from school readiness to higher ed success © 2016 E 3 Alliance 34
Data Analysis Goal 2 2. Support Action: Provide comparative data sets to help institutions and our community move the needle on these metrics A. What factor(s) most influence metric? B. Which schools are bright spots across the region? © 2016 E 3 Alliance 35
For each focus metric for each committee… © 2016 E 3 Alliance 36
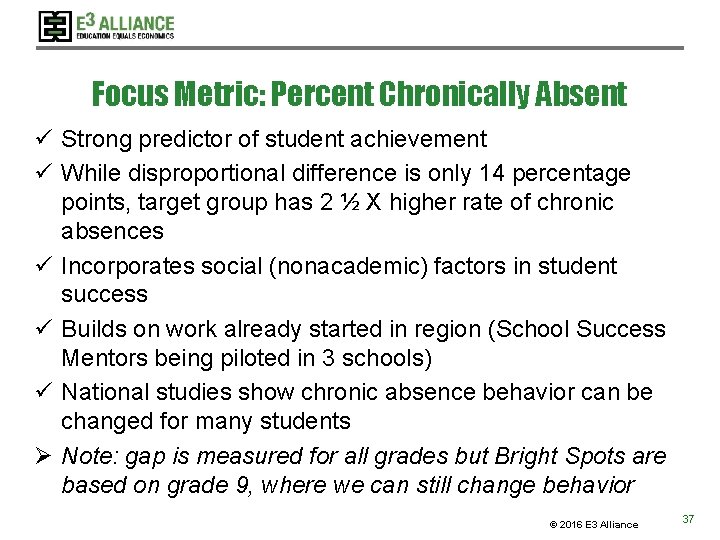
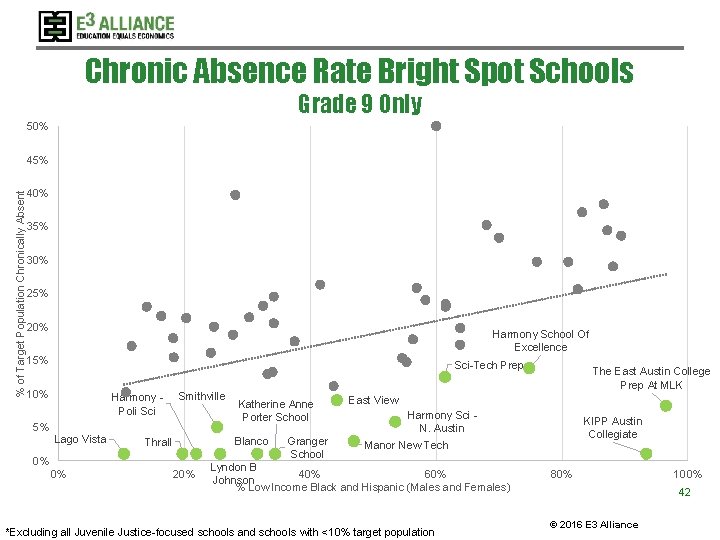
Focus Metric: Percent Chronically Absent ü Strong predictor of student achievement ü While disproportional difference is only 14 percentage points, target group has 2 ½ X higher rate of chronic absences ü Incorporates social (nonacademic) factors in student success ü Builds on work already started in region (School Success Mentors being piloted in 3 schools) ü National studies show chronic absence behavior can be changed for many students Ø Note: gap is measured for all grades but Bright Spots are based on grade 9, where we can still change behavior © 2016 E 3 Alliance 37
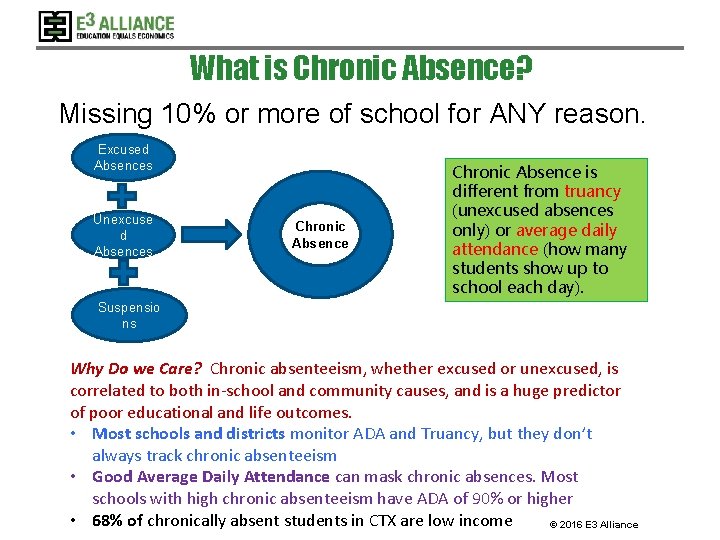
What is Chronic Absence? Missing 10% or more of school for ANY reason. Excused Absences Unexcuse d Absences Chronic Absence is different from truancy (unexcused absences only) or average daily attendance (how many students show up to school each day). Suspensio ns Why Do we Care? Chronic absenteeism, whether excused or unexcused, is correlated to both in-school and community causes, and is a huge predictor of poor educational and life outcomes. • Most schools and districts monitor ADA and Truancy, but they don’t always track chronic absenteeism • Good Average Daily Attendance can mask chronic absences. Most schools with high chronic absenteeism have ADA of 90% or higher • 68% of chronically absent students in CTX are low income © 2016 E 3 Alliance
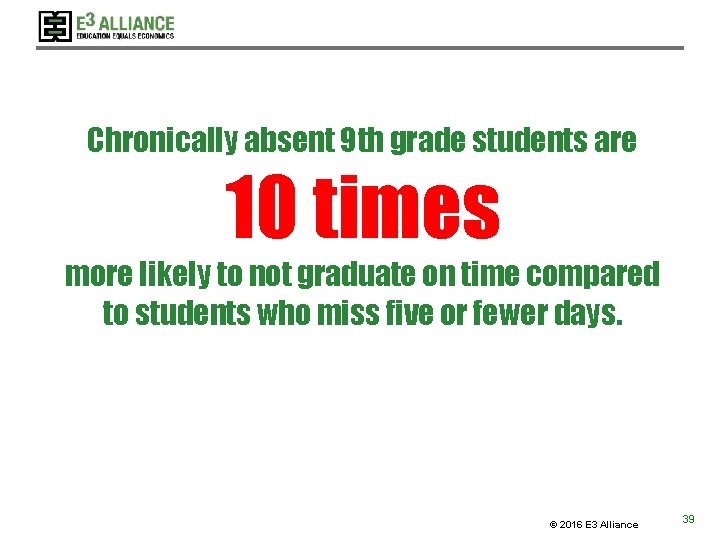
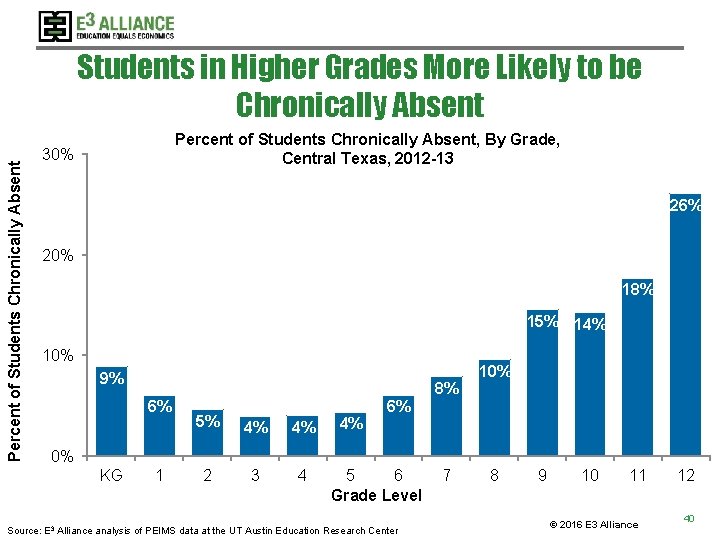
Chronically absent 9 th grade students are 10 times more likely to not graduate on time compared to students who miss five or fewer days. © 2016 E 3 Alliance 39
Percent of Students Chronically Absent Students in Higher Grades More Likely to be Chronically Absent Percent of Students Chronically Absent, By Grade, Central Texas, 2012 -13 30% 26% 20% 18% 15% 14% 10% 9% 8% 6% 5% 4% 4% 2 3 4 4% 10% 6% 0% KG 1 5 6 Grade Level Source: E 3 Alliance analysis of PEIMS data at the UT Austin Education Research Center 7 8 9 10 11 © 2016 E 3 Alliance 12 40
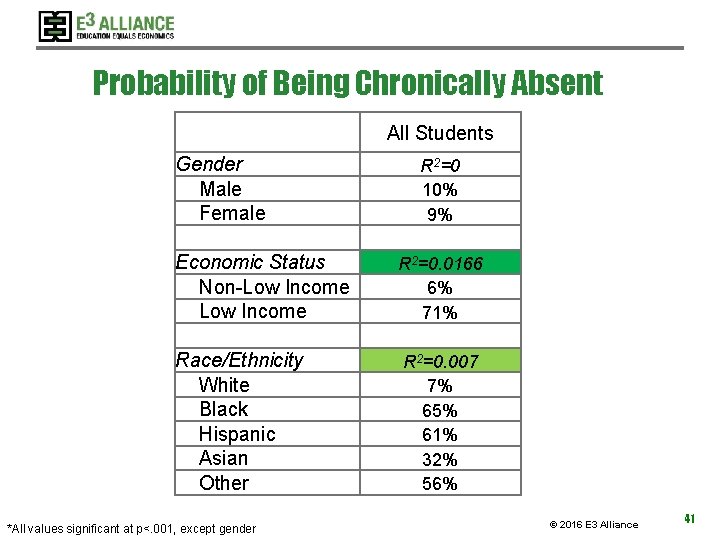
Probability of Being Chronically Absent All Students Gender Male Female R 2=0 10% 9% Economic Status Non-Low Income R 2=0. 0166 6% 71% Race/Ethnicity White Black Hispanic Asian Other R 2=0. 007 7% 65% 61% 32% 56% *All values significant at p<. 001, except gender © 2016 E 3 Alliance 41
Chronic Absence Rate Bright Spot Schools Grade 9 Only 50% % of Target Population Chronically Absent 45% 40% 35% 30% 25% 20% Harmony School Of Excellence 15% Sci-Tech Prep 10% Smithville Harmony - Poli Sci 5% Lago Vista Thrall 0% 0% 20% Katherine Anne Porter School Blanco Granger School The East Austin College Prep At MLK East View Harmony Sci - N. Austin KIPP Austin Collegiate Manor New Tech Lyndon B 40% 60% Johnson % Low Income Black and Hispanic (Males and Females) *Excluding all Juvenile Justice-focused schools and schools with <10% target population 80% 100% 42 © 2016 E 3 Alliance
HS Team - Interviews with Bright Spots • High school team analyzed bright spot data provided by E 3 Alliance • Team split into 2 smaller teams to focus the work on two metrics (Adv. Math and Chronic Absenteeism) • Goal is to identify best practices for bright spot campuses through set of interviews with campus leaders • Patterns and trends based on interviews will be identified to build a research brief that can be shared with districts in the region © 2016 E 3 Alliance 43
Go back to your worksheet: Capture data sources & partners Capture possible team members W © 2016 E 3 Alliance 44
Committees Driving to Action 1. Review landscape of efforts to build on associated with chosen metrics 2. Overlay qualitative data (the why? ) to understand Bright Spots, plan for regional change in target metrics 3. Meet with partner districts to share analysis and build action plans to address improvements in target metrics school by school (confidential data to be shared separately) 4. Build regional action plan to move the needle on target metrics © 2016 E 3 Alliance 45
Turn & Talk! • Gather in groups of 3 • Take 1 minute to present your plan • Your partners have 4 minutes to help ID Barriers and Opportunities © 2016 E 3 Alliance W 46
Eliminating the Gap Data Analysis Summary • Powerful process to help MBK Committees use objective data to provide focus and move to action • Each committee started with list of potential metrics, focused on two, now armed with data context to be able to take action • By working with schools districts, higher ed, and community, can identify replicable practices to move the needle on each of these metrics Ø To improve outcomes for our young men of color! © 2016 E 3 Alliance 47
Eliminating the Gap Data Analysis: WHY? Ø Provide Focus: use objective data analysis to identify those metrics that will make the biggest difference in closing gaps for young men of color ü Choose range of metrics at each level of the education pipeline ü Determine disproportional difference for all metrics ü ID 2 focus metrics based on disproportional difference & other factors Ø Support Action: Provide comparative data sets to help institutions and our community move the needle on these metrics ü What factor(s) most influence metric? (Gender/ethnicity/income) ü Which schools are bright spots across the region? ü Provide districts data to compare schools and focus actions © 2016 E 3 Alliance 48
Questions for us? ? © 2016 E 3 Alliance 49
The conclusions of this research do not necessarily reflect the opinions or official position of the Texas Education Agency, the Texas Higher Education Coordinating Board, or the State of Texas. Caitlin Hamrock Sonia Dominguez Administrative Supervisory, Austin ISD sonia. dominguez@austinisd. org Senior Research Advisor, E 3 Alliance chamrock@e 3 alliance. org Susan Dawson President, E 3 Alliance sdawson@e 3 alliance. org Thank You! www. e 3 alliance. org © 2016 E 3 Alliance