Diet Heart and Nutritional Epidemiology Lessons Not Learned




- Slides: 77
Diet Heart and Nutritional Epidemiology: Lessons Not Learned. Christopher T. Sempos September 20, 2012
When studying the past. . . • “It is very hard to remember that events now long in the past were once in the future. ” Maitland • “Understanding the past requires pretending that you don't know the present. ” Paul Fussell
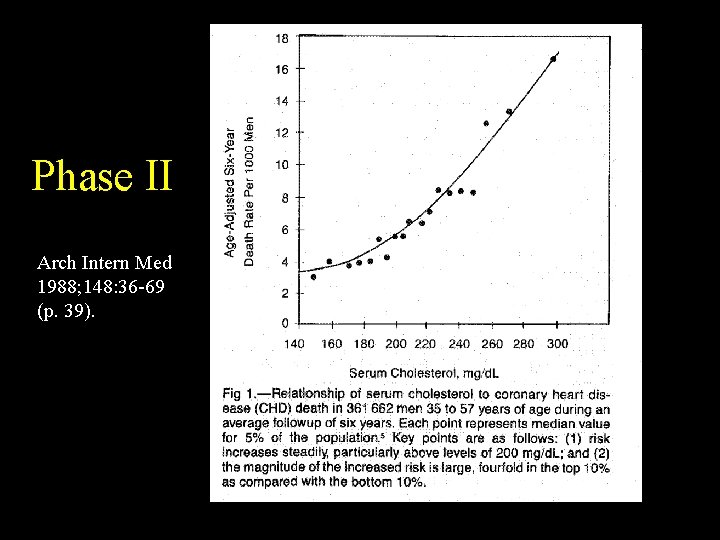
Think Back to about 1980 • Debate over the relationship of dietary fat and cholesterol intake to CHD risk rages. • Difficult to show a significant cross-sectional association between dietary fats or cholesterol and blood cholesterol levels at the individual level. • Also, difficult to show a direct relationship of diet to CHD risk in cohort studies. • Consistent positive association serum cholesterol and CHD risk.
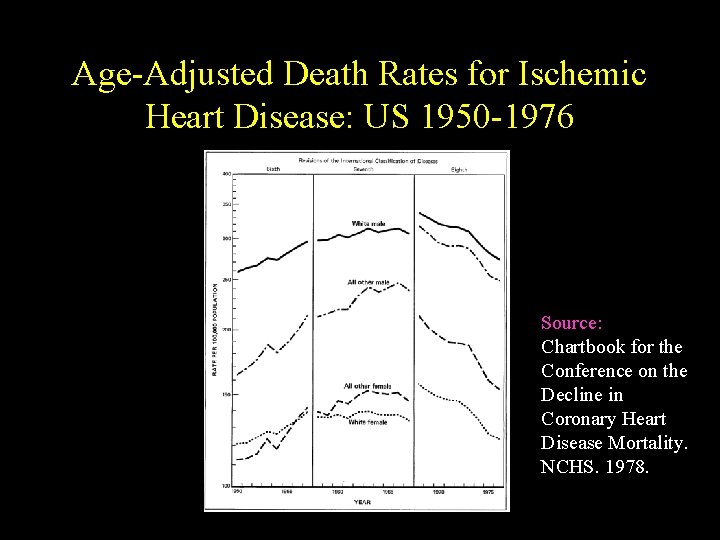
Age-Adjusted Death Rates for Ischemic Heart Disease: US 1950 -1976 Source: Chartbook for the Conference on the Decline in Coronary Heart Disease Mortality. NCHS. 1978.
Etiology of Arteriosclerosis* • “It is apparent that it will be difficult to find a single factor responsible for a condition presenting such widespread and varying manifestations. . . • “The etiological factors may arbitrarily be grouped under the headings: mechanical; metabolic; endocrinological; infectious; nervous; hereditary predisposition; and intoxication. ” * Evans RD. Cal & Western Med 1931; 34(3): 145 -149.
“The Cholesterol Controversy is over: Why did it take so long? ” Daniel Steinberg, MD, Ph. D Circulation 1989; 80: 1070 -1078
Controversy over? • Siri-Tarino et al “Meta-analysis of prospective cohort studies evaluating the association of saturated fat with cardiovascular disease” AJCN 2010; 91: 535 -46. • Siri-Tarino et al. “Saturated fat, carbohydrate, and cardiovascular disease. AJCN 2010; 91: 502 -9. • Astrup et al. The role of reducing intakes of saturated fat in the prevention of of cardiovascular disease: where does the evidence stand in 2010? . AJCN 2011; 93: 684 -8.
The Diet-Heart Hypothesis
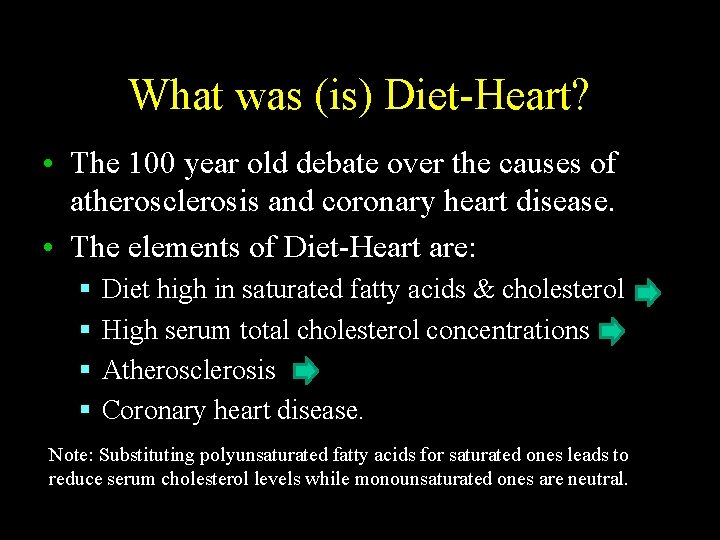
What was (is) Diet-Heart? • The 100 year old debate over the causes of atherosclerosis and coronary heart disease. • The elements of Diet-Heart are: § § Diet high in saturated fatty acids & cholesterol High serum total cholesterol concentrations Atherosclerosis Coronary heart disease. Note: Substituting polyunsaturated fatty acids for saturated ones leads to reduce serum cholesterol levels while monounsaturated ones are neutral.
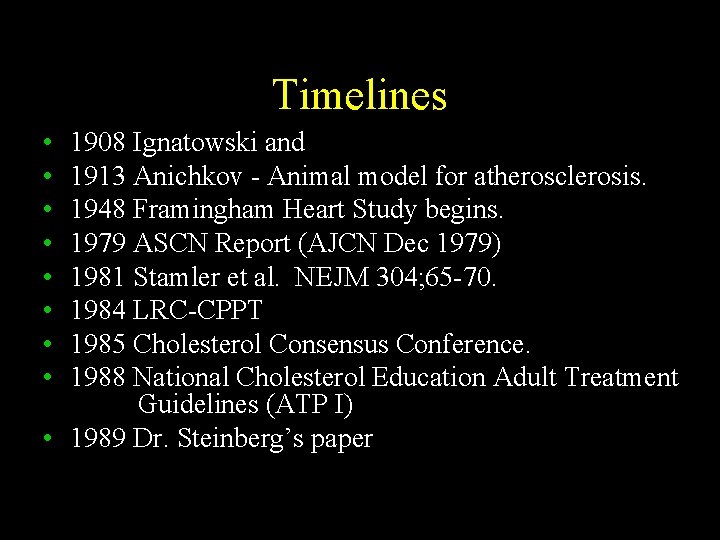
Timelines • • 1908 Ignatowski and 1913 Anichkov - Animal model for atherosclerosis. 1948 Framingham Heart Study begins. 1979 ASCN Report (AJCN Dec 1979) 1981 Stamler et al. NEJM 304; 65 -70. 1984 LRC-CPPT 1985 Cholesterol Consensus Conference. 1988 National Cholesterol Education Adult Treatment Guidelines (ATP I) • 1989 Dr. Steinberg’s paper
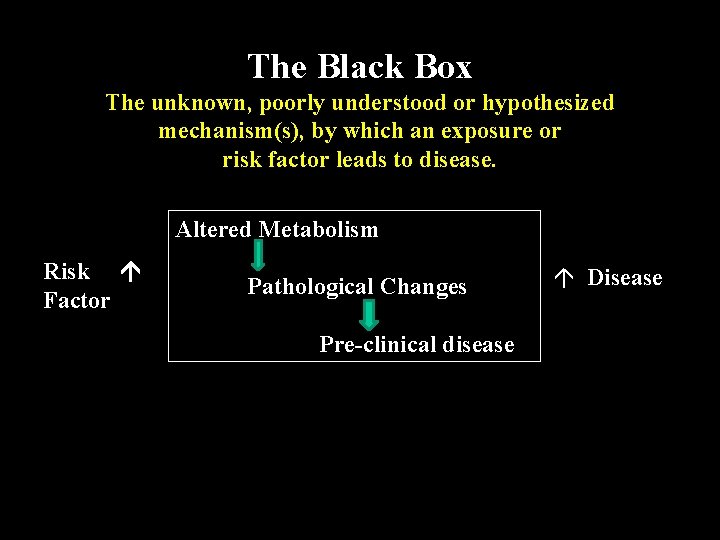
The Black Box The unknown, poorly understood or hypothesized mechanism(s), by which an exposure or risk factor leads to disease. Altered Metabolism Risk Factor Pathological Changes Pre-clinical disease Disease
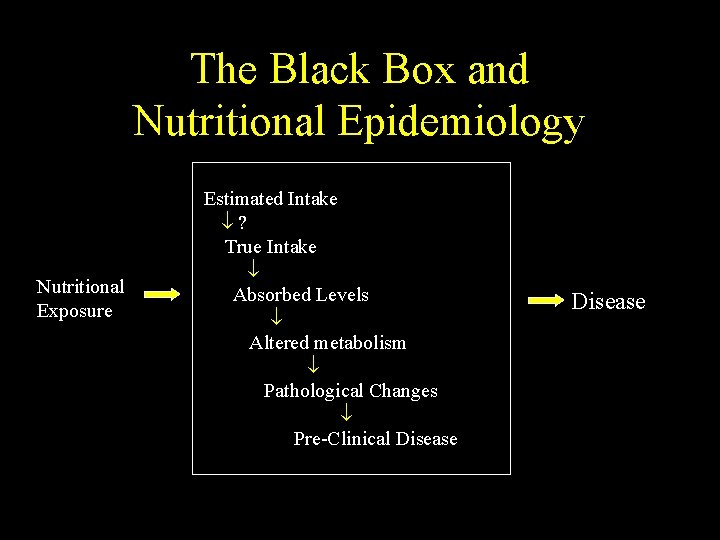
The Black Box and Nutritional Epidemiology Nutritional Exposure Estimated Intake ¯? True Intake ¯ Absorbed Levels ¯ Altered metabolism ¯ Pathological Changes ¯ Pre-Clinical Disease
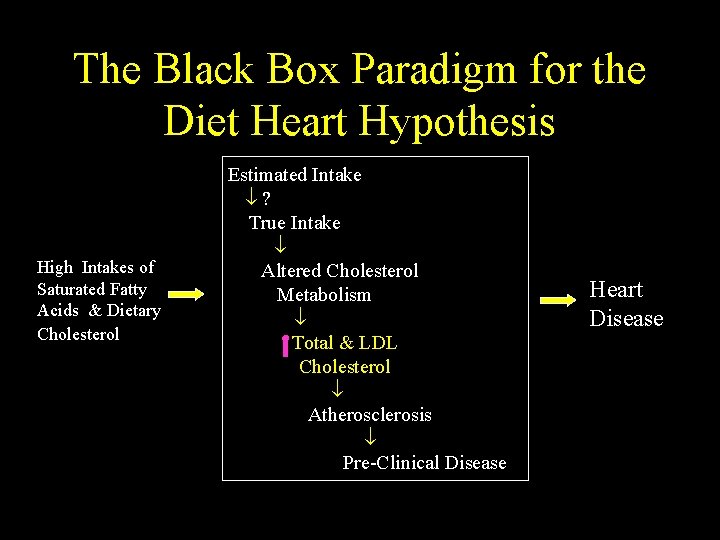
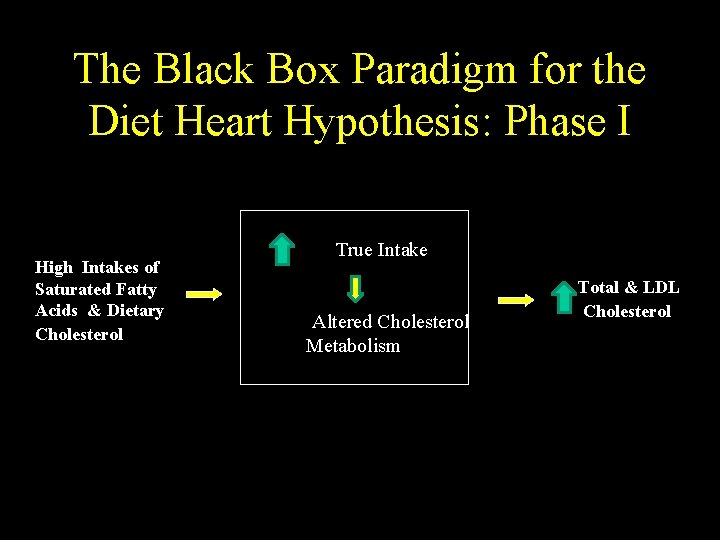
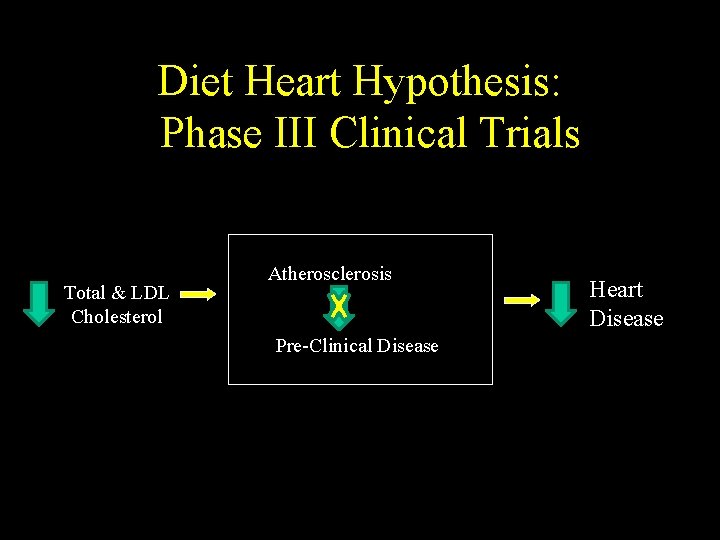
The Black Box Paradigm for the Diet Heart Hypothesis High Intakes of Saturated Fatty Acids & Dietary Cholesterol Estimated Intake ¯? True Intake ¯ Altered Cholesterol Metabolism ¯ Total & LDL Cholesterol ¯ Atherosclerosis ¯ Pre-Clinical Disease Heart Disease
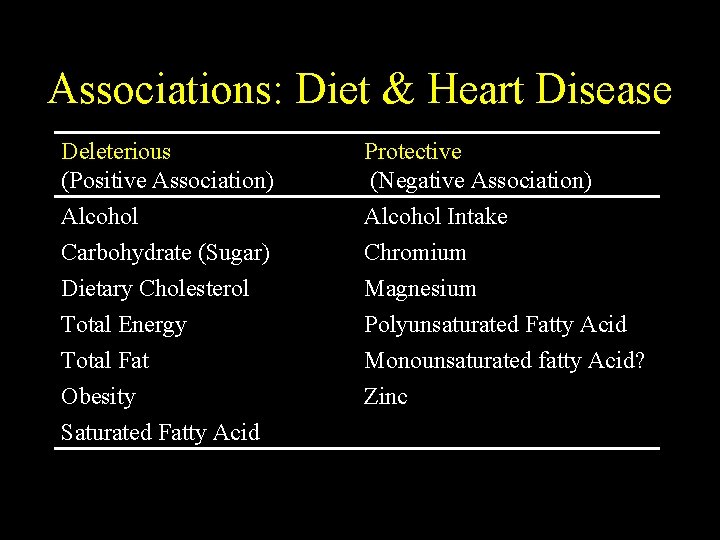
Associations: Diet & Heart Disease Deleterious (Positive Association) Protective (Negative Association) Alcohol Carbohydrate (Sugar) Alcohol Intake Chromium Dietary Cholesterol Total Energy Total Fat Obesity Saturated Fatty Acid Magnesium Polyunsaturated Fatty Acid Monounsaturated fatty Acid? Zinc
Diet-Heart Results from Observational Epidemiology
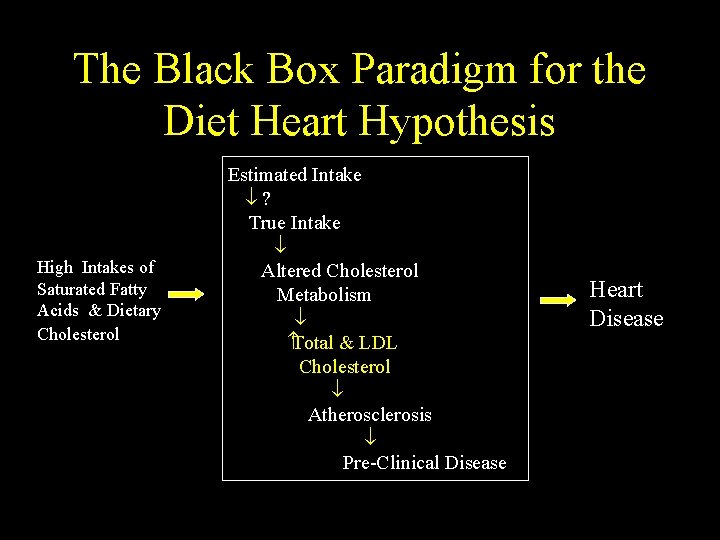
The Black Box Paradigm for the Diet Heart Hypothesis High Intakes of Saturated Fatty Acids & Dietary Cholesterol Estimated Intake ¯? True Intake ¯ Altered Cholesterol Metabolism ¯ Total & LDL Cholesterol ¯ Atherosclerosis ¯ Pre-Clinical Disease Heart Disease
Observational Epidemiology Finding Associations: Confounding Issues
Finding Associations: Confounding Issues • • Estimating intake Measurement error: Within-person variability Diet uniformity within countries Correlation among nutrients in the diet.
Dietary Survey Methods • Severe systematic biases, e. g. energy intake underestimation in all methods; • Primary form of bias is underestimation; • Impact of underestimation in energy intake on the intake of other nutrients is unknown; • Need clinical/biochemical data to properly interpret.
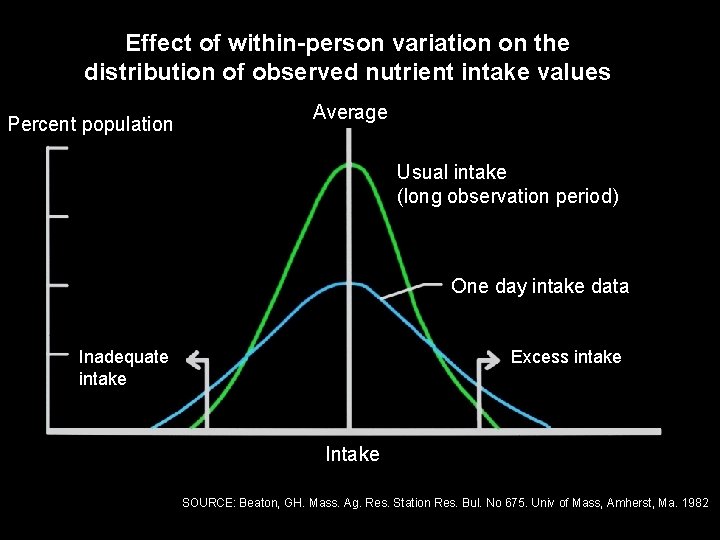
Problem in Analytical Epidemiology • Given the day to day or within-person variation in diet and biological measures, … • “How does an individual’s day-to-day variation in diet effect the ability to measure associations and how can we minimize its impact?
Effect of within-person variation on the distribution of observed nutrient intake values Percent population Average Usual intake (long observation period) One day intake data Inadequate intake Excess intake Intake SOURCE: Beaton, GH. Mass. Ag. Res. Station Res. Bul. No 675. Univ of Mass, Amherst, Ma. 1982
Diet and Serum Cholesterol: Do zero correlations negate the relationship? David Jacobs et al. Am J Epidemiology 1979; 110: 77 -87.
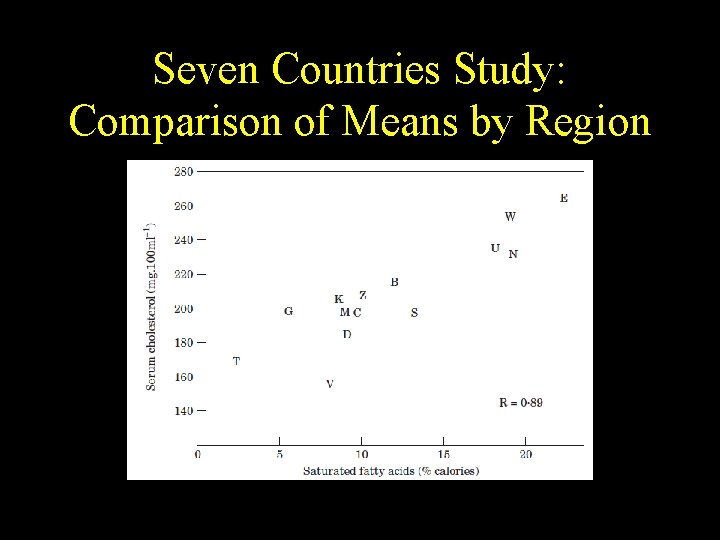
Seven Countries Study: Comparison of Means by Region
Seven Countries Study Sites • • B = Belgrade, Serbia C = Crevalcore, Italy D = Dalmatia, Croatia E = East Finland G = Corfu, Greece J = Ushibuka, Japan K = Crete • • M = Montigiorgio, Italy N = Zutphen, Neth. S = Slavonia, Croatia T = Tanushimaru, Japan U = US Railroad V = Velika Krsna, Serbia W = West Finland
Finding Associations: Confounding Issues Correlation Among Nutrients in the Diet
Multi-Variable Regression Models in Epidemiology Issues related to their use.
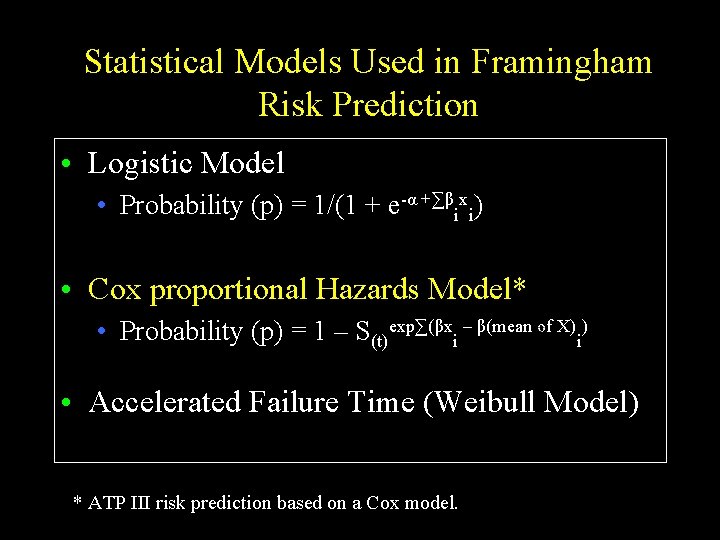
Statistical Models Used in Framingham Risk Prediction • Logistic Model • Probability (p) = 1/(1 + e-α +∑βixi) • Cox proportional Hazards Model* • Probability (p) = 1 – S(t)exp∑(βxi – β(mean of X)i) • Accelerated Failure Time (Weibull Model) * ATP III risk prediction based on a Cox model.
Multi-Variable Models in Epidemiology • Used to predict and interpret • Prediction § Subset of Variables with highest R 2. § No interpretation of variables needed. § Explicit solutions exist.
Multi-Variable Models in Epidemiology: Interpretation • Biological meaning attached to coefficients. • Models used to simulate an experiment by correcting or adjusting for confounding. • Choice of variables in model depends on selection algorithm. • Explicit solutions do not exist.
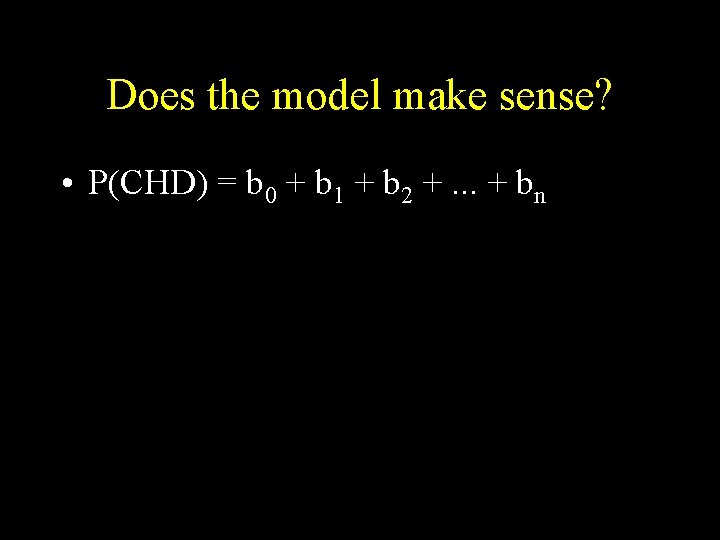
Does the model make sense? • P(CHD) = b 0 + b 1 + b 2 +. . . + bn
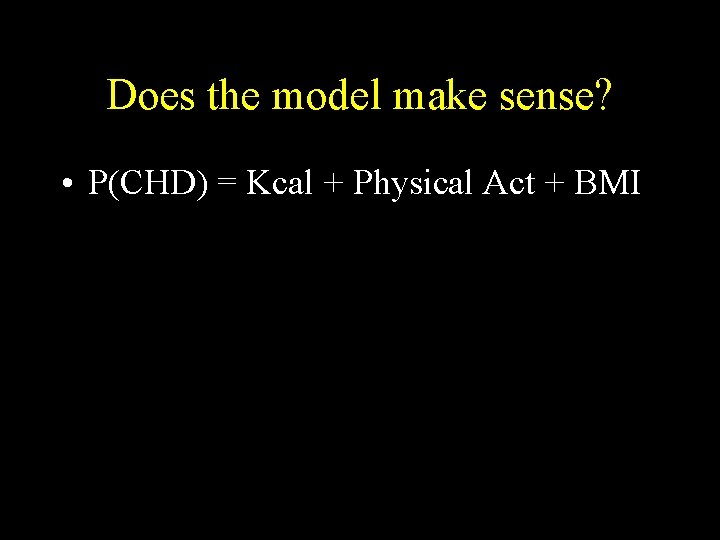
Does the model make sense? • P(CHD) = Kcal + Physical Act + BMI
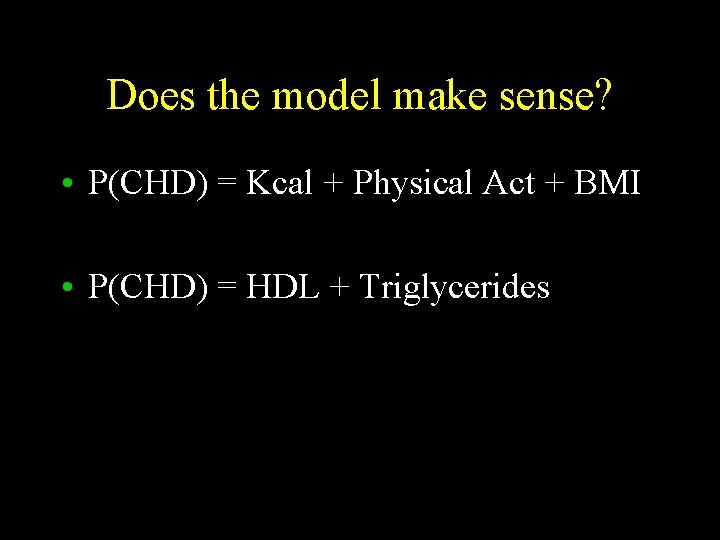
Does the model make sense? • P(CHD) = Kcal + Physical Act + BMI • P(CHD) = HDL + Triglycerides
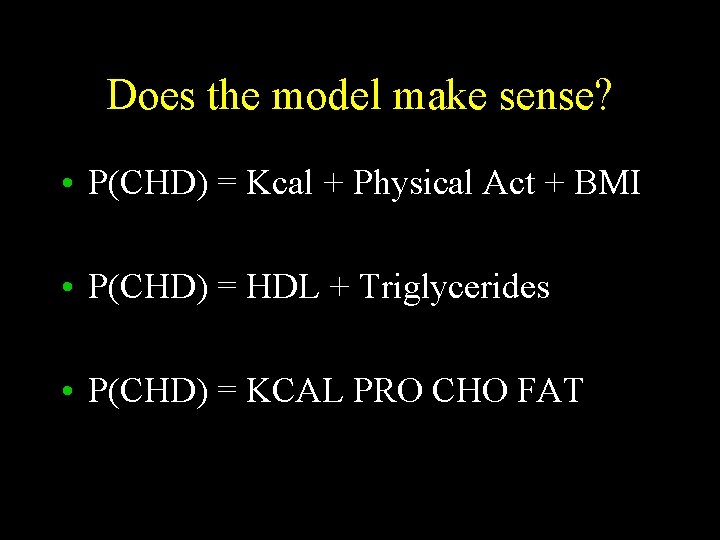
Does the model make sense? • P(CHD) = Kcal + Physical Act + BMI • P(CHD) = HDL + Triglycerides • P(CHD) = KCAL PRO CHO FAT
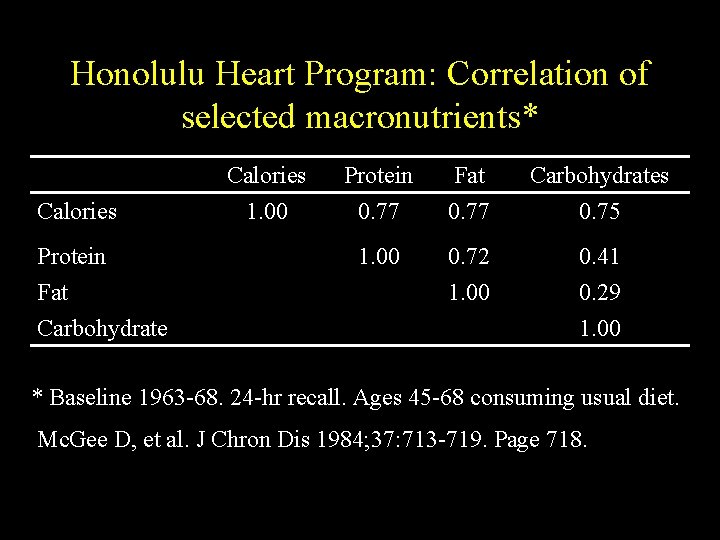
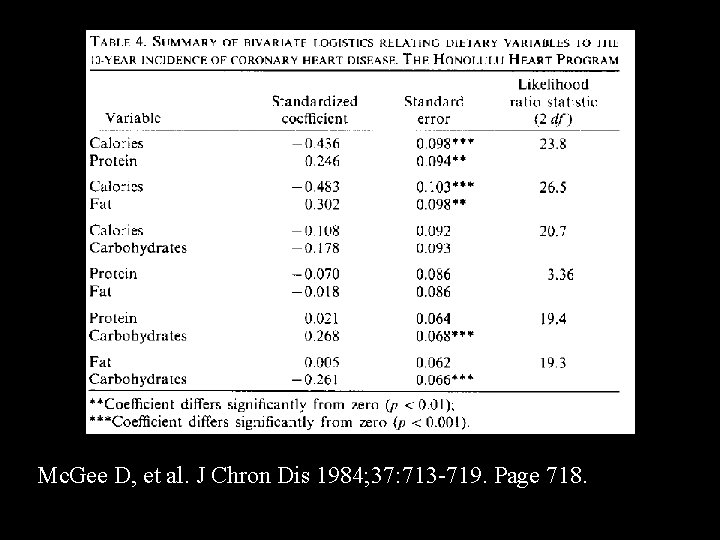
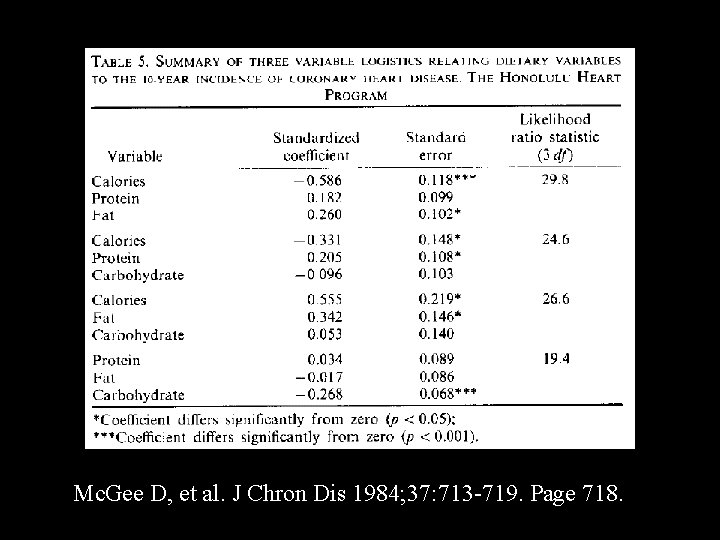
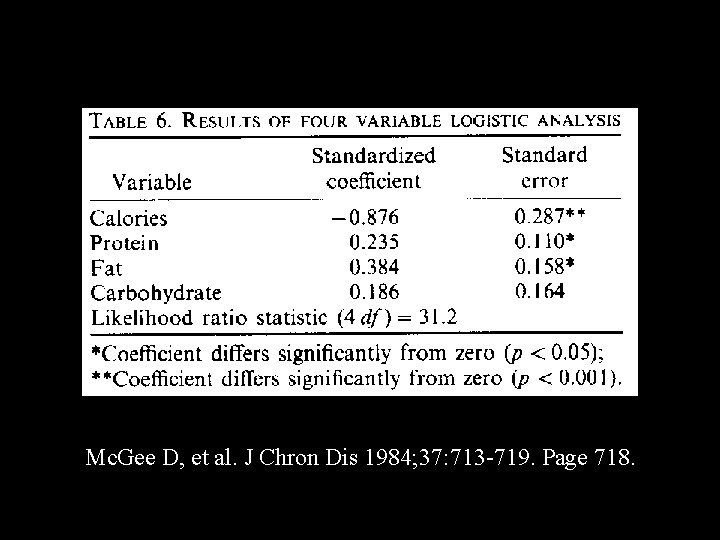
Example: Multi-Variable Model Results When Variables Are Highly Correlated. Diet and CHD Incidence in the Honolulu Heart Program (1984) Mc. Gee D, et al. J Chron Dis 1984; 37: 713 -719. Page 718.
Honolulu Heart Program: Correlation of selected macronutrients* Calories Protein Fat Carbohydrates 1. 00 0. 77 0. 75 1. 00 0. 72 0. 41 1. 00 0. 29 1. 00 * Baseline 1963 -68. 24 -hr recall. Ages 45 -68 consuming usual diet. Mc. Gee D, et al. J Chron Dis 1984; 37: 713 -719. Page 718.
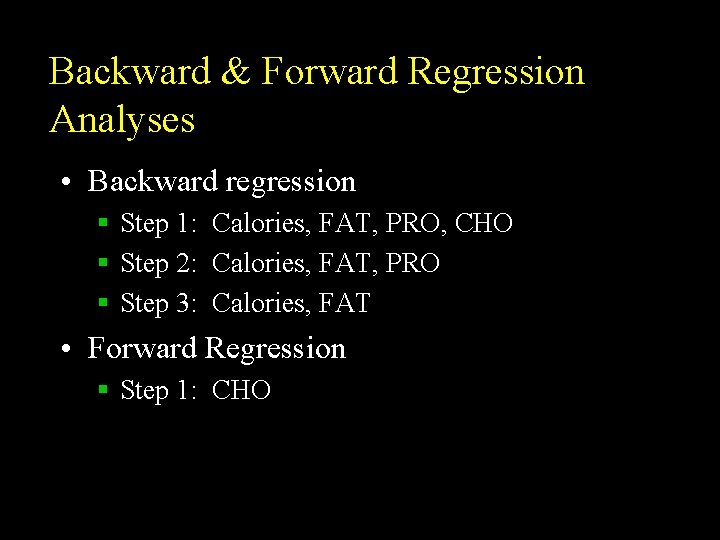
Backward & Forward Regression Analyses • Backward regression § Step 1: Calories, FAT, PRO, CHO § Step 2: Calories, FAT, PRO § Step 3: Calories, FAT • Forward Regression § Step 1: CHO
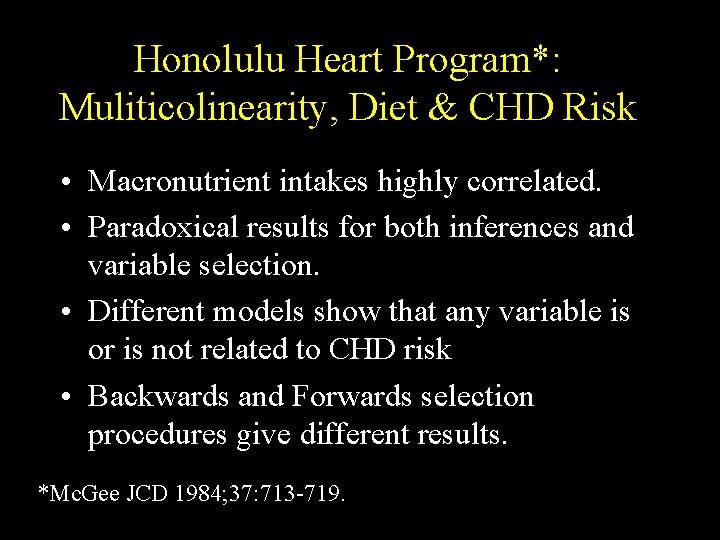
Honolulu Heart Program*: Muliticolinearity, Diet & CHD Risk • Macronutrient intakes highly correlated. • Paradoxical results for both inferences and variable selection. • Different models show that any variable is or is not related to CHD risk • Backwards and Forwards selection procedures give different results. *Mc. Gee JCD 1984; 37: 713 -719.
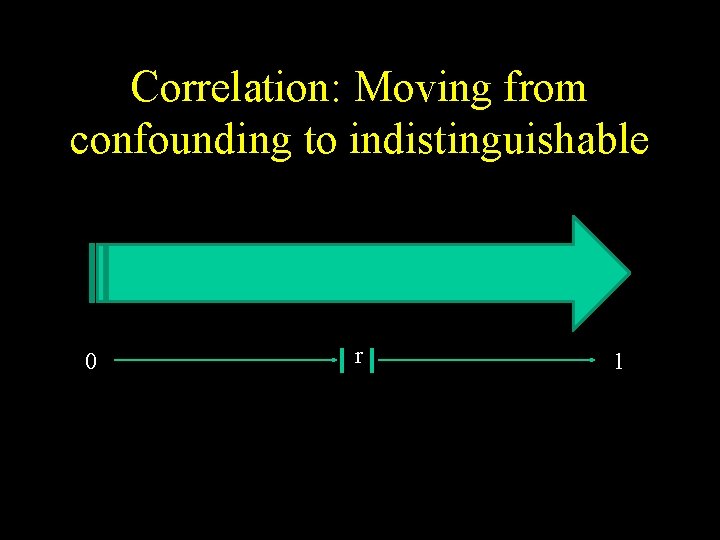
Correlation: Moving from confounding to indistinguishable 0 r 1
Multi-Variable Models with Highly Correlated Variables • Applied to macro-nutrients and CHD risk: “If the question is simply whether dietary variables as a group predict CHD and we are not interested in the exact relationship of a particular diet variable to CHD, solutions exist. If, on the other hand, we are interested in interpreting how a particular diet variable relates to outcome controlling for other diet variables, the collinearity of the data appears to be a structural rather than a mathematical problem with no apparent solution. ” Mc. Gee D, et al. J Chron Dis 1984; 37: 713 -719. Page 718.
Multi-Variable Models in Epidemiology: Interpretation • Intakes or macro-nutrients and micronutrients may be highly correlated. • Metabolism of nutrients may also be highly correlated, e. g. HDL and triglycerides • Correlation cannot be overcome by the use of multivariate models.
Conclusion of 2010 Meta Analysis* • “A meta-analysis of prospective epidemiologic studies showed that there is no significant evidence for concluding that dietary saturated fat is associated with increased risk of CHD or CVD. . . ” *Siri-Tarino et al. AJCN 2010; 91: 535 -46.
1985 Cholesterol Consensus Conference: Diet - Serum cholesterol - CHD Association is Causal. What Was the Chain of Reasoning?
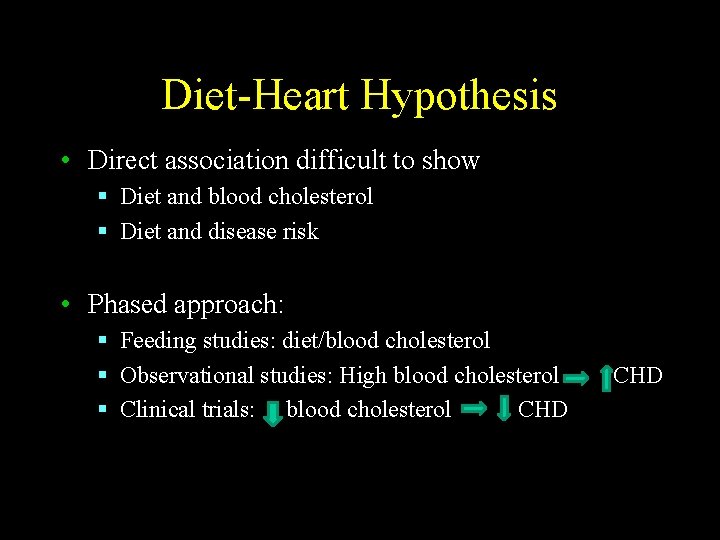
Diet-Heart Hypothesis • Direct association difficult to show § Diet and blood cholesterol § Diet and disease risk • Phased approach: § Feeding studies: diet/blood cholesterol § Observational studies: High blood cholesterol § Clinical trials: blood cholesterol CHD
The Black Box Paradigm for the Diet Heart Hypothesis: Phase I High Intakes of Saturated Fatty Acids & Dietary Cholesterol True Intake Altered Cholesterol Metabolism Total & LDL Cholesterol
Phase II Arch Intern Med 1988; 148: 36 -69 (p. 39).
Diet Heart Hypothesis: Phase III Clinical Trials Total & LDL Cholesterol Atherosclerosis Pre-Clinical Disease Heart Disease
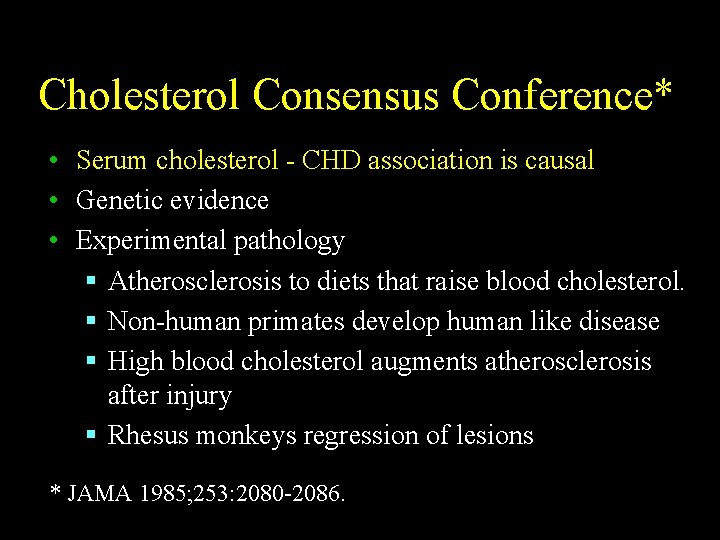
Cholesterol Consensus Conference* • Serum cholesterol - CHD association is causal • Genetic evidence • Experimental pathology § Atherosclerosis to diets that raise blood cholesterol. § Non-human primates develop human like disease § High blood cholesterol augments atherosclerosis after injury § Rhesus monkeys regression of lesions * JAMA 1985; 253: 2080 -2086.
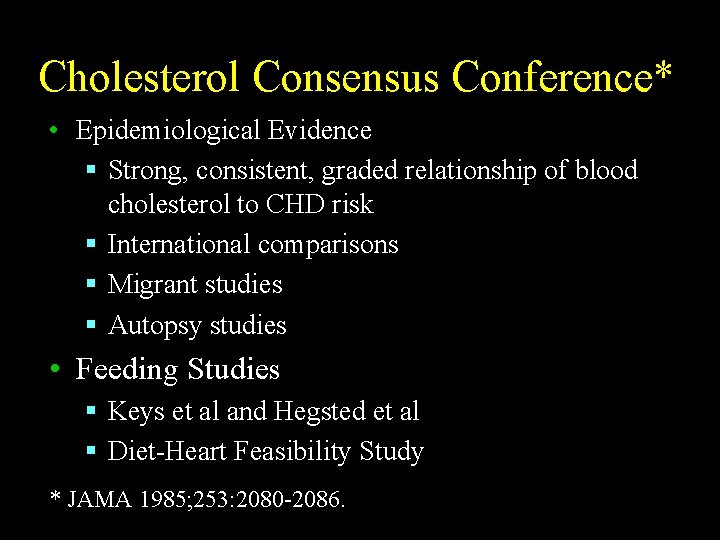
Cholesterol Consensus Conference* • Epidemiological Evidence § Strong, consistent, graded relationship of blood cholesterol to CHD risk § International comparisons § Migrant studies § Autopsy studies • Feeding Studies § Keys et al and Hegsted et al § Diet-Heart Feasibility Study * JAMA 1985; 253: 2080 -2086.
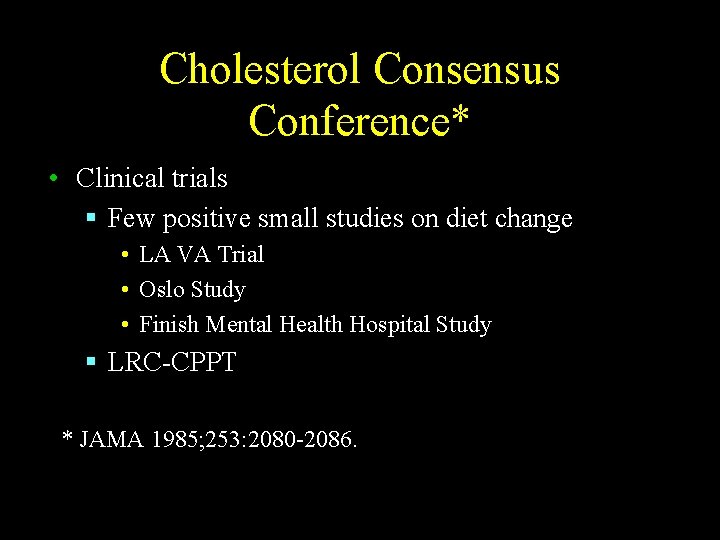
Cholesterol Consensus Conference* • Clinical trials § Few positive small studies on diet change • LA VA Trial • Oslo Study • Finish Mental Health Hospital Study § LRC-CPPT * JAMA 1985; 253: 2080 -2086.
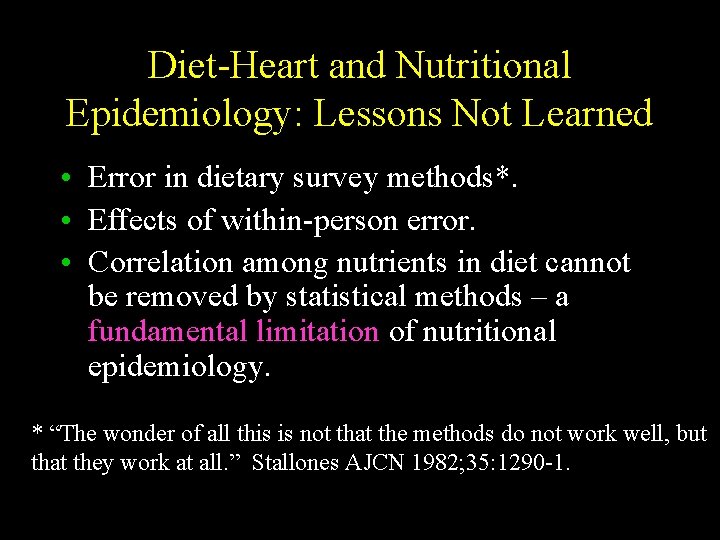
Diet-Heart and Nutritional Epidemiology: Lessons Not Learned • Error in dietary survey methods*. • Effects of within-person error. • Correlation among nutrients in diet cannot be removed by statistical methods – a fundamental limitation of nutritional epidemiology. * “The wonder of all this is not that the methods do not work well, but that they work at all. ” Stallones AJCN 1982; 35: 1290 -1.
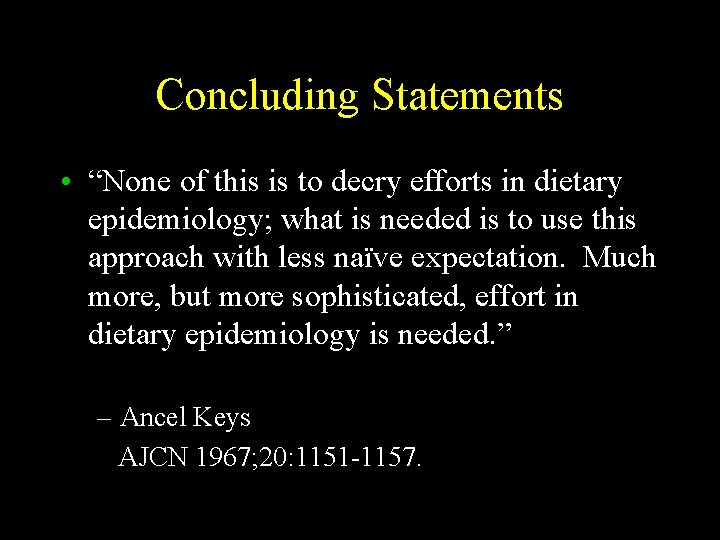
Concluding Statements • “None of this is to decry efforts in dietary epidemiology; what is needed is to use this approach with less naïve expectation. Much more, but more sophisticated, effort in dietary epidemiology is needed. ” – Ancel Keys AJCN 1967; 20: 1151 -1157.
Suggestion • Every Department of Population Health or Epidemiology should offer a course on Diet-Heart.
Thank you! Questions – Comments?
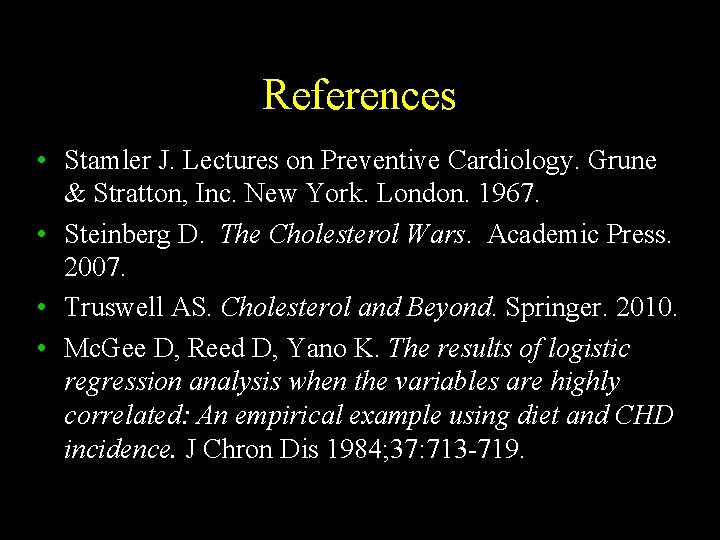
References • Stamler J. Lectures on Preventive Cardiology. Grune & Stratton, Inc. New York. London. 1967. • Steinberg D. The Cholesterol Wars. Academic Press. 2007. • Truswell AS. Cholesterol and Beyond. Springer. 2010. • Mc. Gee D, Reed D, Yano K. The results of logistic regression analysis when the variables are highly correlated: An empirical example using diet and CHD incidence. J Chron Dis 1984; 37: 713 -719.
Measurement issues Dietary Survey Methods
Dietary Survey Methods • Food Records • 24 -Hour Recalls • Diet history/Food Frequency
Dietary Survey Methods: Sources of Error • Instrument error. • Day to day or within-person variation in dietary intake of saturated fatty acids and cholesterol.
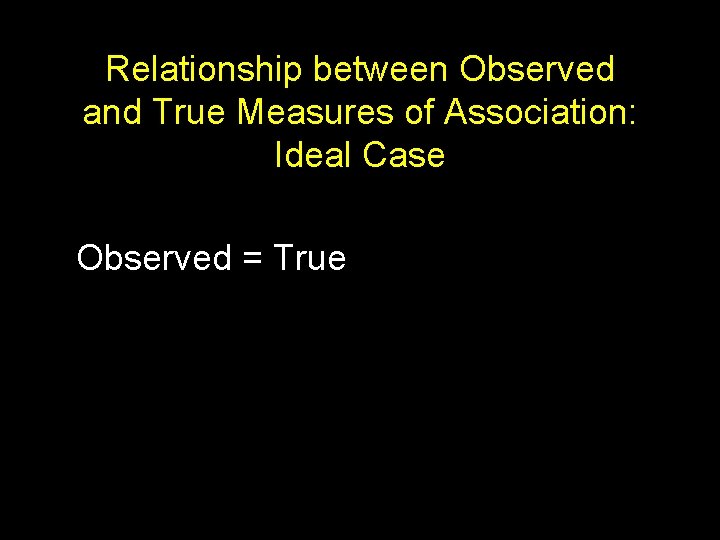
Relationship between Observed and True Measures of Association: Ideal Case Observed = True
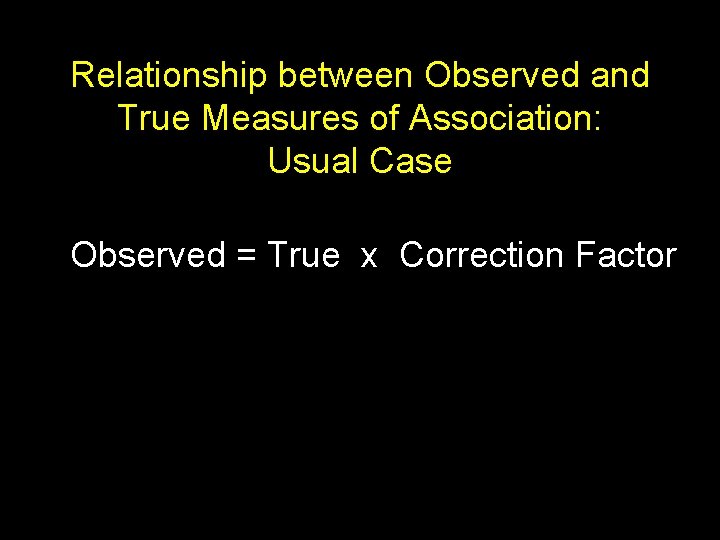
Relationship between Observed and True Measures of Association: Usual Case Observed = True x Correction Factor
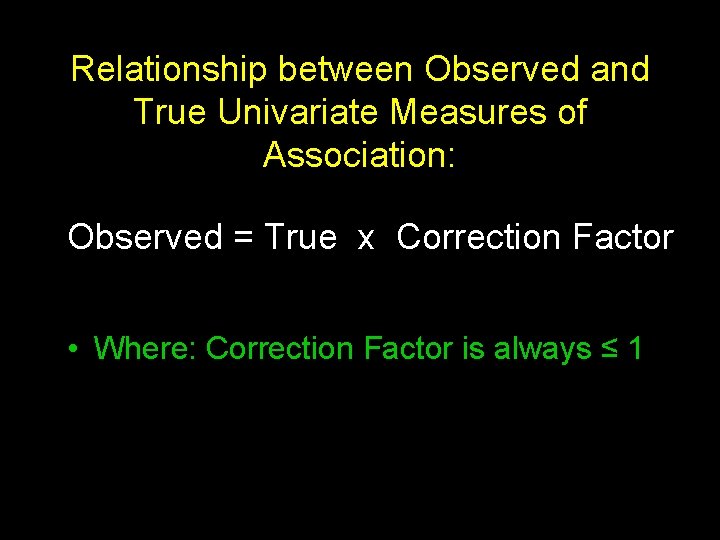
Relationship between Observed and True Univariate Measures of Association: Observed = True x Correction Factor • Where: Correction Factor is always ≤ 1
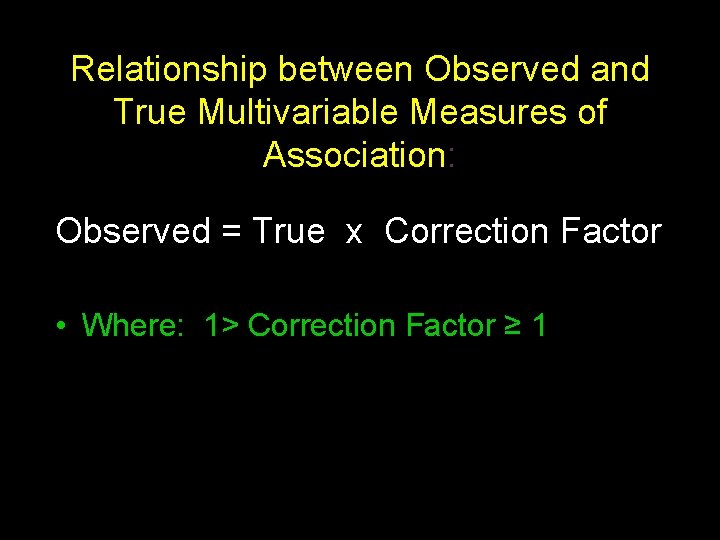
Relationship between Observed and True Multivariable Measures of Association: Observed = True x Correction Factor • Where: 1> Correction Factor ≥ 1
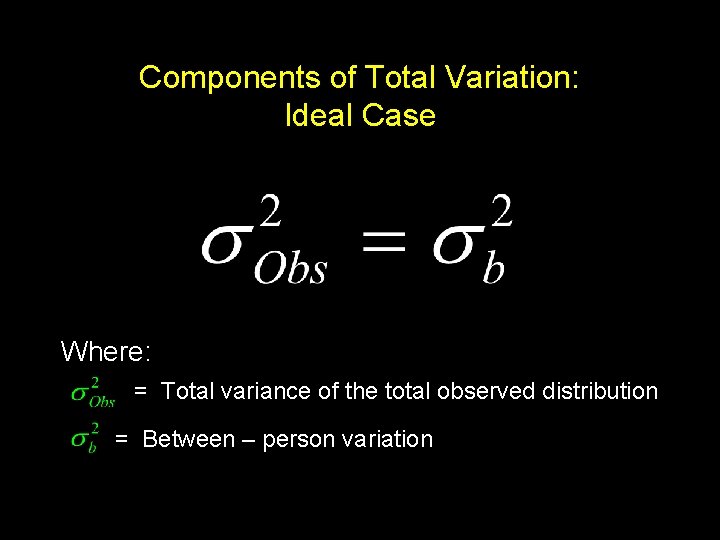
Components of Total Variation: Ideal Case Where: = Total variance of the total observed distribution = Between – person variation
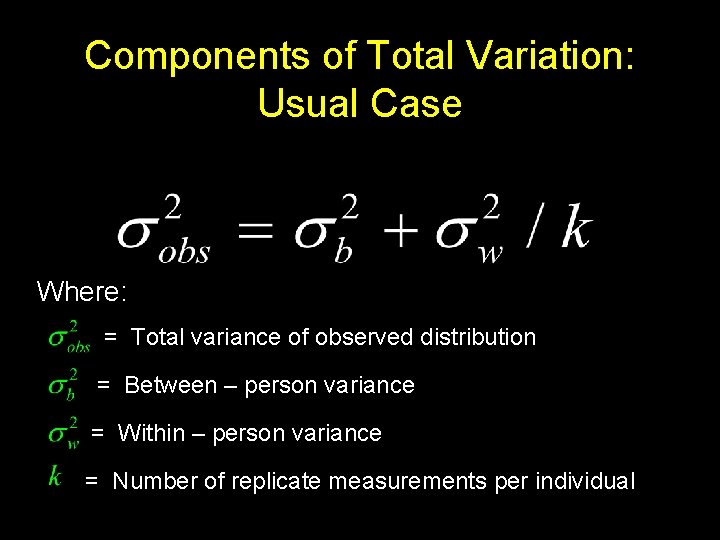
Components of Total Variation: Usual Case Where: = Total variance of observed distribution = Between – person variance = Within – person variance = Number of replicate measurements per individual
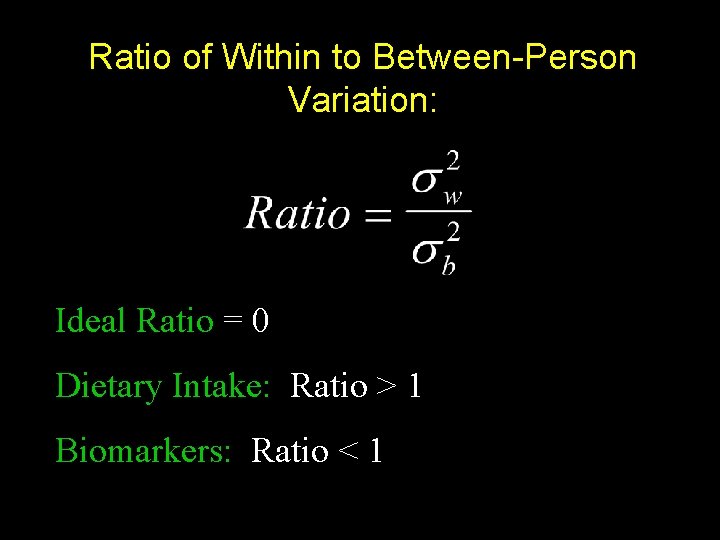
Ratio of Within to Between-Person Variation: Ideal Ratio = 0 Dietary Intake: Ratio > 1 Biomarkers: Ratio < 1
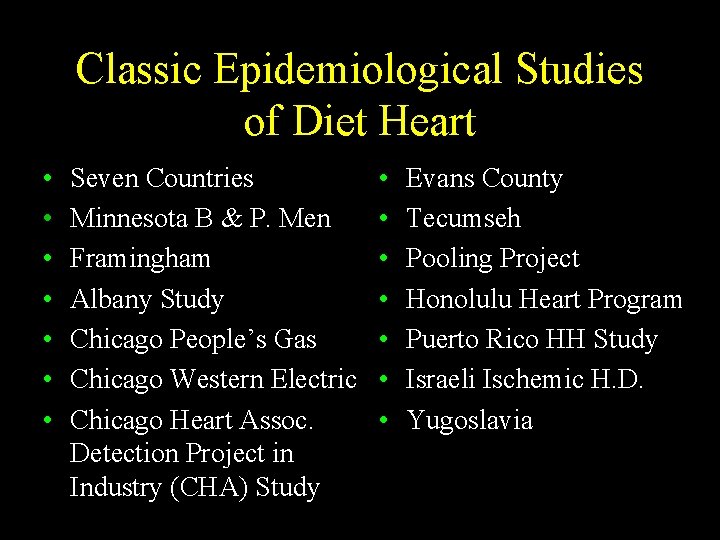
Classic Epidemiological Studies of Diet Heart • • Seven Countries Minnesota B & P. Men Framingham Albany Study Chicago People’s Gas Chicago Western Electric Chicago Heart Assoc. Detection Project in Industry (CHA) Study • • Evans County Tecumseh Pooling Project Honolulu Heart Program Puerto Rico HH Study Israeli Ischemic H. D. Yugoslavia
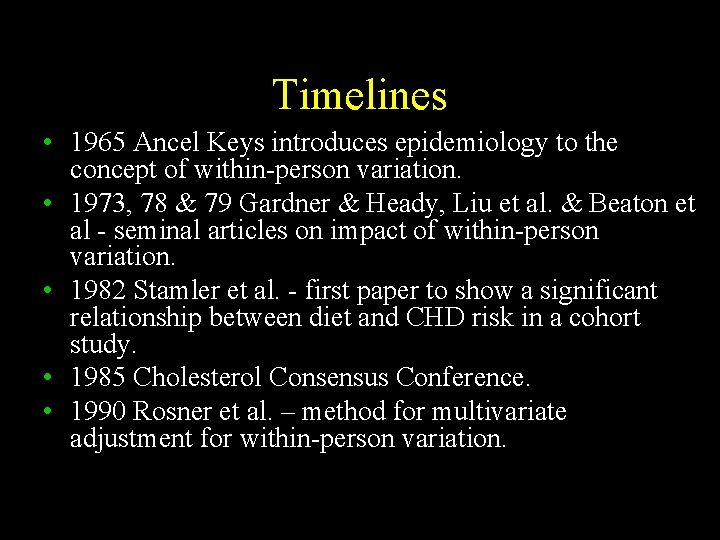
Timelines • 1965 Ancel Keys introduces epidemiology to the concept of within-person variation. • 1973, 78 & 79 Gardner & Heady, Liu et al. & Beaton et al - seminal articles on impact of within-person variation. • 1982 Stamler et al. - first paper to show a significant relationship between diet and CHD risk in a cohort study. • 1985 Cholesterol Consensus Conference. • 1990 Rosner et al. – method for multivariate adjustment for within-person variation.
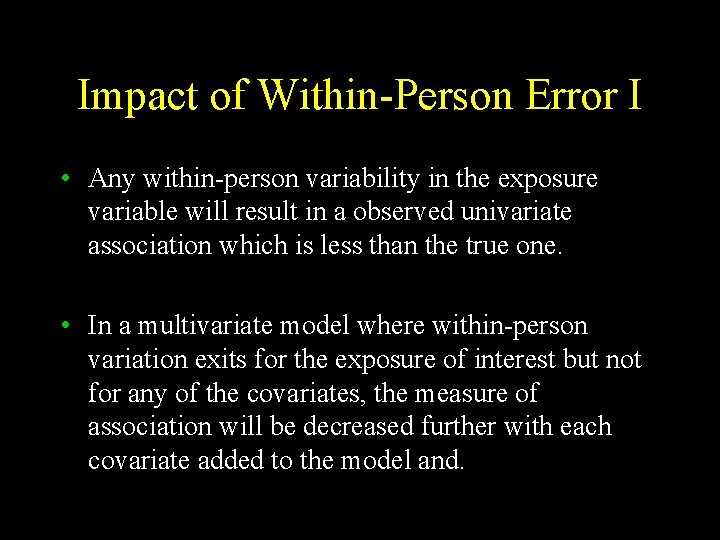
Impact of Within-Person Error I • Any within-person variability in the exposure variable will result in a observed univariate association which is less than the true one. • In a multivariate model where within-person variation exits for the exposure of interest but not for any of the covariates, the measure of association will be decreased further with each covariate added to the model and.
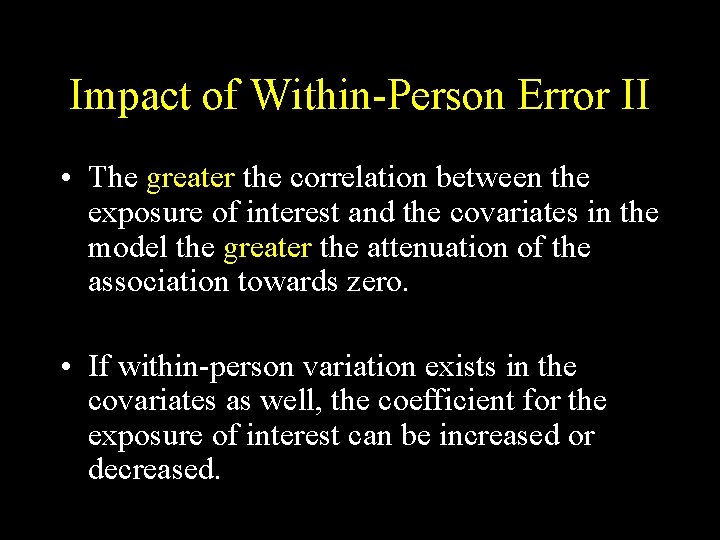
Impact of Within-Person Error II • The greater the correlation between the exposure of interest and the covariates in the model the greater the attenuation of the association towards zero. • If within-person variation exists in the covariates as well, the coefficient for the exposure of interest can be increased or decreased.
Mc. Gee D, et al. J Chron Dis 1984; 37: 713 -719. Page 718.
Mc. Gee D, et al. J Chron Dis 1984; 37: 713 -719. Page 718.
Mc. Gee D, et al. J Chron Dis 1984; 37: 713 -719. Page 718.
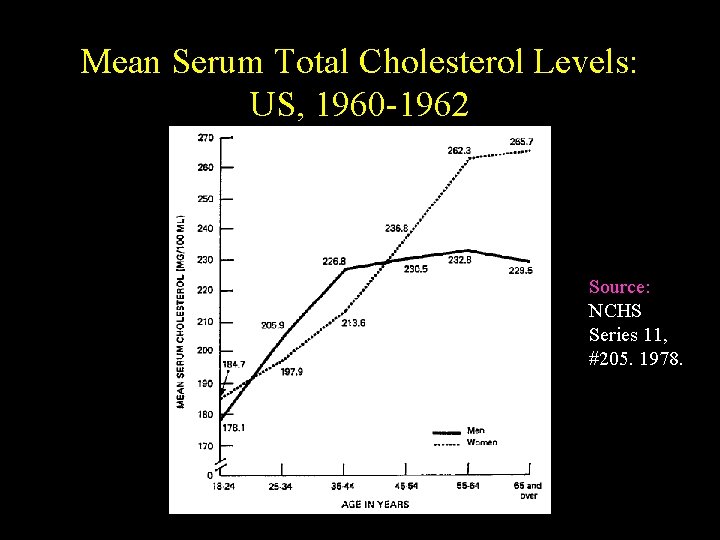
Mean Serum Total Cholesterol Levels: US, 1960 -1962 Source: NCHS Series 11, #205. 1978.
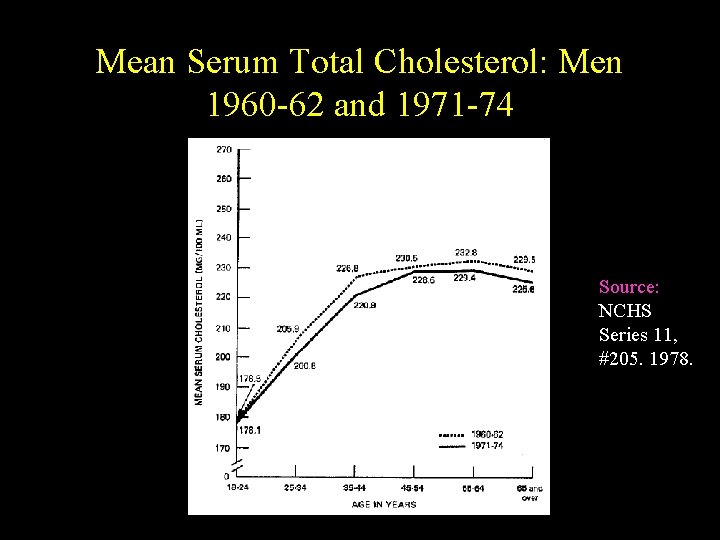
Mean Serum Total Cholesterol: Men 1960 -62 and 1971 -74 Source: NCHS Series 11, #205. 1978.
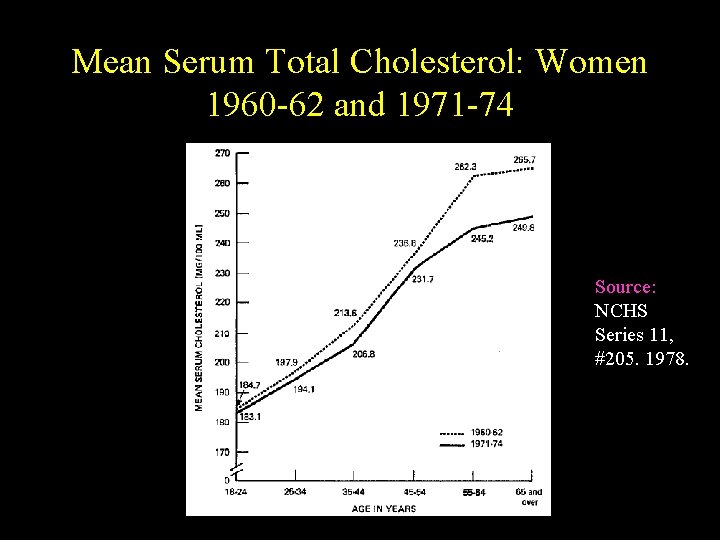
Mean Serum Total Cholesterol: Women 1960 -62 and 1971 -74 Source: NCHS Series 11, #205. 1978.
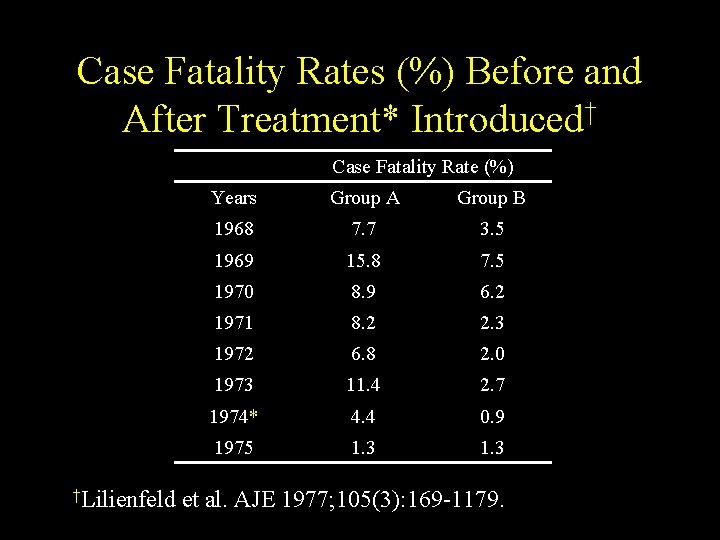
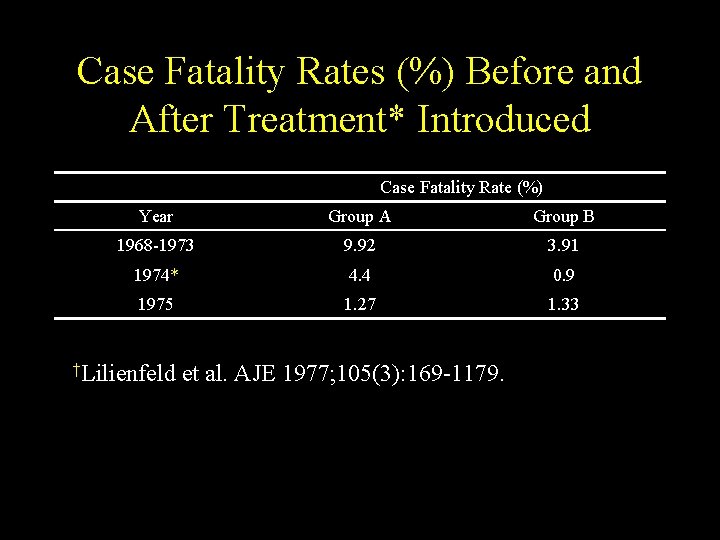
Case Fatality Rates (%) Before and After Treatment* Introduced† Case Fatality Rate (%) †Lilienfeld Years Group A Group B 1968 7. 7 3. 5 1969 15. 8 7. 5 1970 8. 9 6. 2 1971 8. 2 2. 3 1972 6. 8 2. 0 1973 11. 4 2. 7 1974* 4. 4 0. 9 1975 1. 3 et al. AJE 1977; 105(3): 169 -1179.
Case Fatality Rates (%) Before and After Treatment* Introduced Case Fatality Rate (%) Year Group A Group B 1968 -1973 9. 92 3. 91 1974* 4. 4 0. 9 1975 1. 27 1. 33 †Lilienfeld et al. AJE 1977; 105(3): 169 -1179.
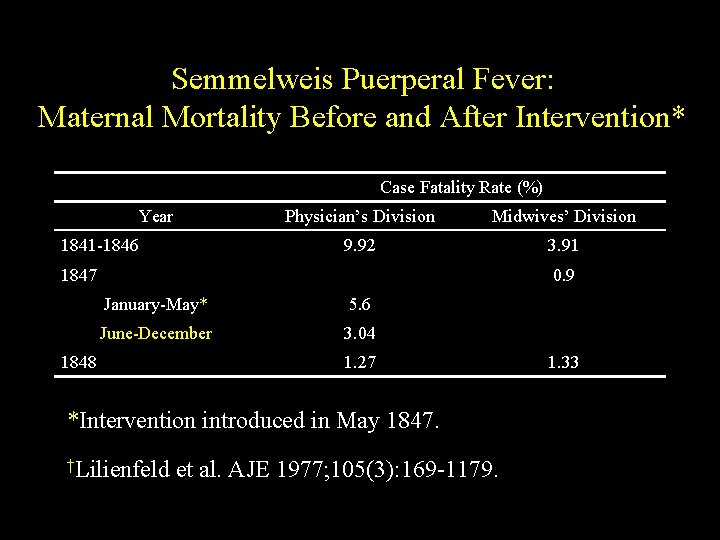
Semmelweis Puerperal Fever: Maternal Mortality Before and After Intervention* Case Fatality Rate (%) Year 1841 -1846 Physician’s Division Midwives’ Division 9. 92 3. 91 1847 0. 9 January-May* 5. 6 June-December 3. 04 1848 1. 27 *Intervention introduced in May 1847. †Lilienfeld et al. AJE 1977; 105(3): 169 -1179. 1. 33