Design of support system for surge shaft and


 Upstream wall and (B)")


- Slides: 22
Design of support system for surge shaft and powerhouse complex using FLAC 3 D B H Vijay Sekar, Dr. Sripad R Naik and Dr. Rabi Bhusan Presented by B H Vijay Sekar Scientist Numerical Modelling Department National Institute of Rock Mechanics Bengaluru, Karnataka, India Web: www. nirm. in
Salient Features Country : India Installed capacity : 60 MW Diversion structure : Barrage of 18. 5 m height Desilting chamber : 1 No. , 130 m (L) x 25 m (W) x 13. 5 m (H) Head race tunnel : Modified Horseshoe shape, dia. 5. 6 m, 4342 m (L) Surge shaft : dia. 20 m, Height 67. 5 m Pressure shaft : dia. 4 m and length 154 m (L) Machine hall cavern (MH) : 58 m (L) × 18. 8 m (W) × 33. 70 m (H) Transformer hall cavern (TH) : 73. 11 m (L) × 12. 2 m (W) × 13. 65 m (H) Rock pillar between MH & TH : 35 m Tail race tunnel : D- shaped, dia. 8 m and 235. 62 m (L)
Objective The primary objective of the study was to suggest suitable support system for surge shaft, machine hall cavern and transformer hall cavern Geology of the area v The rock mass in the surge shaft and powerhouse complex consists of mainly metamorphic rock variants i. e. Porphyroblastic Gneiss, Biotite Gneiss, Quartzite Biotite Schist and Basic Rock. v The rock mass in general is highly foliated and sheared. v A drift having a length of about 327 m reaching crown of powerhouse has been excavated. v The powerhouse location was explored by seven drill holes.
Layout Plan
Photograph showing Powerhouse Drift Portal
Geological plan of powerhouse complex
Geological section from surge shaft to powerhouse
Rock variants and their thickness considered in the model S. No. 1 2 3 4 5 6 7 8 9 10 11 12 Rock Type* Basic Rock Fractured Rock Shear Fractured Rock Biotite Gneiss Shear Biotitie Schist Shear Porphyroblastic Gneiss Thickness (m) 5 2. 5 0. 8 4 0. 5 5 10 4. 5 20 1 1. 4 Elevation (m) 1283. 70 1278. 20 1275. 30 1260. 00 1250. 76 1235. 82 1218. 00 1205. 00 1190. 42 Projection Encountered Surge Shaft Pressure Shaft Powerhouse Cavern Host Rock * Rock variants are considered to be parallel to foliation (300/N 0200 )
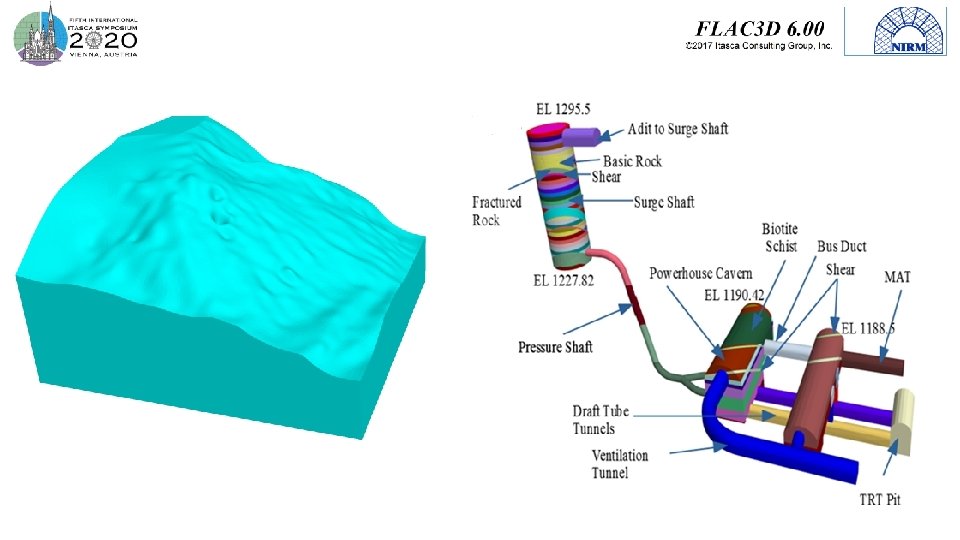
Geology considered in FLAC 3 D model
In-situ stress data v Hydraulic fracture method has been used to determine the in-situ stresses. Principal Stresses Vertical stress ( v) in MPa (for Overburden cover of 164. 5 m, density of rock 2. 7 gm/cc) Maximum horizontal principal stress (σH) in MPa Minimum horizontal principal stress (σh) in MPa Maximum horizontal principal stress direction KH = (σH)/ σv Kh = (σh)/ σv 4. 35 5. 38 2. 68 N 40° 1. 24 0. 62 v Maximum horizontal principal stress direction is N 40°and the longitudinal axis of the powerhouse caverns is N 45°
Material properties considered in model Parameters Units Porphyr- Biotite Basic Fractured oblastic Gneiss Schist Rock Shear Gneiss Uni-axial compressive strength UCS MPa 50 42. 24 61. 44 40. 32 Geological strength index GSI 52 45 51 36 32 20 Elastic Young’s modulus of intact Ei rock GPa 22. 85 21. 24 24. 75 18. 54 Poisson’s ratio Density ν γ kg/m 3 0. 24 2750 0. 26 2600 0. 27 2600 0. 21 2200 0. 21 1800 mi 20 28 12 12 Disturbance Factor D=0 Elastic Young's modulus of rock mass Erm GPa 7. 9 4. 7 8 2. 2 1. 7 0. 7 Cohesion c MPa 0. 829 0. 725 0. 839 0. 483 0. 44 0. 253 Friction angle φ Deg 53. 64 53. 25 50. 69 43. 31 41. 9 39. 89 Disturbance Factor D=0. 8 Elastic Young's modulus of rock mass Cohesion Friction angle Erm GPa 2. 37 1. 43 2. 41 0. 7 0. 65 0. 47 c φ MPa Deg 0. 540 44. 83 0. 466 42. 83 0. 509 41. 55 0. 27 30. 42 0. 24 28. 19 0. 11 23. 31
Excavation sequence considered in model Stage Components 1 Surge shaft excavated at 2 m depth intervals from EL 1295. 5 to EL 1227. 82 2 Pressure shaft excavation 3 Pressure shaft manifold and unit penstocks 4 Ventilation tunnel to Powerhouse crown and Transformer hall crown Powerhouse Cavern Transformer Hall Cavern From EL (m) To EL (m) 5 Crown 1190. 42 1185. 40 1188. 50 1185. 50 6 Crown 1185. 40 1182. 95 - - 7 Excavation of Main Access Tunnel to PH & TH 8 Bench 1 1182. 95 1181 1185. 50 1181 9 Bench 2 1181 1175. 35 1181 1174. 88 10 Bench 3 1175. 35 1167. 95 - - 11 Bench 4 1167. 95 1162. 55 - - 12 Bench 5 1162. 55 1154. 30 - - 13 TRT Gates excavation 14 Draft Tubes & TRT excavation 15 TRT Pool/Chamber excavation
Support system considered in the model Component Support System Surge shaft 8 m long 32 mm dia. Fe 500 rock bolts at 1. 5 m c/c (staggered) 100 mm thick steel fiber reinforced shotcrete (SFRS) Powerhouse crown 6. 5 m long 32 mm dia. Fe 500 rock bolts at 1. 7 m c/c (staggered) 150 mm thick SFRS Powerhouse walls 6. 5 m & alternatively 10 m long 32 mm dia. Fe 500 rock bolts at 1. 7 m c/c (staggered) 150 mm thick SFRS Transformer hall crown & walls 5 m long 32 mm dia. Fe 500 rock bolts at 1. 5 m c/c (staggered) 150 mm thick SFRS Penstocks, draft tubes, ventilation tunnels & Main access tunnels 3 m long 25 mm dia. Fe 500 rock bolts at 1. 5 m c/c (staggered) 100 mm thick SFRS TRT pit 4. 5 m long 32 mm dia. Fe 500 rock bolts at 1. 5 m c/c (staggered) 100 mm thick SFRS
Displacement contours A B Displacement contours of powerhouse cavern (A) Upstream wall and (B) Downstream wall
Displacement contours at RD 15 m from PH cavern after complete excavation
Maximum and minimum principal stress tensors A B Principal stress tensors at RD 30 m from machine hall cavern (A) Maximum principal stress and (B) Minimum principal stress
Yield zone extent RD 0 5 m 10 m 15 m 20 m 25 m 30 m 35 m 40 m 45 m 50 m 55 m 58 m Upstream (m) 2. 2 6. 73 10 12 11. 8 8. 2 8. 4 5. 6 6. 2 3. 2 Crown (m) 2 2 3. 1 5. 03 5. 5 5 3. 27 2 2. 7 3. 5 2. 54 3. 8 2 Downstream (m) 2 2. 5 5. 33 6 6. 9 8. 7 7. 7 4. 2 2. 4 4 5 2 4 Remarks Draft tube and unit penstock intersection area on d/s and u/s wall
Distribution of Axial force in rock bolts
Conclusions v. The support system considered for the excavations is found to be satisfactory. v. Fractured rock and shear zone material bands had considerable influence on the displacement pattern of surge shaft and on the crown and walls of machine hall cavern. Higher displacements of the magnitude 36 to 48 mm are observed at these locations. v. At intersections where surge shaft and machine hall cavern excavation fall in fractured rock and shear zone, the spread of yield zone is more. At these places consolidation grouting may be carried out to a depth of about 8 -10 m, to improve the rock mass parameters. v. The length of rock bolts needs to be increased to 8 m near the junctions of unit penstocks, draft tube tunnels and at other tunnel junctions.
Conclusions v. The orientation of the rock bolts must be decided based on the actual field conditions. v. Proper instrumentation plan needs to be implemented to capture the behavior of the rock mass surrounding the surge shaft, powerhouse complex and also to quantify the performance of the support system. Back analysis of the model has to be carried out if the displacement values differ from the predicted value during the excavation stage. v. In addition to regular instruments for measuring the displacement and loads, crack meters may be installed across shear joints and monitored regularly in order to assess the behavior of the shear joints. v. Further optimization of the supports can be done during the construction stage based on the instrument observations of parameters like wall displacements, convergence and load on the rock bolts etc.
Thank You