Cohort and Casecontrol Research RISK A predictive concept

 n Or Rate of")
 • Cumulative incidence(including \"attack rate\")")

? n Uses of")


")
 =AFe =")
 n n n INDIVIDUAL")

 n Attributable risk AR=Ie-Io =90/100000")


 · Sampling from defined population, or ·")


. Measurements analyzed:")


 OBSERVATIONAL SURVEYS n n n Grouping studied: \"cross-section\" of a defined population.")


/(20/20+60) =(80/120)/(20/80)=2. 67 n INCORRECTLY assuming that the")


= chance exposure occurred / chance it didn't.")

/(400000/600000) = (800 X 600000)/(200 X 400000) = AD/BC")

 AS ESTIMATE OF RELATIVE RISK (RR) n For a rare")


 BIAS An innocent exposure may become suspect if, rather than causing a")


 BIAS A late look at those exposed (or affected) early will miss:")


- Slides: 66
Cohort and Case-control Research
RISK A predictive concept Risk = n Prospective chance (probability) n Or Rate of occurrence (incidence) n Of a health- related event.
MEASURES OF RISK • Incidence density (including mortality rate) • Cumulative incidence(including "attack rate") • Case-fatality rate • Survival rate
MEASURES OF OTHER THINGS ·Prevalence. Example HIV ·Mean duration ·Proportions exposed ·Life-expectancy
RISK FACTORS How do we identify risk factors (or prognostic factors)? n Uses of risk factors (or prognostic factors) n Relation of risk measures to interventions n
Examples “It is estimated that smoking is responsible for 100, 000 deaths from lung cancer annually”. n Underinflated tires were responsible for 40 deaths last year. n
Names, Questions, Definitions/other Formulae, Use n n Relative Risk: RR=Ie/Io (strength, perhaps cause, the only index you need to prove causality) Attributable Risk: AR=Ie-Io (impact). Sometimes called Individual AR. Why? Attributable Risk %: Attributable Fraction. Also sometimes called Individual AR% or IAF AR%= (Ie-Io)/Ie = (RR-1)/RR
Formulae Contd. Population Attributable Risk PAR=It -Io=AR*Pe n It can be calculated =Ie*Pe+Io*(1 -Pe) n Population Attributable Risk % PAR% or PAF =(It-Io)/It = Pe(RR-1)/[Pe(RR-1)+1] n Compare n
"ATTRIBUTABLE" FRACTIONS Impact measures determined by RR n Individual level (exposed person) =AFe = AR% = 100 [(RR-1)/RR] n Community level (mixture of exposed and unexposed persons) = AFp=PAR%=Pe (RR-1)/[PE (RR - 1)+1]
"ATTRIBUTABLE" RISKS IMPCT MEASURES NOT DETERMINED BY RR (Dimensions, Units) n n n INDIVIDUAL LEVEL AR = ARI = RD = CI 1 - CI 0 OR ID 1 - ID 0 COMMUNITY LEVEL ARP = PAR = PE x AR, WHERE PE IS PROPORTION EXPOSED "NUMBER NEEDED TO TREAT" = N = 1/AR
Mortality from Lung Cancer in Smokers n n Death rate from lung cancer in smokers 100 /100, 000 Death rate from lung cancer in non smokers 10 /100000 Prevalence of smoking 60% Death rate from lung cancer in the US 64/100000
Lung Cancer Relative Risk. RR=Ie/Io =10 (measure of strength) n Attributable risk AR=Ie-Io =90/100000 (impact) n Attributable risk% (AR%)= [(RR-1)/RR]*100% = 90% or = [(Ie-Io)/Ie]*100% = 90% n
Relative risk n n n RR = 13 means there is a 13 fold increase RR = 1. 3 means there is a 30 % increase in risk RR = 1. 13 means there is a 13 % increase in risk
Lung Cancer n n n Population Attributable Risk PAR= It-Io= AR*Pe We can calculate It=Ie*Pe+Io(1 -Pe)= 64/100000 PAR = 54/100000 Population Attributable Risk % PAR% =[(It-Io)/It]*100 = 54 per 100 K / 64 per 100 K = 84% Or PAR%=[( Pe(RR-1) / [Pe(RR-1)+1]
EXAMPLE n n In an infectious hepatitis outbreak, a community experiences a total attack rate of 5%. However, the attack rate is 9% among the half of the community's population with known exposure to a contaminated milk supply, and 1% in the rest of the community.
Cont. Calculate the relative risk, and different attributable risks, which describe the magnitude of statistical association between hepatitis and exposure to contaminated milk.
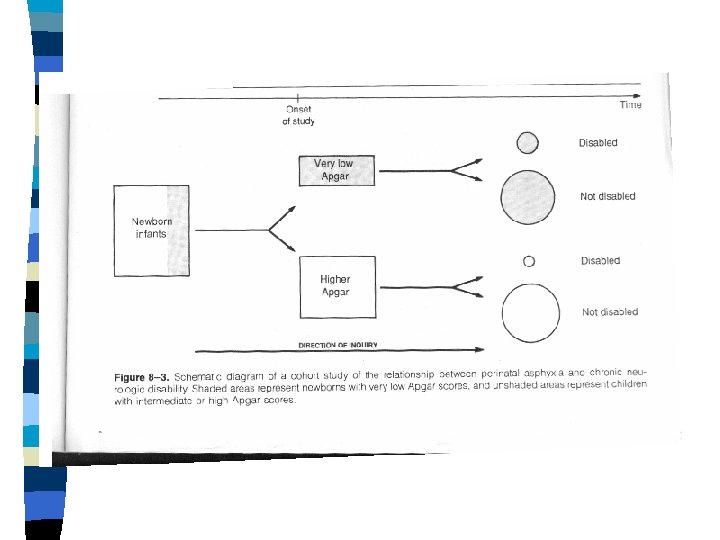
COHORT OBSERVATIONAL STUDIES n n n GROUPING STUDIED: • "Exposed" vs. "Unexposed" groups MEASUREMENTS ANALYZED: • New disease "outcomes" occurring over time EXCLUSION OF “PREVALENT” CASES
Cohort Study
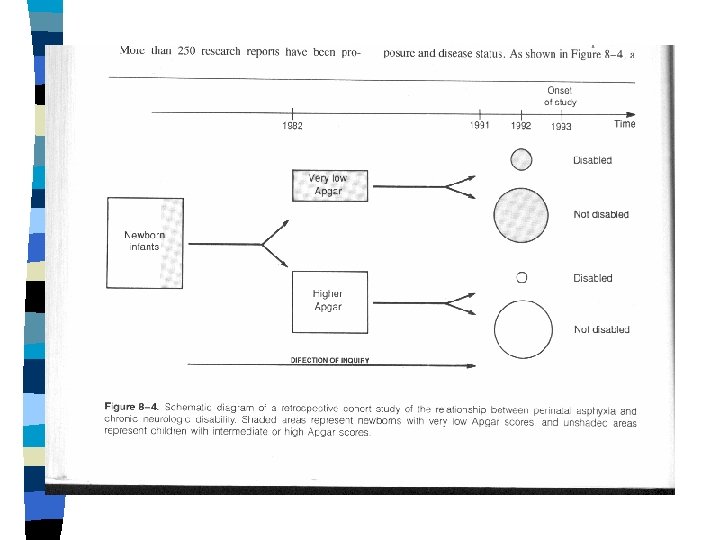
Cohort cont. n n n Basal cohort(s) · Sampling from defined population, or · Stratified assembly, or · Matched assembly Observation for defined period under specified observational protocol Time of data collection: prospective vs. Retrospective cohort studies
DATA FROM A COHORT STUDY WITH COUNT DENOMINATORS TOTAL EXPOSURE YES EXPOSURE NO X Y DISEASE YES NO a c b d INC. a/X c/Y
DATA FROM A COHORT STUDY WITH COUNT DENOMINATORS TOTAL EXPOSURE YES EXPOSURE NO X Y DISEASE YES NO a c INC. a/X c/Y
DATA FROM A COHORT STUDY WITH PERSON-TIME DENOMINATORS DISEASE EXPOSURE YES EXPOSURE NO YES a c NO - PERSON-TIME INC. UNITS PY 1 PY 0 a/ PY 1 c/ PY 0
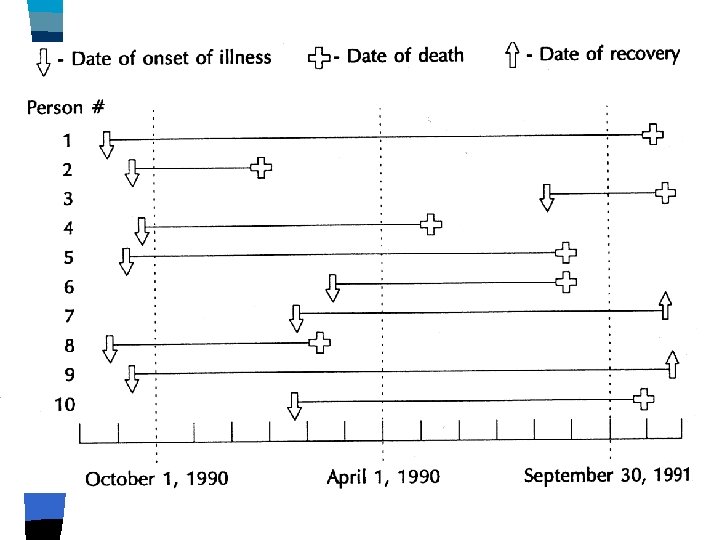
Account for: n n n Recruitment Loss to follow-up End of study Death Developing immunity (time to first event) Duration of illness
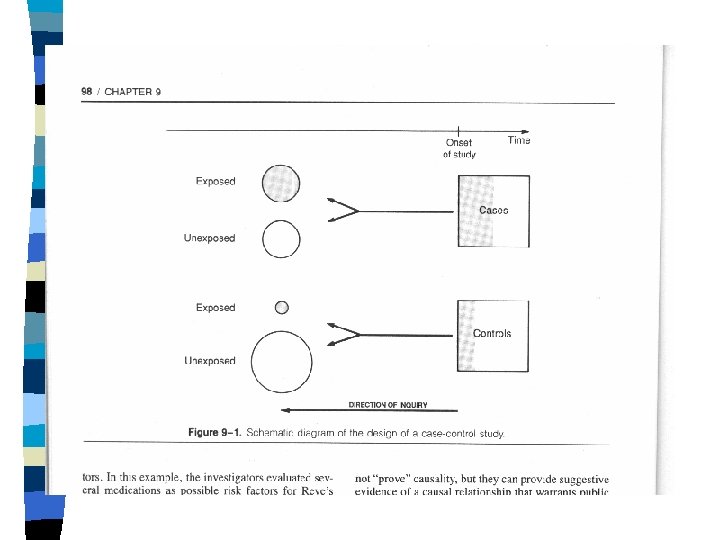
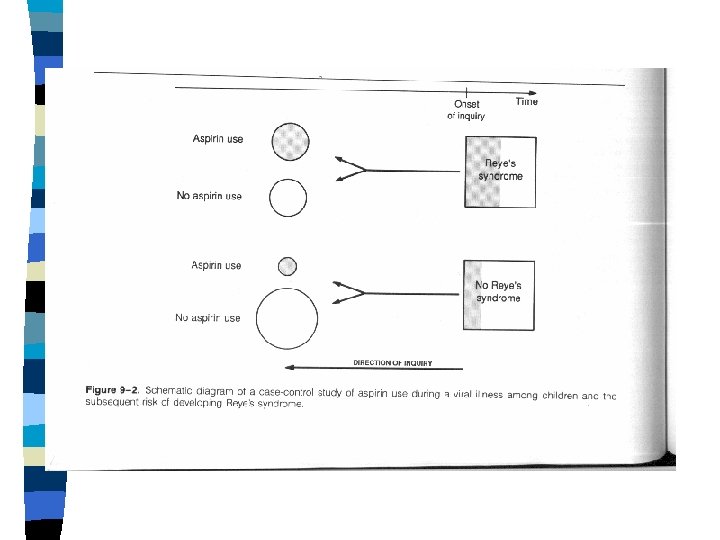
CASE-CONTROL OBSERVATIONAL STUDIES n n n Grouping studied: "cases" vs. "Control" group(s). Measurements analyzed: past "exposures. " Case-selection usually clinic- or hospitalbased. Controls may also be clinic- or hospitalbased, or population-sampled. Controls may be unmatched, groupmatched, or individually matched.
Case-control cont. n Parallel, standardized acquisition of exposure information from cases and controls, from. · Medical records. · Standardized interviews. · Interviewer blinding, where possible.
DATA FROM A CASE-CONTROL STUDY TOTAL DISEASE YES NO X Y EXPOSURE YES EXPOSURE NO a c b d
CROSS-SECTIONAL (PREVALENCE) OBSERVATIONAL SURVEYS n n n Grouping studied: "cross-section" of a defined population. Measurements analyzed: current disease status current factors which may contribute to or prevent disease. Measurements of factors (exposures) and disease are simultaneous, though information about exposure histories may also be gathered.
Cross sectional cont. n n n Time ordering is problematic. BUT, what is a disease and what is an exposure is usually obvious. Analysis of data is exploratory: measures of association. Examples: National health interview survey national health and nutrition examination surveys.
FOUR STUDENTS n Four Ph. D. students were given data from a case control study and were asked to calculate the relative risk
Data Cases Exposed 80 Not Exposed 20 Controls 40 60
Student 1 used the equation: RR=Ie/Io =(80/80+40)/(20/20+60) =(80/120)/(20/80)=2. 67 n INCORRECTLY assuming that the incidence was known. n
Student 2 n Student 2 correctly noted that from the original data you cannot calculate the incidence of the disease, so relative risk cannot be calculated.
Student 3 n Student 3 surveyed the ENTIRE population for new cases within that time creating a data set which was both a case-control study and a cohort study. Cases Controls Exposed 800 400000 Not Exposed 200 600000 n RR =(800/400800) /(200/600200)= 5. 99 n Note that this (TRUE) RR is very different from the erroneous one.
Student 4 n Odds = chance event happens /chance it doesn't. = probability of event /[1 -(probability of event)] = p/(1 -p).
Probability and Odds n n Probability – 0. 40 chance of dying over 1 yr Odds – 4: 6 odds of dying over one year (also written 2: 3 or 0. 67) Odds/(1+Odds) = Probability Ex: 0. 67/(1+0. 67) = 0. 40 Probability/(1 -Probability) = Odds Ex: 0. 40/(1 -0. 40) = 0. 40/0. 60 = 0. 67
Probability and Odds Probability Odds – Never > 1 – Never < 0 n n n Probability = 0. 90 Probability = 0. 50 Probability = 0. 40 Probability = 0. 10 Probability = 0. 01 Probability = 0. 001 – Can be > 1; < 1 – Never < 0 n n n Odds = 9 Odds = 1 Odds = 2/3 Odds = 1/999
ODDS-RATIO Exposure odds (case-control study)= chance exposure occurred / chance it didn't.
Student 4 n n 800/200 Is the odds of exposure among cases 400000/600000 is the odds of exposure among the controls (800/200)/(400000/600000) is the ratio of the odds of exposure in cases to the odds of exposure in controls. He called it the odds ratio (OR)
Student 4 n n n (800/200)/(400000/600000) = (800 X 600000)/(200 X 400000) = AD/BC OR is always AD/BC The true RR = (800/400600)/(200/600200) = [(800 X 600200)/(200 X 400600)] is very close to (800 X 600000)/(200 X 400000)=6. That is to say when the number of controls is so large AD/BC works about the same as RR. Also noted that none of these 3 parameters changed after collecting the population data. OR was already available and accurate.
Student 4 said that although the relative risk cannot be directly calculated from the given data, it can be accurately estimated using the odds ratio: OR=(80 X 60)/(20 X 40)=6
CASE-CONTROL STUDIES: ODDSRATIO (OR) AS ESTIMATE OF RELATIVE RISK (RR) n For a rare disease, or short observation time (which makes the disease effectively rare), the oddsratio (OR) approximates RR.
OR contd. n n n Once we have estimated RR from a casecontrol study, we may also estimate the individual attributable fraction using AFi = AR%=[(RR-1)/RR]*100% And the population attributable fraction using AFp = ARp/It = Pe. ARi/It =Pe(Ie-Io) / [Pe. Ie+(1 Pe)Io]=Pe(RR-1) /Pe(RR-1)+1 Where do we get Pe ? Pe is NOT the prev of the disease!!
When do we use odds ratio n n We use OR if we have to. If we can calculate RR we don’t use OR We have to use OR in case-control studies and in logistic regression. We should never use OR in a food poisoning outbreak. Why ?
Case-Control Studies Within a Cohort n n n Why would you do a case-control study if you have a cohort? In ARIC (Atherosclerosis Risk in Communities) study, a cohort of 16 thousand men, all men provided serum samples at the outset which were saved. The cohort is observed for CHD.
ARIC n n After 5 years we have 246 cases of CHD. We randomly choose 500 participants to be controls. We only measure Chlamydia antibody in the stored sera from these 246 + 500 subjects. We compare the cases (CHD) to the controls (no CHD) with regard to the presence of exposure (Chlamydia) which preceded the outcome.
Case-Control Studies Within a Cohort n n n Can be done in any clinical trial. Where the outcome is any outcome that the study has data on (not necessarily the primary outcome). As long as you have “serum samples” from everyone.
Case-Control Studies Within a Cohort n n 1. AKA hybrid designs, ambidirectional designs. Two ways to select controls A random sample of the total cohort at baseline (some controls maybe cases). termed Case-Cohort design
2. Nested Case-Control n n Controls are a random sample of the cohort at the time each case occurs. A control for an earlier case may end up being a case. That is OK.
Case-control study within a cohort n n Why? Case-cohort study: controls are from the baseline cohort Nested case-control: a control is chosen from members at risk at time of case Both may include or exclude from controls individuals who develop disease.
UNMASKING (DETECTIONSIGNAL) BIAS An innocent exposure may become suspect if, rather than causing a disease, it causes a sign or symptom which leads to a search for the disease.
ODDS-RATIOS FOR EXPOSURE TO POSTMENOPAUSAL ESTROGENS AND ENDOMETRIAL CANCER: TWO STUDIES AT THE SAME INSITUTION TUMOR REGISTRY ENDOMETRIAL CANCER ESTROGENS YES NO TOTAL n YES 45 72 117 NO 7 110 117 TOTAL 52 182 234 OBSERVED ODDS-RATIO 9. 8
D&C/HYSTERECTOMY REGISTRY n ENDOMETRIAL CANCER YES NO TOTAL Estrogen 59 42 101 No Estrogen 89 106 195 Total 148 296 ODDS RATIO 1. 7
EXPOSURE-SUSPICION BIAS A knowledge of the patient's disease status may influence: Both the intensity and outcome of a search for exposure to the putative cause.
DIAGNOSTIC SUSPICION BIAS A knowledge of the subject's prior exposure to a putative cause (ethnicity, taking a certain drug, having a second disorder, being exposed in an epidemic) may influence: Both the intensity and the outcome of the diagnostic process.
RECALL BIAS Questions about specific exposures: May be asked several times of cases, but only once of controls. Also, cases are more likely than controls to remember exposures, even minor ones, that are unusual or that have been linked with disease in the popular press.
Recall bias cont. For example, in one study women were interviewed after a pregnancy about prior drug usage. The proportions of mothers who reported previously unrecorded exposures to drugs were 20% among mothers whose pregnancies had terminated normally but 28% among mothers who had miscarried or whose child had a birth malformation
PREVALENCE-INCIDENCE (NEYMAN) BIAS A late look at those exposed (or affected) early will miss: Fatal and other short episodes, plus mild or silent cases and cases in which evidence of exposure disappears with disease onset.
COHORT VS. CASE-CONTROL STUDIES OF CHD VS. CHOLESTEREMIA AMONGHAM MEN UPPER QUARTILE SERUM CHOLESTEROL COHORT STUDY CASE-CONTROL STUDY CHD BY EXAM 6 YES 85 NO 116 TOTAL 201 NO 462 1511 1973 ODDS-RATIO = 2. 40 CHD BY EXAM 6 TOTAL 547 1627 2174 YES 38 113 151 NO 34 117 151 TOTAL 72 230 302 ODDS-RATIO = 1. 16
VOLUNTEER BIAS n Volunteers or 'early comers' from a specified sample may exhibit exposures or outcomes which differ from those of non-volunteers or 'late-comers'.
A COHORT STUDY OF RECURRENT MI BY PARTICIPATION IN A GRADUATED EXERCISE PROGRAM FOLLOWING INTITIAL MI RECURRENT MI YES NO TOTAL PARTICIPATION IN GRADUATED EXERCISE PROGRAM YES 7 59 66 NO 18 46 64 TOTAL 25 105 130 RELATIVE RISK = 0. 38
A RANDOMIZED CLINICAL TRIAL OF ENDURANCE TRAINING FOR PREVENTION OF RECURRENT MI YES NO ENDURANCE TRAINING YES 28 359 No 21 345 TOTAL 49 704 RELATIVE RISK = 1. 26 TOTAL 387 366 753