
Let Icarus Fly Multiple Measures Assessment and the






- Slides: 80
Let Icarus Fly: Multiple Measures, Assessment, and the Reimagination of Student Capacity Oregon Placement Work Group October 23, 2015 John J. Hetts, Ph. D. Senior Director of Data Science Educational Results Partnership jhetts@edresults. org @jjhetts #Let. Icarus. Fly
Overview • Standardized assessment has led us to systematically and substantially underestimate student capacity • Particularly for students of color, low income students, first generation college students, women • Evidence-based, multiple measures is one of four key cornerstones on which to rebuild the foundations of community college education • Demonstrates fundamental capacity of far more of our students to succeed if given the chance • Powerful completion, equity, and real world implications • Based powerfully both on basic principles of assessment and measurement as well as strong
First, Daedalus and Icarus • Daedalus crafted the labyrinth of inescapable complexity for King Minos • To escape from Minos, Daedalus built wings of feather and wax for his son Icarus and himself • Don’t fly too high, lest sun melt the wax and you plummet to your doom • • Dangers of innovation/invention, hubris, Importance of knowing your limits, listening to your wiser elders • But most of us forget the rest of that story…
Transition to College: Assessment and Placement • Community colleges are open enrollment institutions • Requires assessing and planning for educational needs of students. • Goal • Effectively place student at most appropriate level for their skill – where challenge matches skill level • • Zone of proximal development Optimal performance, flow • If you think you can catch the bus, you will run for it. ” • Lee Peng Yee, Singapore National Institute of Education Mathematician
Community college student transition • Community colleges rely nearly entirely on standardized assessment (West. Ed, 2011) • Majority of students placed below college-level • Significant barrier to completion (Bailey, Jeong, &Cho, 2010) • 50 -60% of equity gap in completions (Stoup, 2015) • What does this mean? • First interaction is to tell students they don’t belong • Imply most students not ready for college and likely to fail • • Convinced nearly everyone Including our students
Conventional Wisdom Explaining Assessment Results • It is a problem with today’s students • Students are simply, vastly unprepared for college • Kids these days ….
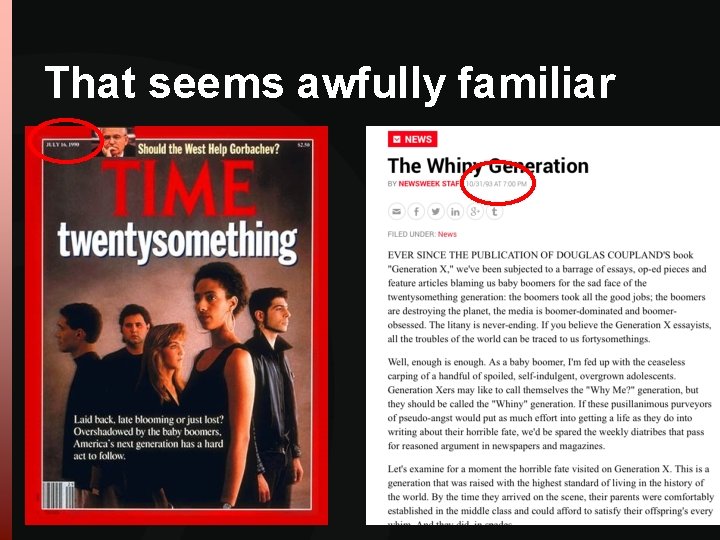
That seems awfully familiar
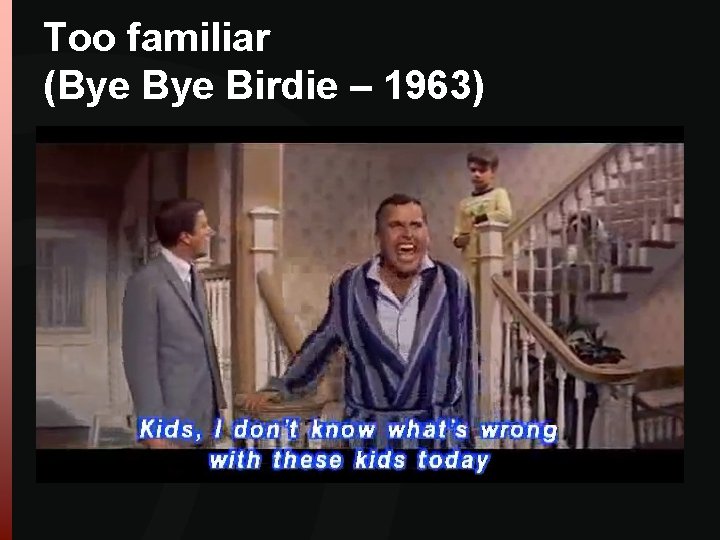
Too familiar (Bye Birdie – 1963)
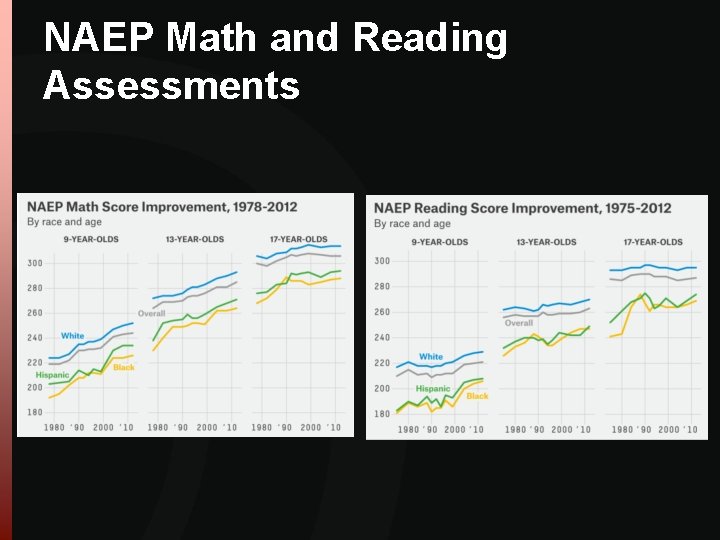
What If that Conventional Wisdom is Wrong? • Substantial, long-term increase in IQ: bit. ly/Flynn. Effect. IQ • 18 -24 with HS degree: 91% - highest ever: bit. ly/2014 HS 18 -24 • National Assessment of Educational Progress: at all-time highs in virtually every demographic category: bit. ly/NAEPInfo
NAEP Math and Reading Assessments
What If the Conventional Wisdom is Wrong? • Research increasingly questions effectiveness of standardized assessment for understanding student capacity • Little relation to college course outcomes • (e. g. , Belfield & Crosta, 2012; Edgescombe, 2011; Scott-Clayton, 2012; Scott-Clayton & Rodriguez, 2012): bit. ly/CCRCAssess • Incredible variability in cutscores and 2 -year colleges often use HIGHER cutscores than 4 -year • bit. ly/NAGB 2012 • Underestimates capability of students of color, women, first generation college students, low SES • Hiss & Franks, 2014; bit. ly/Defining. Promise
What if? • What if the problem is not primarily with our students but with limitations in how we have assessed and understood their capacity to do college-level work?
It gets worse • What if this flawed method of understanding and “remediating” student capacity has actually had the opposite effect? • Imagine yourself arriving at college as a community college student…
But there’s good news… • What if one of the key barriers to our students’ successful transition to and success in college is one that we fully control?
Cornerstone 1: Improving assessment through evidencebased multiple measures Resources/references: • http: //www. lbcc. edu/Promise. Pathways • http: //bit. ly/MMAP 2015 • http: //bit. ly/RPSTEPS • http: //bit. ly/RPMultiple. Measures • http: //cccassess. org
LBCC Multiple Measures Research • Five cohorts tracking more than 7, 000 HS grads who matriculate to LBCC directly • Examined predictive utility of wide range of high school achievement data • For predicting: • How students are assessed and placed • How students perform in those classes • (and alignment between them)
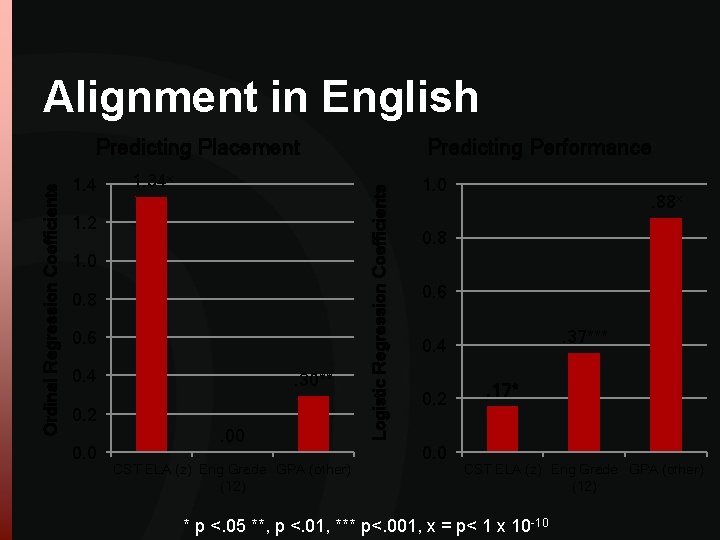
Alignment in English 1. 4 1. 34 x 1. 2 1. 0 0. 8 0. 6 0. 4 . 30** 0. 2 0. 0 . 00 CST ELA (z) Eng Grade GPA (other) (12) Predicting Performance Logistic Regression Coefficients Ordinal Regression Coefficients Predicting Placement 1. 0 . 88 x 0. 8 0. 6. 37*** 0. 4 0. 2 0. 0 . 17* CST ELA (z) Eng Grade GPA (other) (12) * p <. 05 **, p <. 01, *** p<. 001, x = p< 1 x 10 -10
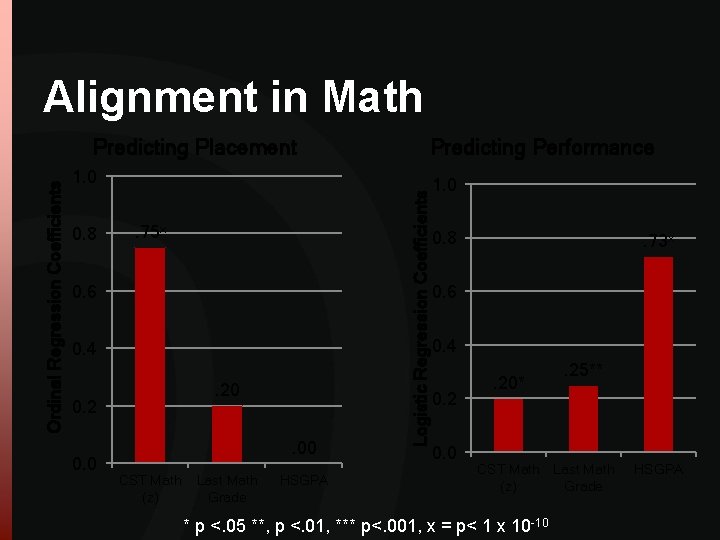
Alignment in Math Predicting Performance 1. 0 0. 8 . 75 x 0. 6 0. 4. 20 0. 2 0. 0 . 00 CST Math (z) Last Math Grade HSGPA Logistic Regression Coefficients Ordinal Regression Coefficients Predicting Placement 1. 0 0. 8 . 73 x 0. 6 0. 4 0. 2 0. 0 . 20* . 25** CST Math Last Math (z) Grade * p <. 05 **, p <. 01, *** p<. 001, x = p< 1 x 10 -10 HSGPA
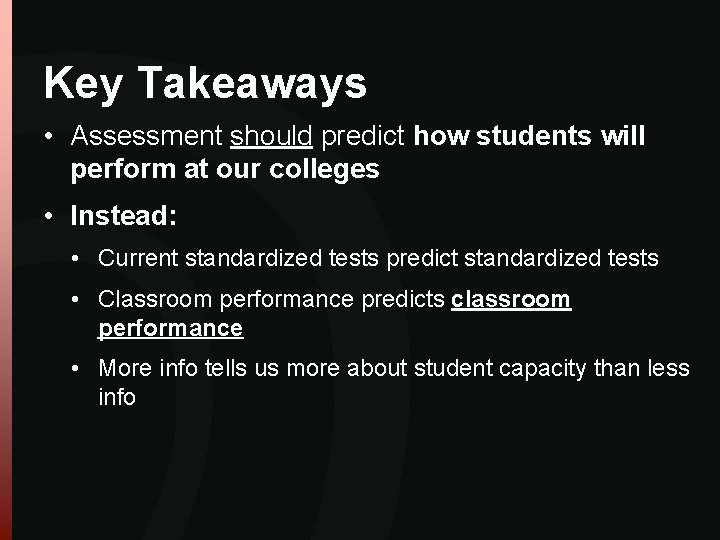
Key Takeaways • Assessment should predict how students will perform at our colleges • Instead: • Current standardized tests predict standardized tests • Classroom performance predicts classroom performance • More info tells us more about student capacity than less info
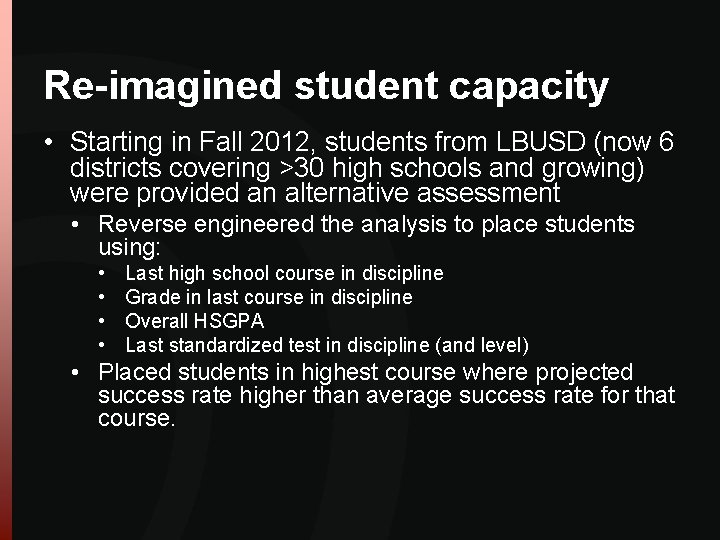
Re-imagined student capacity • Starting in Fall 2012, students from LBUSD (now 6 districts covering >30 high schools and growing) were provided an alternative assessment • Reverse engineered the analysis to place students using: • • Last high school course in discipline Grade in last course in discipline Overall HSGPA Last standardized test in discipline (and level) • Placed students in highest course where projected success rate higher than average success rate for that course.
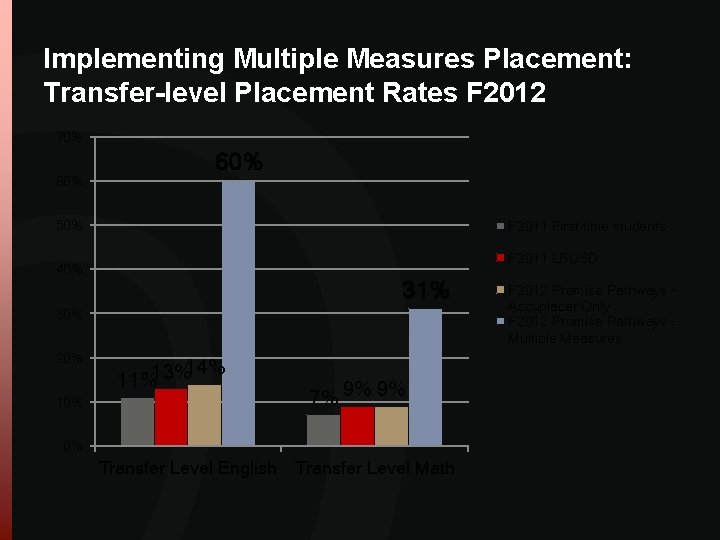
Implementing Multiple Measures Placement: Transfer-level Placement Rates F 2012 70% 60% 50% F 2011 First time students F 2011 LBUSD 40% 31% 30% 20% 14% 11%13% 7% 9% 9% 0% Transfer Level English Transfer Level Math F 2012 Promise Pathways Accuplacer Only F 2012 Promise Pathways Multiple Measures
But …
… didn’t that just flood transferlevel courses with unqualified students?
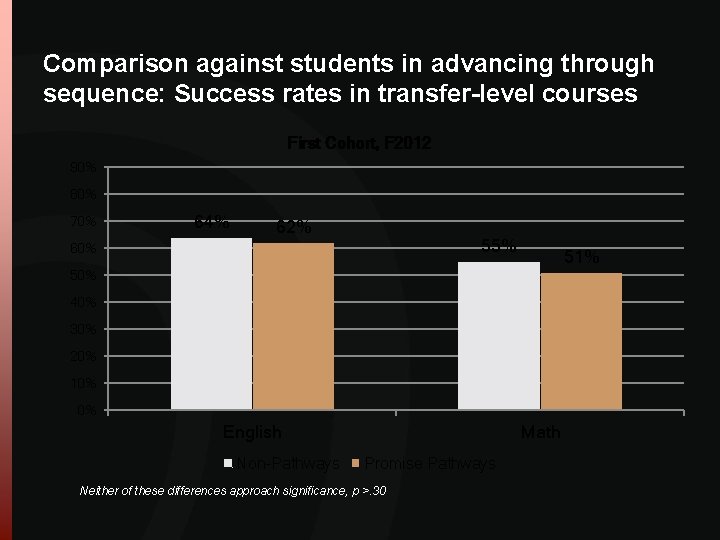
Comparison against students in advancing through sequence: Success rates in transfer-level courses First Cohort, F 2012 90% 80% 70% 64% 62% 55% 60% 51% 50% 40% 30% 20% 10% 0% English Non-Pathways Math Promise Pathways Neither of these differences approach significance, p >. 30
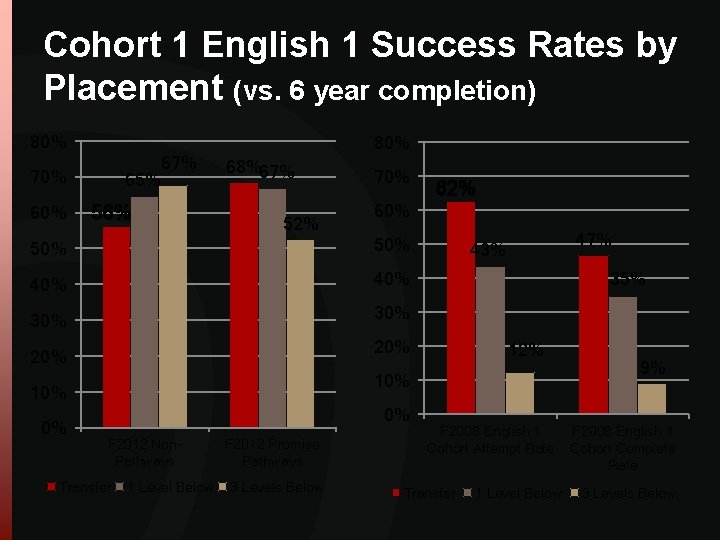
Cohort 1 English 1 Success Rates by Placement (vs. 6 year completion) 80% 70% 65% 67% 56% 68%67% 52% 70% 60% 50% 40% 30% 47% 43% 35% 20% 12% 10% 0% 62% 0% F 2012 Non. Pathways Transfer 1 Level Below F 2012 Promise Pathways 3 Levels Below F 2008 English 1 Cohort Attempt Rate Transfer 1 Level Below 9% F 2008 English 1 Cohort Complete Rate 3 Levels Below
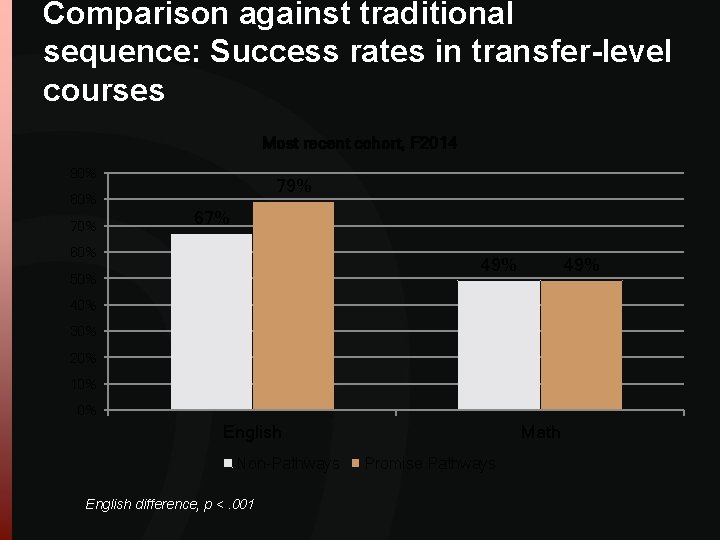
Comparison against traditional sequence: Success rates in transfer-level courses Most recent cohort, F 2014 90% 80% 79% 67% 60% 49% 50% 49% 40% 30% 20% 10% 0% English Non-Pathways English difference, p <. 001 Math Promise Pathways
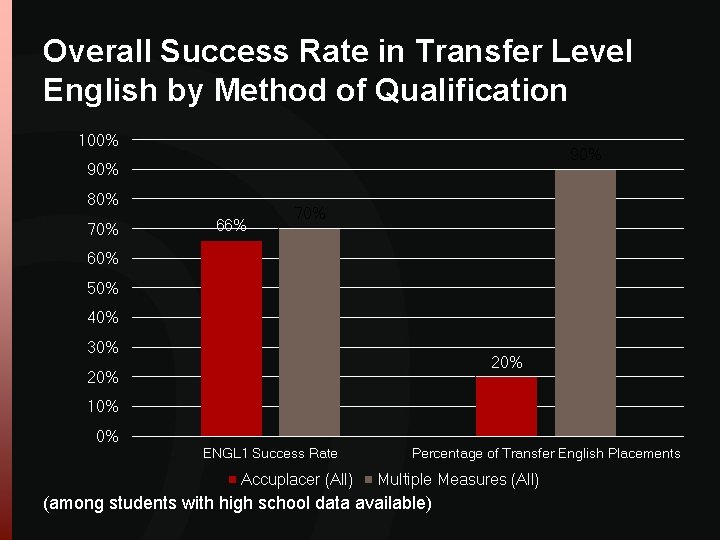
Overall Success Rate in Transfer Level English by Method of Qualification 100% 90% 80% 70% 66% 70% 60% 50% 40% 30% 20% 10% 0% ENGL 1 Success Rate Accuplacer (All) Percentage of Transfer English Placements Multiple Measures (All) (among students with high school data available)
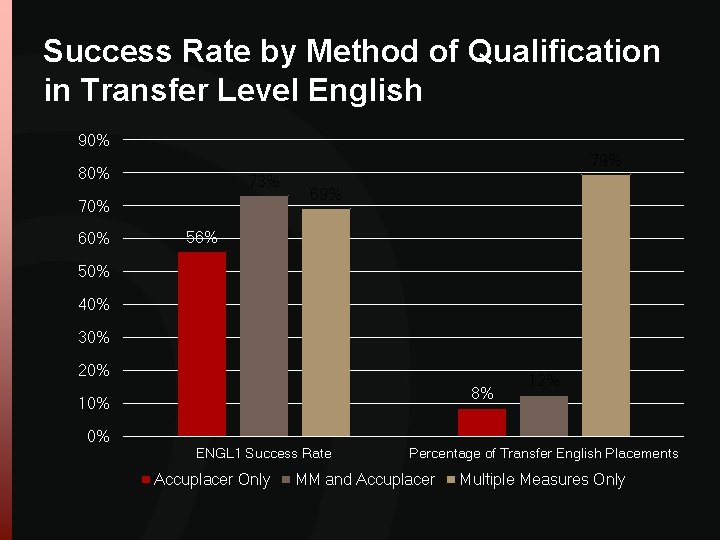
Success Rate by Method of Qualification in Transfer Level English 90% 79% 80% 73% 70% 69% 56% 50% 40% 30% 20% 8% 10% 0% ENGL 1 Success Rate Accuplacer Only 12% Percentage of Transfer English Placements MM and Accuplacer Multiple Measures Only
… what about grade inflation in HS?
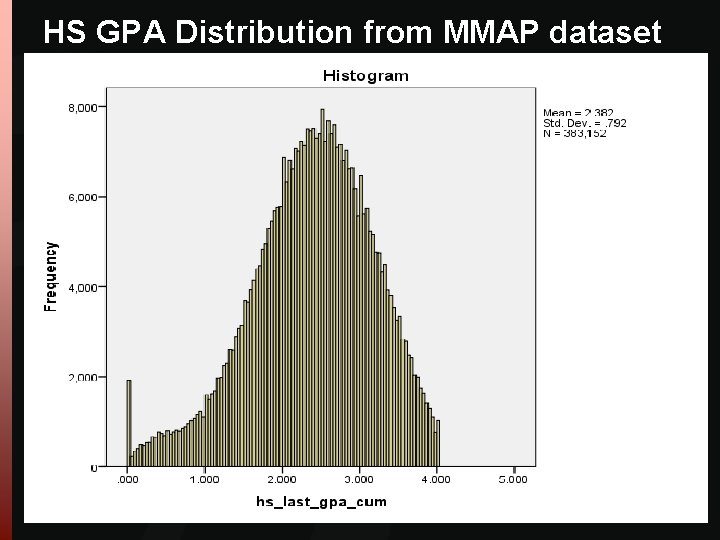
HS GPA Distribution from MMAP dataset
ACT research on grade inflation • Little evidence for grade inflation over last decade • Earlier observations of grade inflation may have been partly artifactual • adjustments to GPA for AP/IB/Honors • Zhang & Sanchez, 2014: http: //bit. ly/ACTGrade. Inflation
Concerns about grade inflation and social promotion do not fit evidence • Suggests that there should be little to no relation between HS grades and college grades because HS grades unrelated to performance • Everyone gets As and Bs would mean no variation to predict outcomes • Yet, predictive utility strongly observed • Stronger than standardized tests
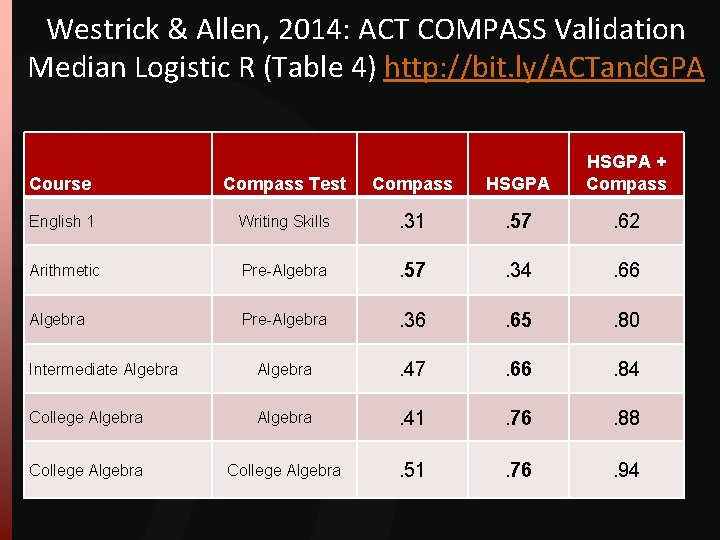
Westrick & Allen, 2014: ACT COMPASS Validation Median Logistic R (Table 4) http: //bit. ly/ACTand. GPA Course Compass Test Compass HSGPA + Compass English 1 Writing Skills . 31 . 57 . 62 Arithmetic Pre-Algebra . 57 . 34 . 66 Algebra Pre-Algebra . 36 . 65 . 80 Intermediate Algebra . 47 . 66 . 84 College Algebra . 41 . 76 . 88 College Algebra . 51 . 76 . 94
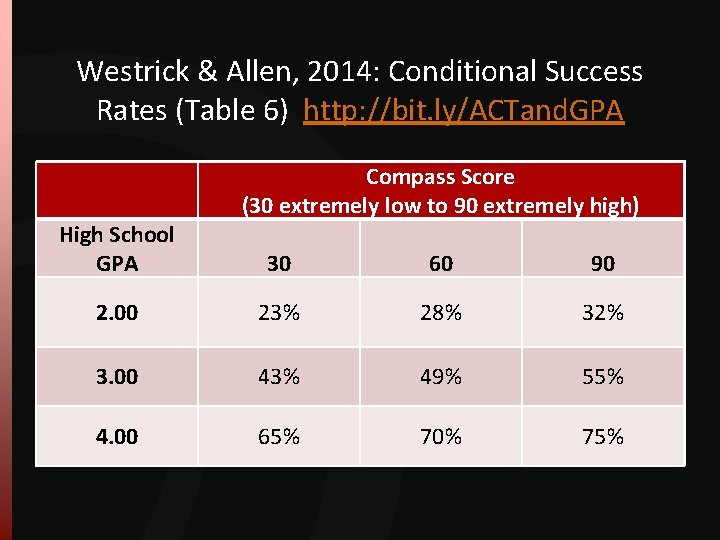
Westrick & Allen, 2014: Conditional Success Rates (Table 6) http: //bit. ly/ACTand. GPA High School GPA Compass Score (30 extremely low to 90 extremely high) 30 60 90 2. 00 23% 28% 32% 3. 00 43% 49% 55% 4. 00 65% 70% 75%
… didn’t that work only because Long Beach is special/has special relationship between LBCC and LBUSD?
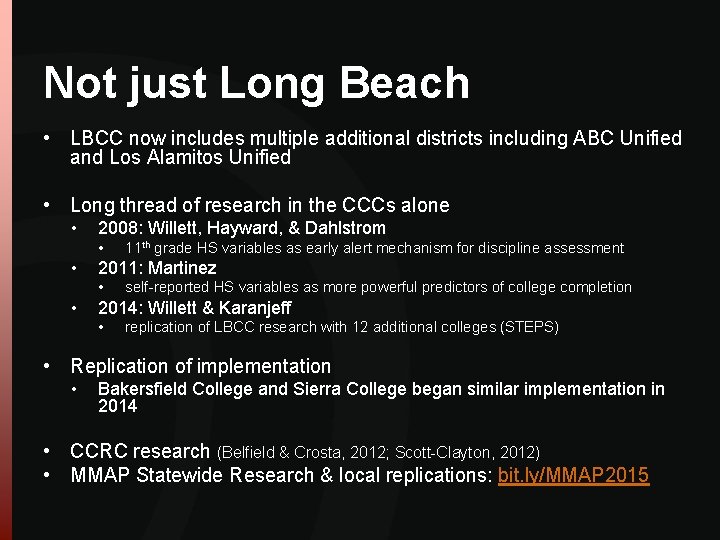
Not just Long Beach • LBCC now includes multiple additional districts including ABC Unified and Los Alamitos Unified • Long thread of research in the CCCs alone • 2008: Willett, Hayward, & Dahlstrom • • 2011: Martinez • • 11 th grade HS variables as early alert mechanism for discipline assessment self-reported HS variables as more powerful predictors of college completion 2014: Willett & Karanjeff • replication of LBCC research with 12 additional colleges (STEPS) • Replication of implementation • Bakersfield College and Sierra College began similar implementation in 2014 • CCRC research (Belfield & Crosta, 2012; Scott-Clayton, 2012) • MMAP Statewide Research & local replications: bit. ly/MMAP 2015
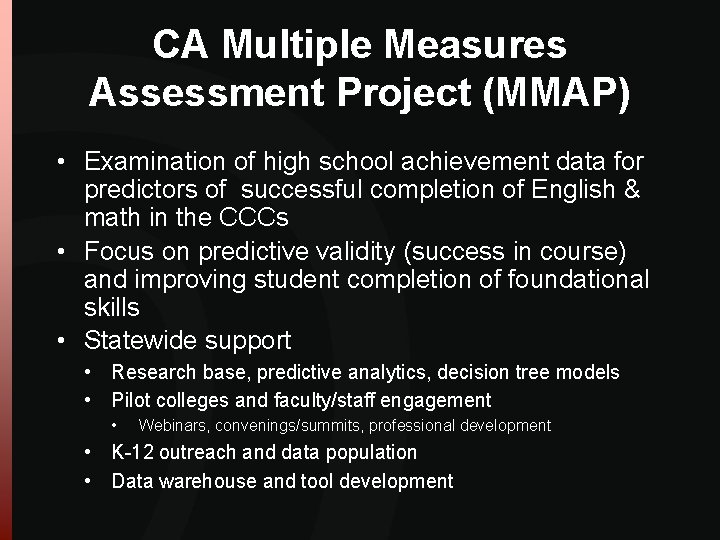
CA Multiple Measures Assessment Project (MMAP) • Examination of high school achievement data for predictors of successful completion of English & math in the CCCs • Focus on predictive validity (success in course) and improving student completion of foundational skills • Statewide support • Research base, predictive analytics, decision tree models • Pilot colleges and faculty/staff engagement • Webinars, convenings/summits, professional development • K-12 outreach and data population • Data warehouse and tool development
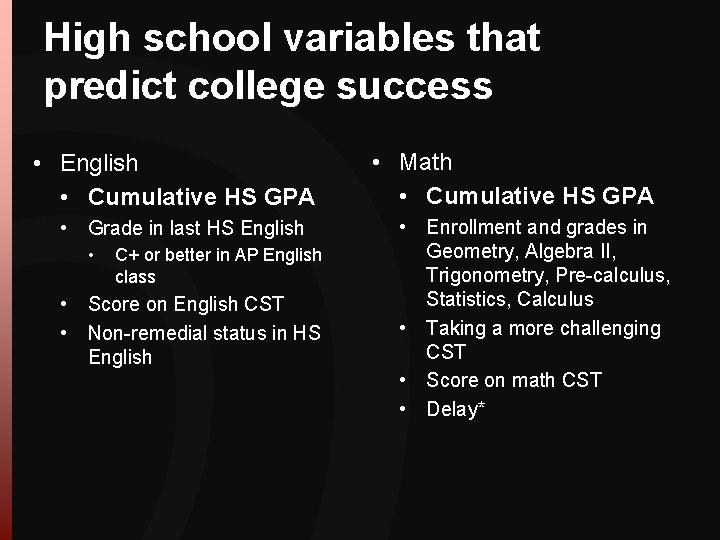
High school variables that predict college success • English • Cumulative HS GPA • Grade in last HS English • C+ or better in AP English class • Score on English CST • Non-remedial status in HS English • Math • Cumulative HS GPA • Enrollment and grades in Geometry, Algebra II, Trigonometry, Pre-calculus, Statistics, Calculus • Taking a more challenging CST • Score on math CST • Delay*
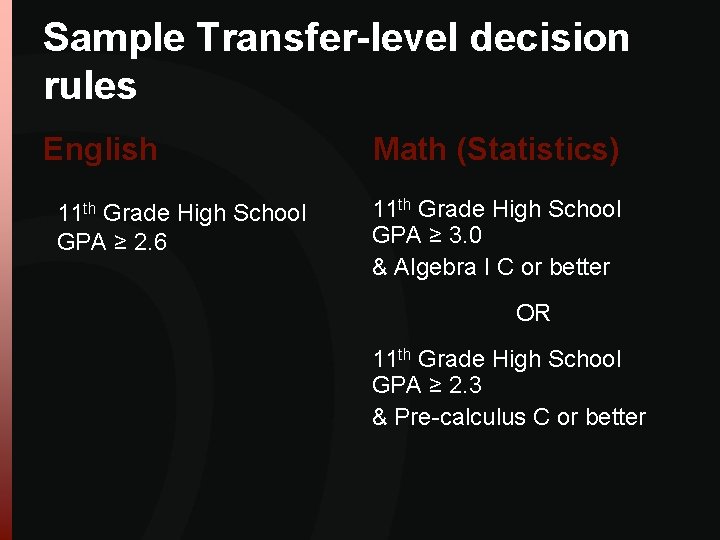
Sample Transfer-level decision rules English 11 th Grade High School GPA ≥ 2. 6 Math (Statistics) 11 th Grade High School GPA ≥ 3. 0 & Algebra I C or better OR 11 th Grade High School GPA ≥ 2. 3 & Pre-calculus C or better
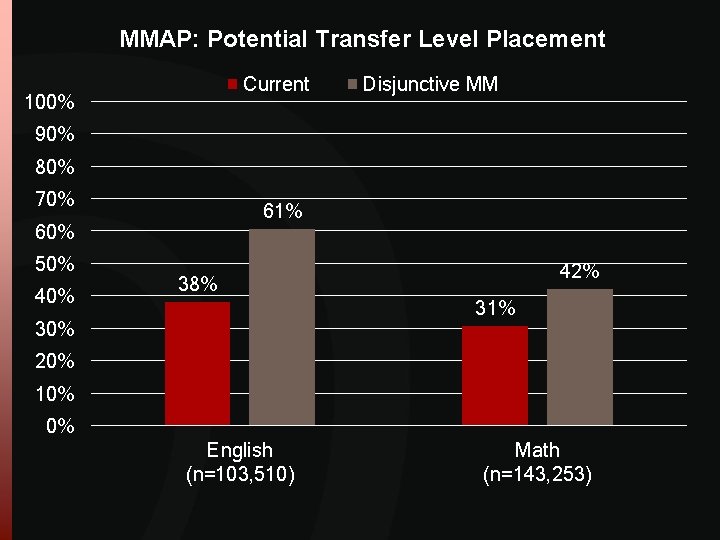
MMAP: Potential Transfer Level Placement Current 100% Disjunctive MM 90% 80% 70% 61% 60% 50% 42% 38% 31% 30% 20% 10% 0% English (n=103, 510) Math (n=143, 253)
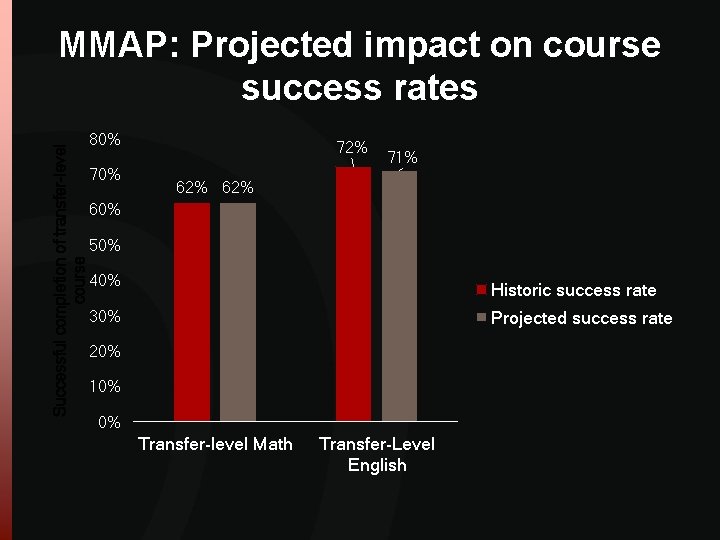
Successful completion of transfer-level course MMAP: Projected impact on course success rates 80% 72% 71% 62% 60% 50% 40% Historic success rate 30% Projected success rate 20% 10% 0% Transfer-level Math Transfer-Level English
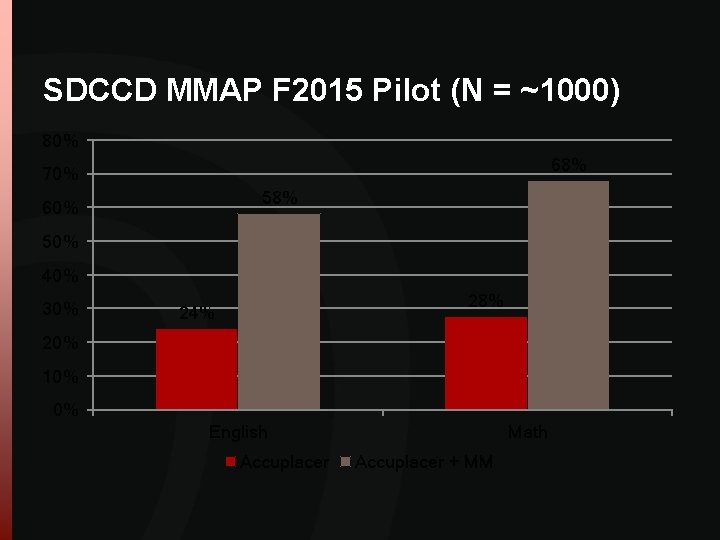
SDCCD MMAP F 2015 Pilot (N = ~1000) 80% 68% 70% 58% 60% 50% 40% 30% 28% 24% 20% 10% 0% English Accuplacer Math Accuplacer + MM
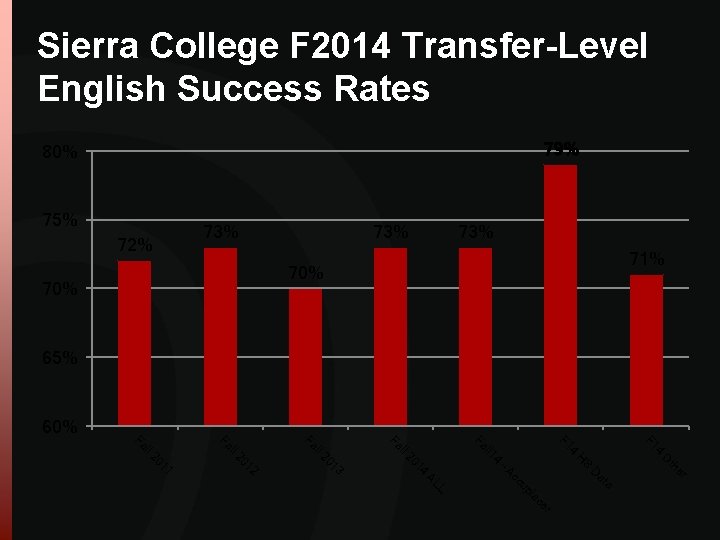
Sierra College F 2014 Transfer-Level English Success Rates 79% 80% 75% 72% 73% 73% 71% 70% 65% 60% 4 F 1 ll er a at D r ce la up L AL cc -A 14 th O S H 4 20 13 20 12 20 11 20 ll 1 4 F 1 Fa Fa ll Fa
… we’re happy with our placement. Why should we change?
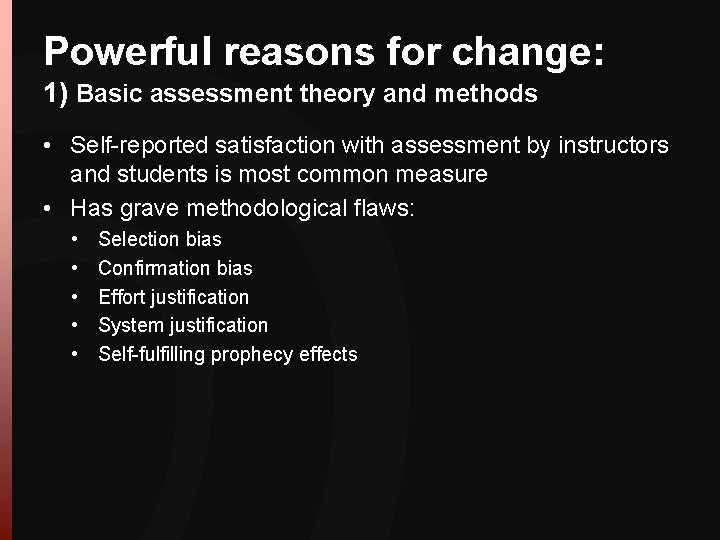
Powerful reasons for change: 1) Basic assessment theory and methods • Self-reported satisfaction with assessment by instructors and students is most common measure • Has grave methodological flaws: • • • Selection bias Confirmation bias Effort justification System justification Self-fulfilling prophecy effects
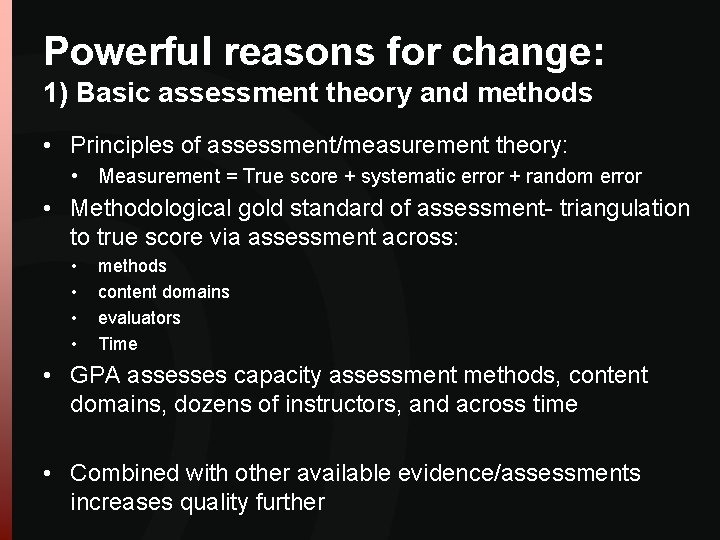
Powerful reasons for change: 1) Basic assessment theory and methods • Principles of assessment/measurement theory: • Measurement = True score + systematic error + random error • Methodological gold standard of assessment- triangulation to true score via assessment across: • • methods content domains evaluators Time • GPA assesses capacity assessment methods, content domains, dozens of instructors, and across time • Combined with other available evidence/assessments increases quality further
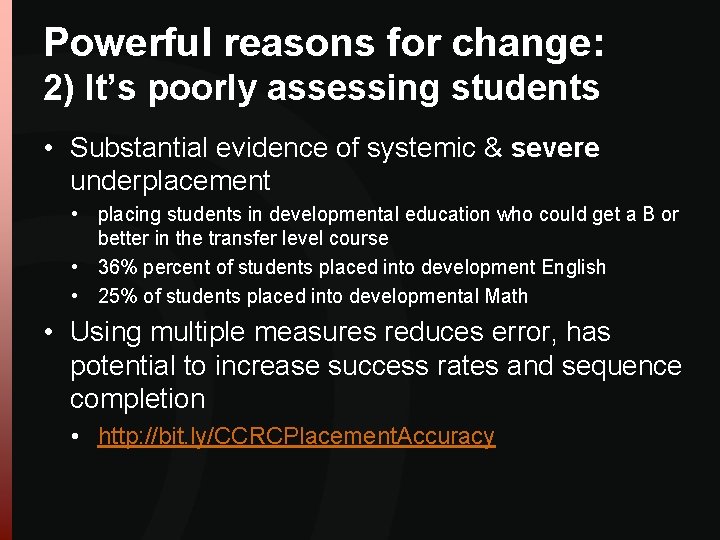
Powerful reasons for change: 2) It’s poorly assessing students • Substantial evidence of systemic & severe underplacement • placing students in developmental education who could get a B or better in the transfer level course • 36% percent of students placed into development English • 25% of students placed into developmental Math • Using multiple measures reduces error, has potential to increase success rates and sequence completion • http: //bit. ly/CCRCPlacement. Accuracy
Powerful reasons for change: 3) Transformational impacts for students • Potential for dramatic increases in rates and time to completion of • Transfer-level course in discipline • Subsequent courses in discipline • Other early educational milestones.
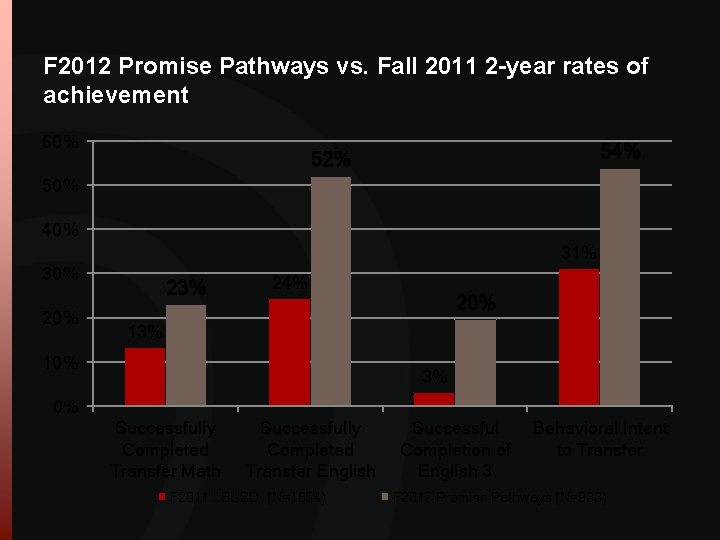
F 2012 Promise Pathways vs. Fall 2011 2 -year rates of achievement 60% 54% 52% 50% 40% 31% 30% 23% 24% 20% 13% 10% 3% 0% Successfully Completed Transfer Math Successfully Completed Transfer English F 2011 LBUSD (N=1654) Successful Completion of English 3 Behavioral Intent to Transfer F 2012 Promise Pathways (N=933)
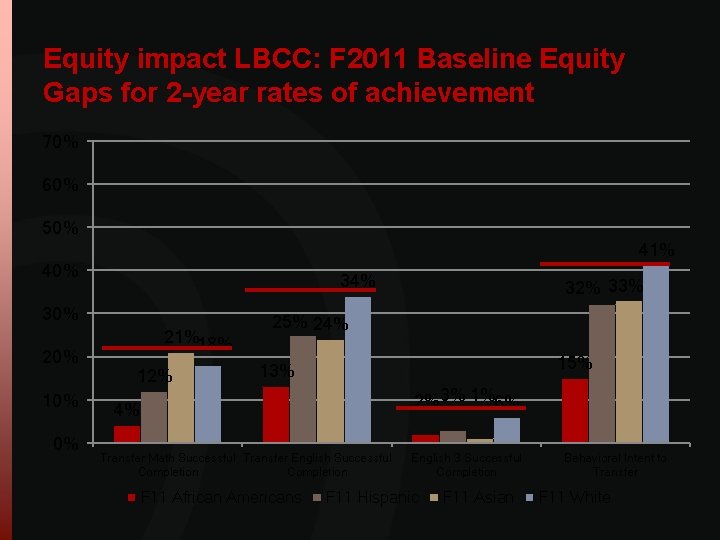
Equity impact LBCC: F 2011 Baseline Equity Gaps for 2 -year rates of achievement 70% 60% 50% 41% 40% 34% 30% 20% 10% 0% 21%18% 12% 33% 25% 24% 15% 13% 2%3% 1%6% 4% Transfer Math Successful Transfer English Successful Completion F 11 African Americans English 3 Successful Completion F 11 Hispanic F 11 Asian Behavioral Intent to Transfer F 11 White
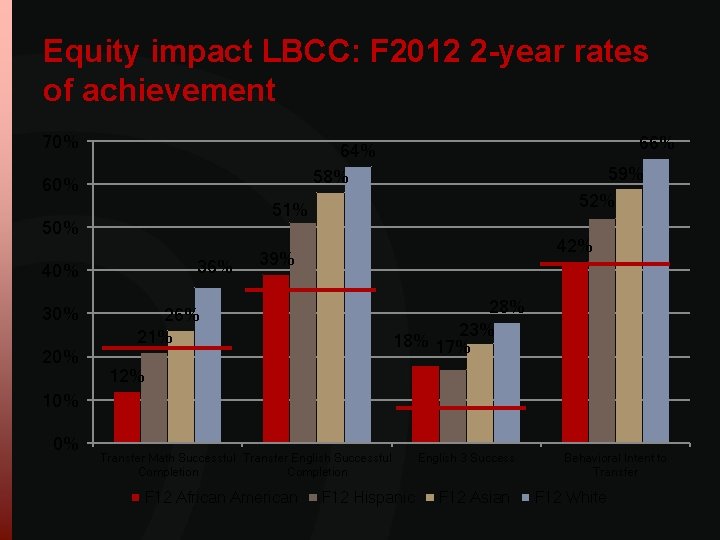
Equity impact LBCC: F 2012 2 -year rates of achievement 70% 60% 36% 40% 20% 59% 52% 51% 50% 30% 66% 64% 58% 42% 39% 28% 23% 18% 17% 26% 21% 12% 10% 0% Transfer Math Successful Transfer English Successful Completion F 12 African American F 12 Hispanic English 3 Success F 12 Asian Behavioral Intent to Transfer F 12 White
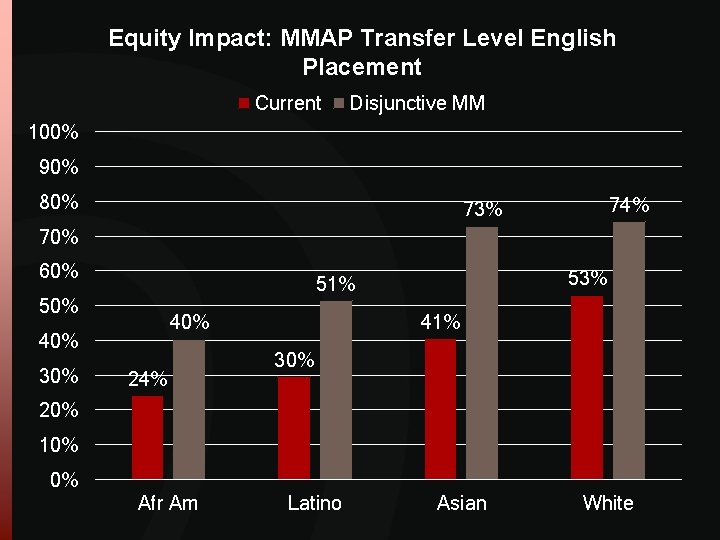
Equity Impact: MMAP Transfer Level English Placement Current Disjunctive MM 100% 90% 80% 74% 73% 70% 60% 50% 41% 40% 30% 53% 51% 24% 30% 20% 10% 0% Afr Am Latino Asian White
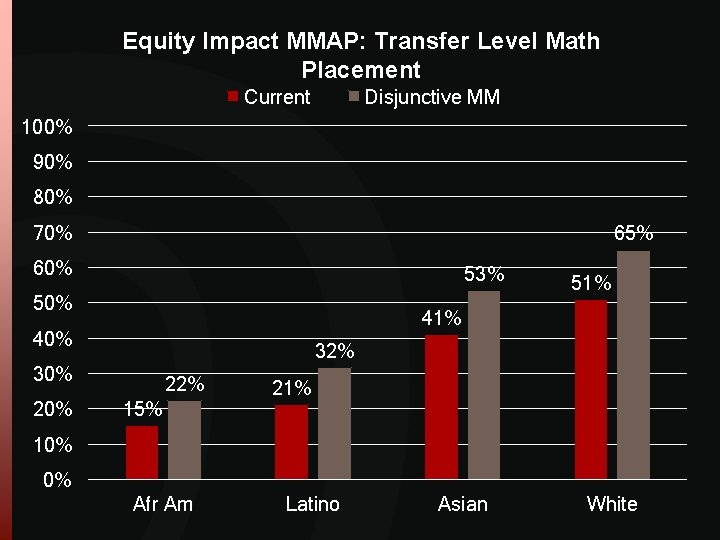
Equity Impact MMAP: Transfer Level Math Placement Current Disjunctive MM 100% 90% 80% 70% 65% 60% 53% 50% 41% 40% 32% 30% 20% 51% 22% 15% 21% 10% 0% Afr Am Latino Asian White
… what about students for whom high school transcript data aren’t available/easy to get?
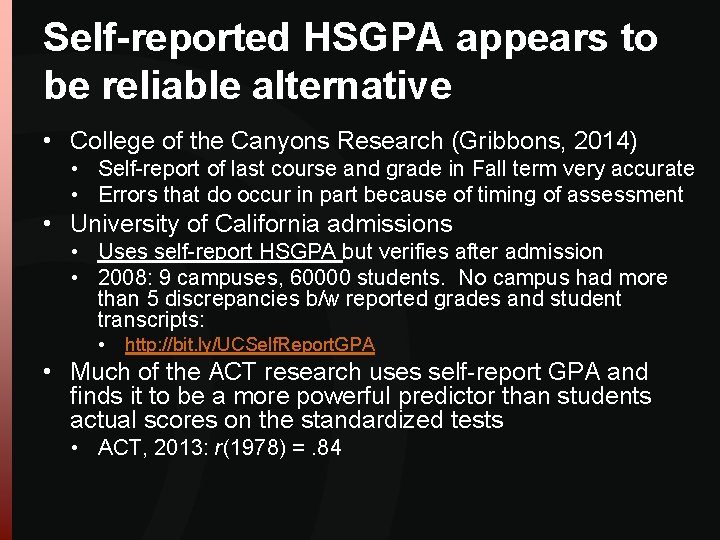
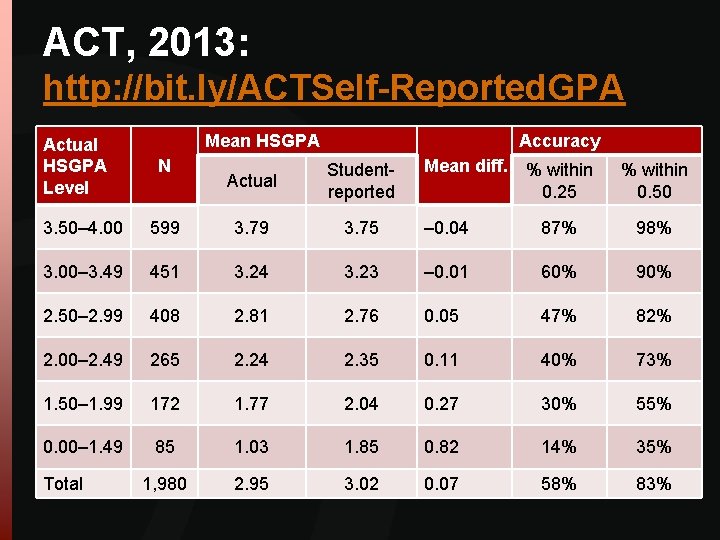
Self-reported HSGPA appears to be reliable alternative • College of the Canyons Research (Gribbons, 2014) • Self-report of last course and grade in Fall term very accurate • Errors that do occur in part because of timing of assessment • University of California admissions • Uses self-report HSGPA but verifies after admission • 2008: 9 campuses, 60000 students. No campus had more than 5 discrepancies b/w reported grades and student transcripts: • http: //bit. ly/UCSelf. Report. GPA • Much of the ACT research uses self-report GPA and finds it to be a more powerful predictor than students actual scores on the standardized tests • ACT, 2013: r(1978) =. 84
ACT, 2013: http: //bit. ly/ACTSelf-Reported. GPA Actual HSGPA Level Mean HSGPA N Accuracy Actual Studentreported Mean diff. % within 0. 25 % within 0. 50 3. 50– 4. 00 599 3. 75 – 0. 04 87% 98% 3. 00– 3. 49 451 3. 24 3. 23 – 0. 01 60% 90% 2. 50– 2. 99 408 2. 81 2. 76 0. 05 47% 82% 2. 00– 2. 49 265 2. 24 2. 35 0. 11 40% 73% 1. 50– 1. 99 172 1. 77 2. 04 0. 27 30% 55% 0. 00– 1. 49 85 1. 03 1. 85 0. 82 14% 35% 1, 980 2. 95 3. 02 0. 07 58% 83% Total
… what about non-traditional students?
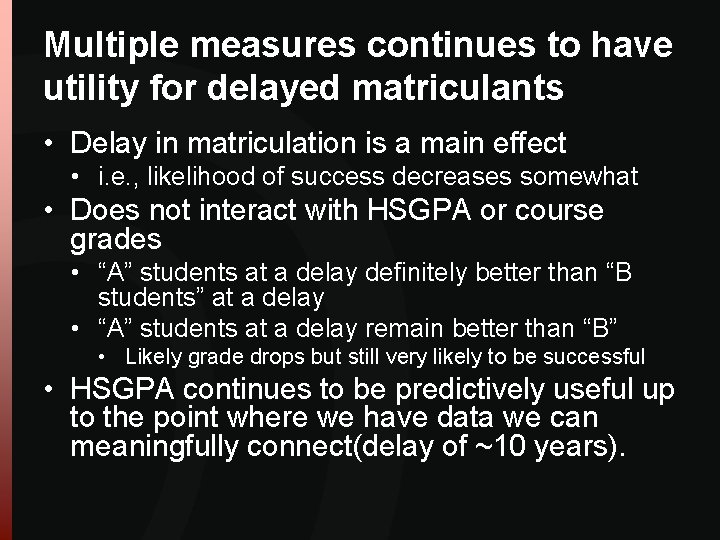
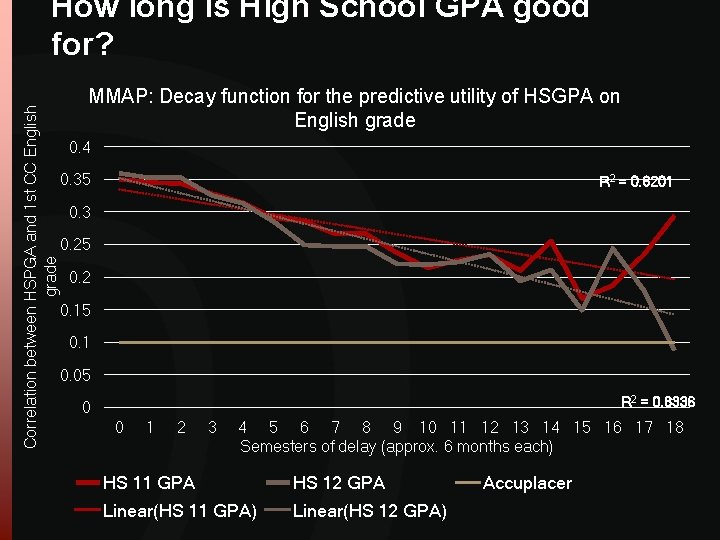
Multiple measures continues to have utility for delayed matriculants • Delay in matriculation is a main effect • i. e. , likelihood of success decreases somewhat • Does not interact with HSGPA or course grades • “A” students at a delay definitely better than “B students” at a delay • “A” students at a delay remain better than “B” • Likely grade drops but still very likely to be successful • HSGPA continues to be predictively useful up to the point where we have data we can meaningfully connect(delay of ~10 years).
Correlation between HSPGA and 1 st CC English grade How long is High School GPA good for? MMAP: Decay function for the predictive utility of HSGPA on English grade 0. 4 0. 35 R 2 = 0. 6201 0. 3 0. 25 0. 2 0. 15 0. 1 0. 05 R 2 = 0. 8336 0 0 1 2 3 4 5 6 7 8 9 10 11 12 13 14 15 16 17 18 Semesters of delay (approx. 6 months each) HS 11 GPA HS 12 GPA Linear(HS 11 GPA) Linear(HS 12 GPA) Accuplacer
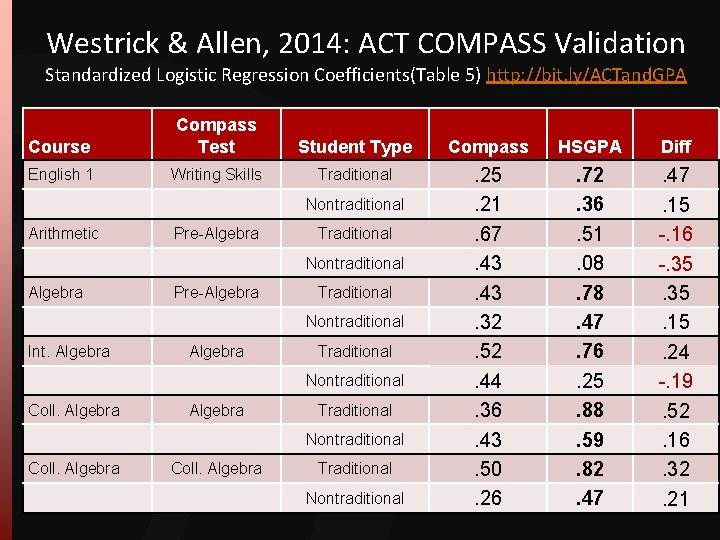
Westrick & Allen, 2014: ACT COMPASS Validation Standardized Logistic Regression Coefficients(Table 5) http: //bit. ly/ACTand. GPA Course Compass Test Student Type Compass HSGPA Diff English 1 Writing Skills Traditional . 25. 21. 67. 43. 32. 52. 44. 36. 43. 50. 26 . 72. 36. 51. 08. 78. 47. 76. 25. 88. 59. 82. 47. 15 -. 16 -. 35. 15. 24 -. 19. 52. 16. 32. 21 Nontraditional Arithmetic Pre-Algebra Traditional Nontraditional Algebra Pre-Algebra Traditional Nontraditional Int. Algebra Traditional Nontraditional Coll. Algebra Traditional Nontraditional
… that doesn’t seem like enough evidence that I need to rethink student capacity. What else have you got?
Cornerstone 2: Reconsider cut scores Resources/references: • http: //bit. ly/Let. Them. In (Henson & Hern, 2014) • http: //bit. ly/Kalamkarian 2015 (Kalamkarian, Raufman, & Edgecombe, 2015) • http: //bit. ly/Rodriguez 2014 (Rodriguez, 2014)
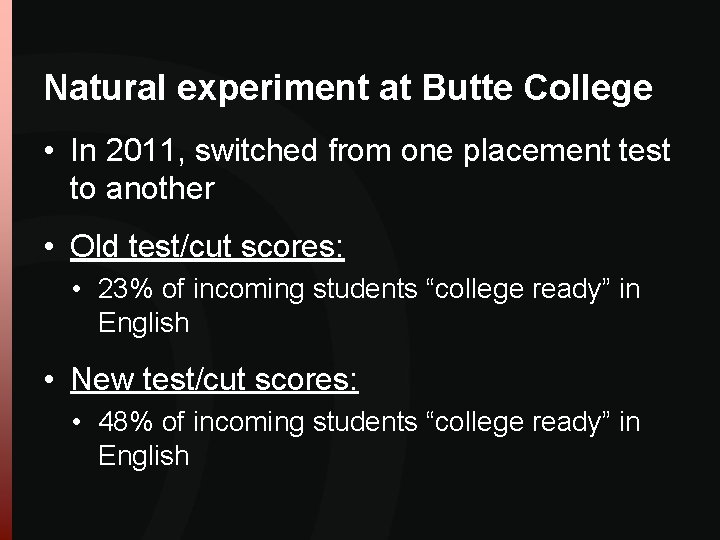
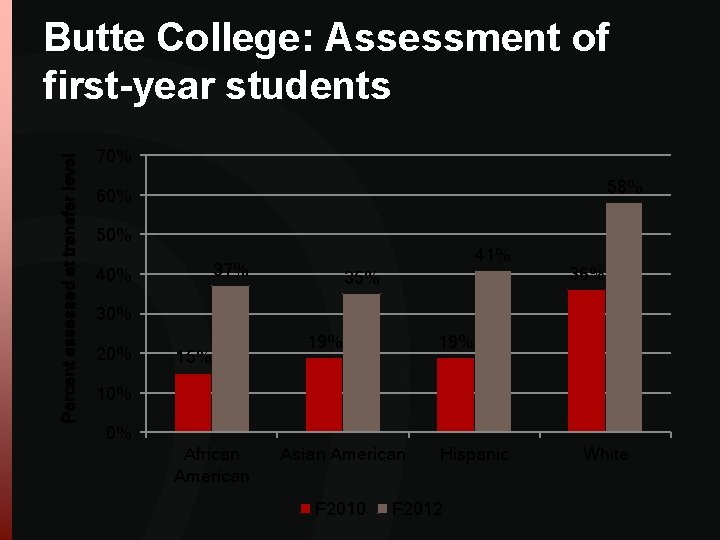
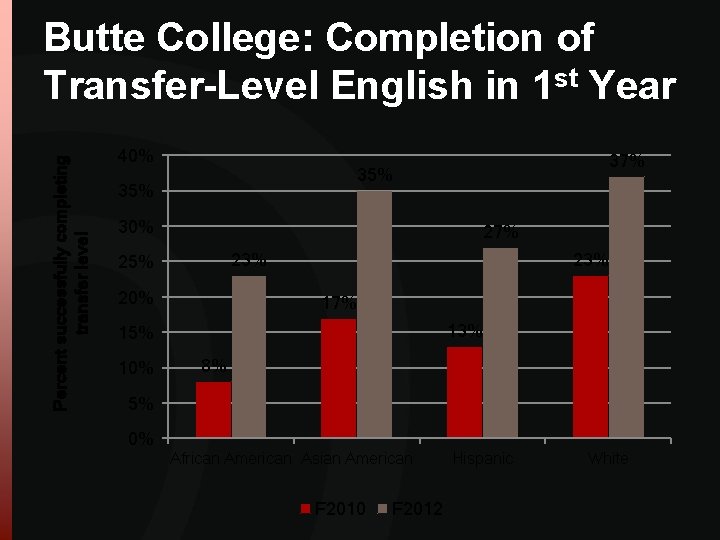
Natural experiment at Butte College • In 2011, switched from one placement test to another • Old test/cut scores: • 23% of incoming students “college ready” in English • New test/cut scores: • 48% of incoming students “college ready” in English
Percent assessed at transfer level Butte College: Assessment of first-year students 70% 58% 60% 50% 41% 37% 40% 35% 36% 30% 20% 15% 19% 10% 0% African American Asian American F 2010 Hispanic F 2012 White
Percent successfully completing transfer level Butte College: Completion of Transfer-Level English in 1 st Year 40% 35% 30% 27% 23% 25% 20% 23% 17% 13% 15% 10% 37% 8% 5% 0% African American Asian American F 2010 F 2012 Hispanic White
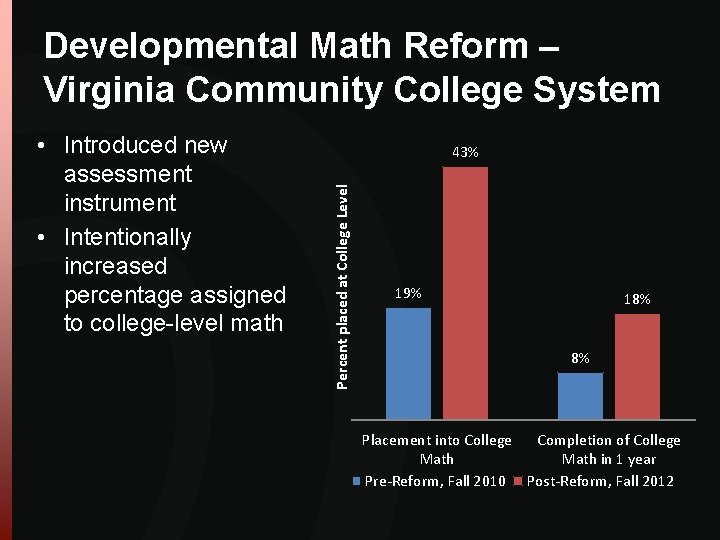
Developmental Math Reform – Virginia Community College System 43% Percent placed at College Level • Introduced new assessment instrument • Intentionally increased percentage assigned to college-level math 19% 18% 8% Placement into College Completion of College Math in 1 year Pre-Reform, Fall 2010 Post-Reform, Fall 2012
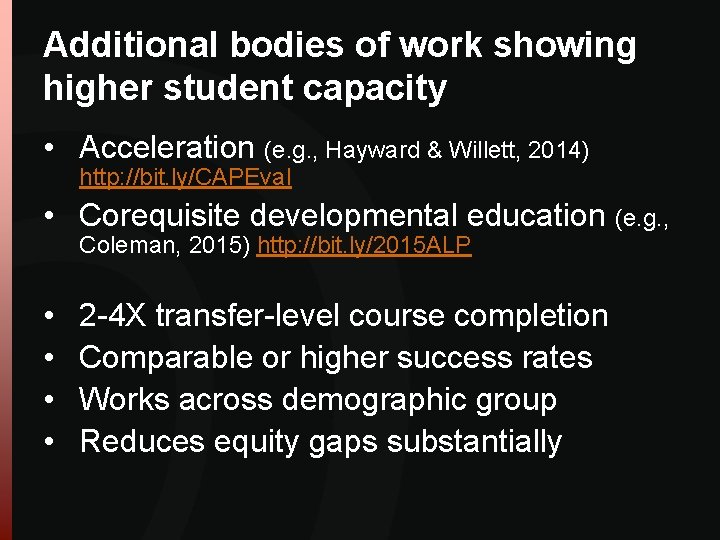
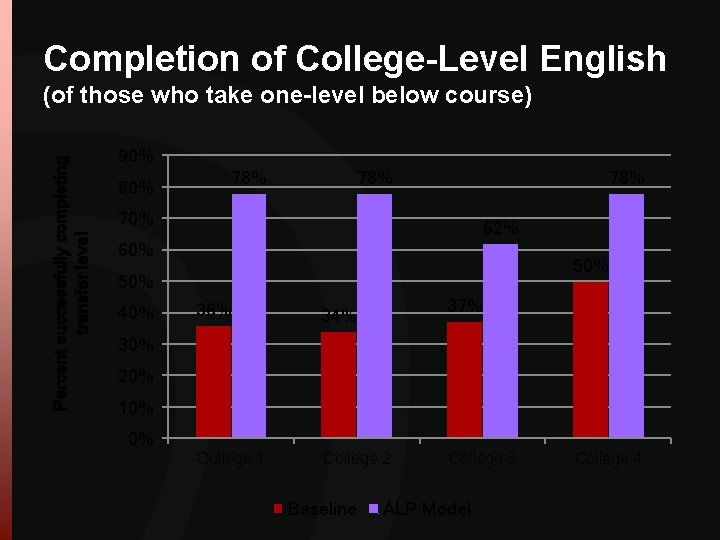
Additional bodies of work showing higher student capacity • Acceleration (e. g. , Hayward & Willett, 2014) http: //bit. ly/CAPEval • Corequisite developmental education (e. g. , Coleman, 2015) http: //bit. ly/2015 ALP • • 2 -4 X transfer-level course completion Comparable or higher success rates Works across demographic group Reduces equity gaps substantially
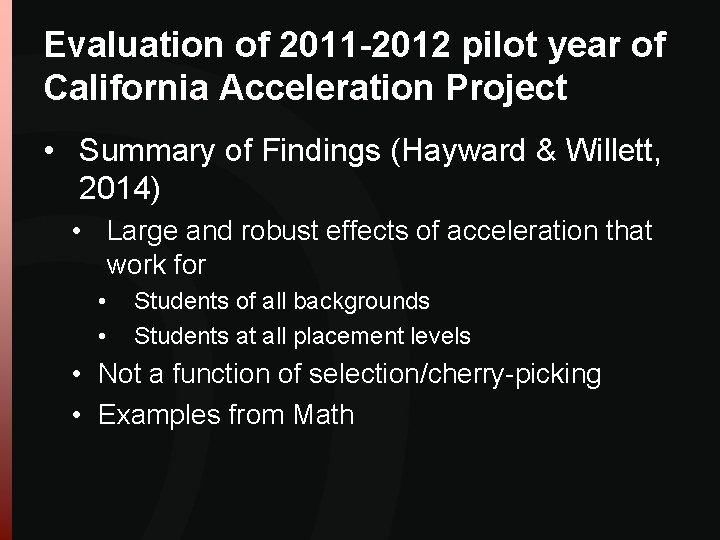
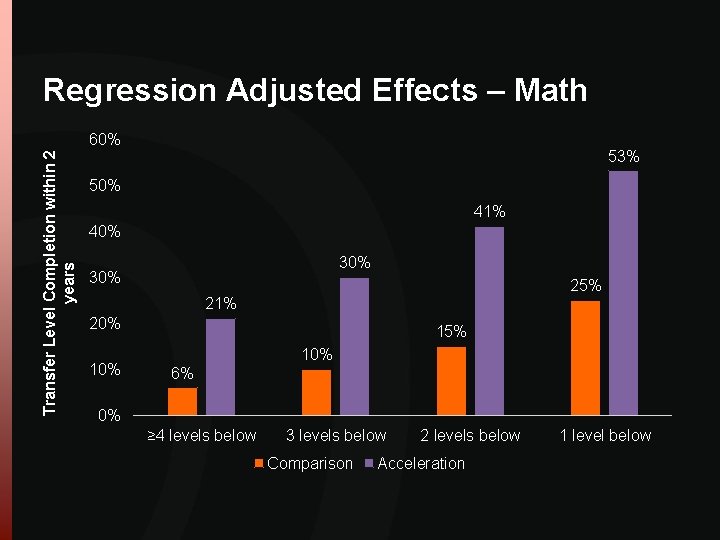
Evaluation of 2011 -2012 pilot year of California Acceleration Project • Summary of Findings (Hayward & Willett, 2014) • Large and robust effects of acceleration that work for • • Students of all backgrounds Students at all placement levels • Not a function of selection/cherry-picking • Examples from Math
Regression Adjusted Effects – Math Transfer Level Completion within 2 years 60% 53% 50% 41% 40% 30% 25% 21% 20% 15% 10% 6% 0% ≥ 4 levels below 3 levels below Comparison 2 levels below Acceleration 1 level below
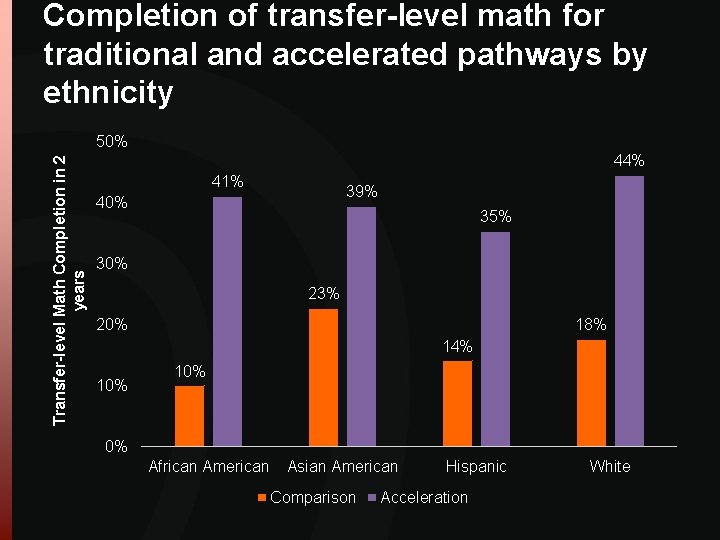
Completion of transfer-level math for traditional and accelerated pathways by ethnicity Transfer-level Math Completion in 2 years 50% 44% 41% 39% 40% 35% 30% 23% 20% 18% 14% 10% 0% African American Asian American Comparison Hispanic Acceleration White
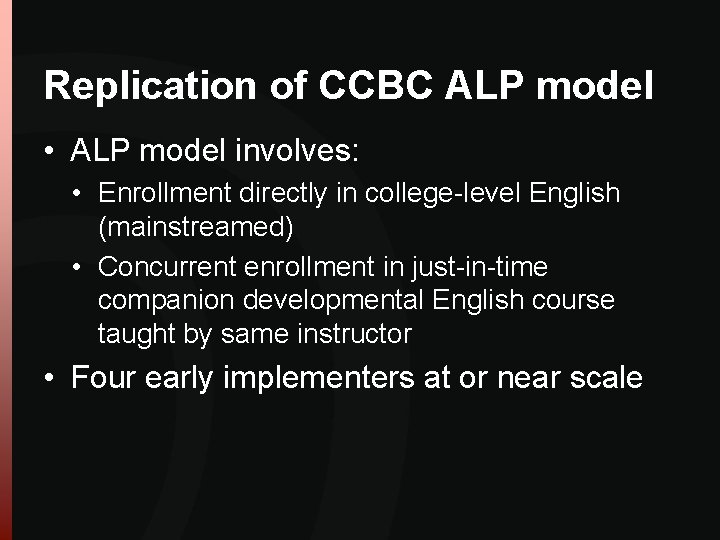
Replication of CCBC ALP model • ALP model involves: • Enrollment directly in college-level English (mainstreamed) • Concurrent enrollment in just-in-time companion developmental English course taught by same instructor • Four early implementers at or near scale
Completion of College-Level English Percent successfully completing transfer level (of those who take one-level below course) 90% 80% 78% 78% 70% 62% 60% 50% 40% 37% 36% 34% College 1 College 2 30% 20% 10% 0% Baseline College 3 ALP Model College 4
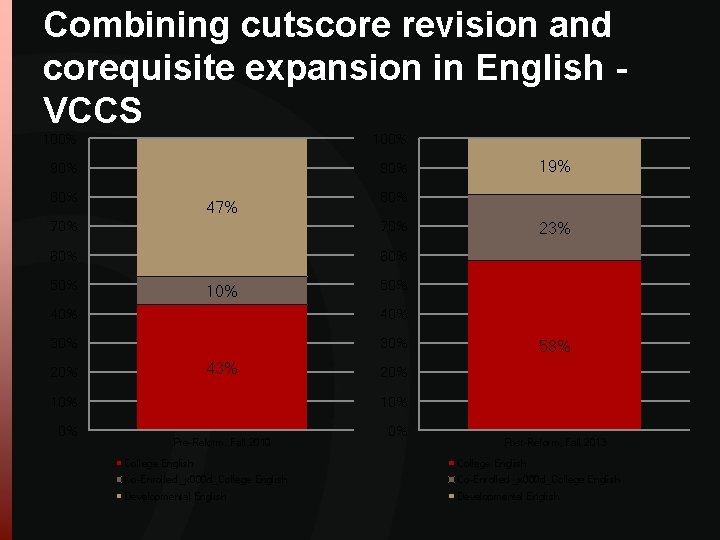
Combining cutscore revision and corequisite expansion in English VCCS 100% 90% 80% 47% 80% 70% 60% 50% 10% 40% 30% 43% 10% 0% 23% 50% 40% 20% 19% 58% 20% 10% Pre-Reform, Fall 2010 0% Post-Reform, Fall 2013 College English Co-Enrolled _x 000 d_College English Developmental English
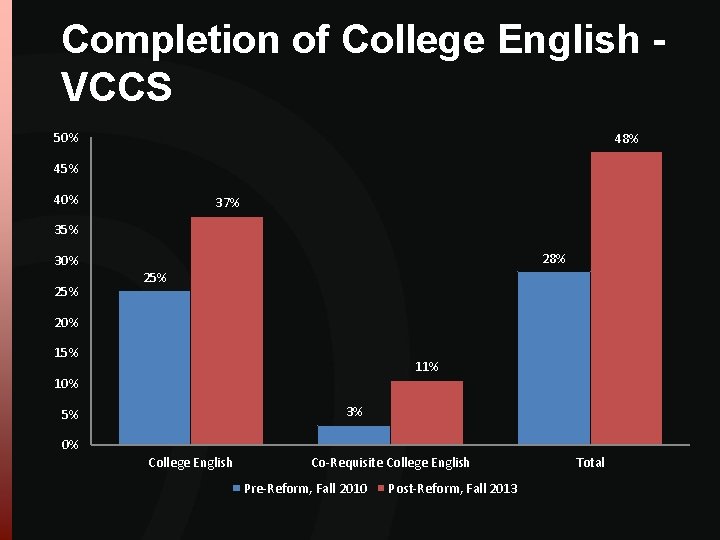
Completion of College English VCCS 50% 48% 45% 40% 37% 35% 30% 25% 28% 25% 20% 15% 11% 10% 3% 5% 0% College English Co-Requisite College English Pre-Reform, Fall 2010 Post-Reform, Fall 2013 Total
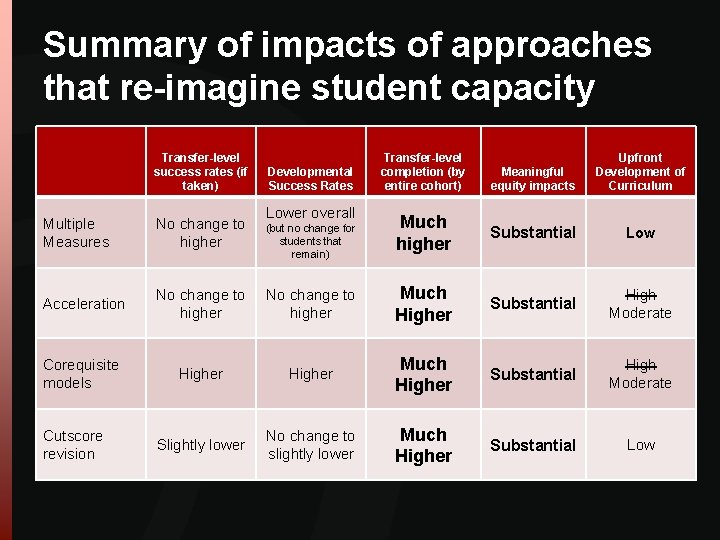
Summary of impacts of approaches that re-imagine student capacity Transfer-level success rates (if taken) Developmental Success Rates Lower overall Transfer-level completion (by entire cohort) Meaningful equity impacts Upfront Development of Curriculum Much higher Substantial Low Multiple Measures No change to higher Acceleration No change to higher Much Higher Substantial High Moderate Corequisite models Higher Much Higher Substantial High Moderate Slightly lower No change to slightly lower Much Higher Substantial Low Cutscore revision (but no change for students that remain)
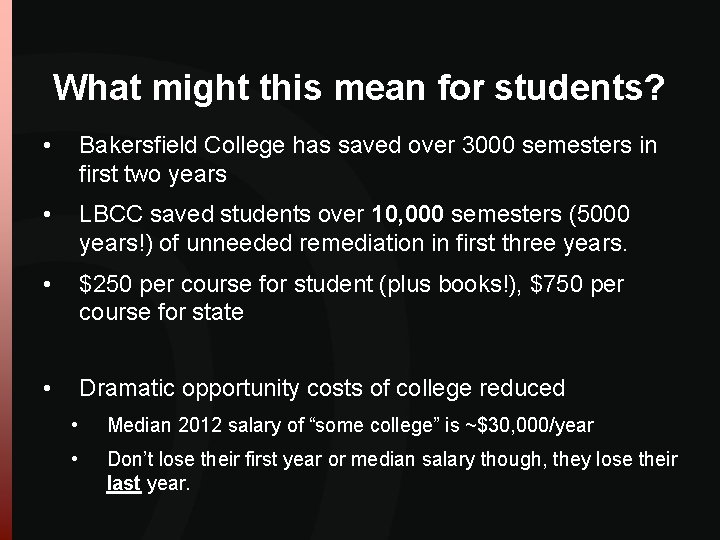
What might this mean for students? • Bakersfield College has saved over 3000 semesters in first two years • LBCC saved students over 10, 000 semesters (5000 years!) of unneeded remediation in first three years. • $250 per course for student (plus books!), $750 per course for state • Dramatic opportunity costs of college reduced • Median 2012 salary of “some college” is ~$30, 000/year • Don’t lose their first year or median salary though, they lose their last year.
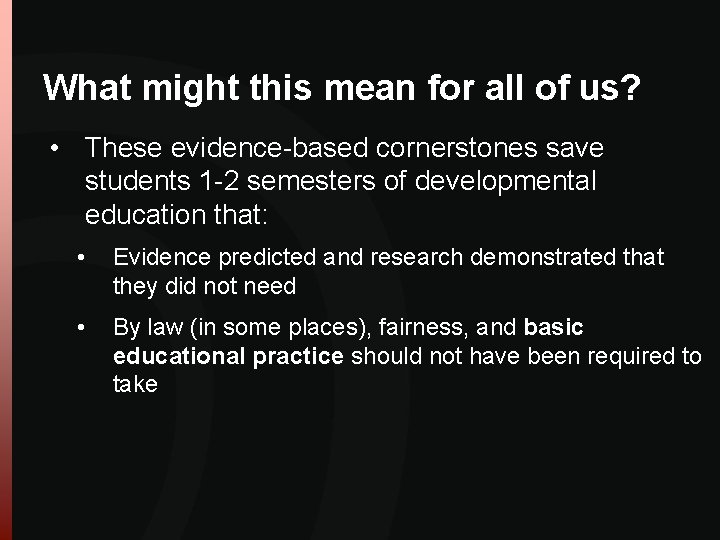
What might this mean for all of us? • These evidence-based cornerstones save students 1 -2 semesters of developmental education that: • Evidence predicted and research demonstrated that they did not need • By law (in some places), fairness, and basic educational practice should not have been required to take
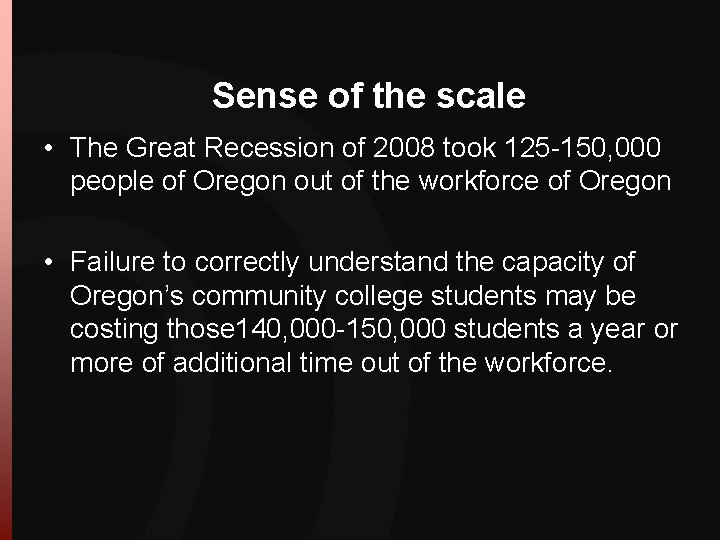
Sense of the scale • The Great Recession of 2008 took 125 -150, 000 people of Oregon out of the workforce of Oregon • Failure to correctly understand the capacity of Oregon’s community college students may be costing those 140, 000 -150, 000 students a year or more of additional time out of the workforce.
What can be gained through assessment and placement reform • • A clarion call to better understand the true capacity of our students. The ability to transform student outcomes Powerful levers to address student equity gaps Renewed opportunities to collaborate with our K-12 educational colleagues The chance to stop meeting students at front door to tell them they don’t belong A far better future for our students and for us all A reminder of Daedalus’ second instruction to Icarus. • It’s just as important not to fly to low.
Thank you! • Contact information • • • John Hetts Educational Results Partnership jhetts@edresults. org 916 -498 -8980 ext. 208 714 -380 -2678 cell Twitter: @jjhetts