Cohort Study Quasi Experimental study Dr Abhay Nirgude

Cohort Study Quasi Experimental study Dr Abhay Nirgude Professor & Ho. D

Specific learning Objectives 1. Define cohort 2. Enumerate the steps in cohort study 3. Enlist the differences between case control & cohort study 4. Interpret the Relative Risk, Attributable Risk.

Cohort Study

Types of Cohort studies 1. Prospective cohort study 2. Retrospective Cohort study ( Historical ) 3. Combination of both 4. Nested case control study

Steps in Cohort Study Selection of study subjects Obtaining data on exposure Selection of comparison group Follow up Analysis

Nested Case Control Studies • A hybrid design in which a case control study is nested in a cohort study. • Advantages : A. Baseline data before disease developed. B. Recall bias is eliminated. C. Abnormalities in biological characteristics if any will not cause any problem. D. Economical.

Nested Case Control Design Initial Data and/ or Serum, Urine, or Other Specimens obtained Population Y e a r s Develop Disease Do Not Develop Disease Cases Subgroup selected as controls Case –Control Study C O H O R T S T U D y

Correct the error • Cohort Study starts with outcome and moves backward to assess the exposure.

The Framingham Heart study 1948

Analysis 1. Incidence rates among exposed & Non Exposed 2. Estimation of disease risk associated with exposure : - R R & A R.

Summary 1. Define cohort 2. Enumerate the steps in cohort study 3. Enlist the differences between case control & cohort study 4. Interpret the Relative Risk, Attributable Risk.

Smoking & Lung Cancer Total Cigarette Developed Did not developed lung Smoking Lung Cancer cancer Yes 70 (a ) 6930 (b ) 7000 (a + b ) No 3(c) 2997 ( d ) 3000 ( c + d )

Incidence Rates • Among Smokers = 70/7000= 10 per 1000 • Among Non smoker = 3/3000= 1 per 1000 • Statistical significance : P < 0. 001

Estimation of Risk • Incidence among exposed • Relative Risk = • Incidence among non-exposed • R R = 10/1 = 10 • Smokers are 10 times at greater risk of developing lung cancer.

Attributable Risk • Attributable risk = • Incidence of disease among exposed minus Incidence of disease among non-exposed • Incidence rate among exposed • 10 -1/10 x 100 = 90 % • Smoking is attributed to 90% of the lung cancer

• • • Population Attributable Risk Lung Cancer deaths among smokers & Nonsmokers Deaths per 100, 000 persons years Heavy Smokers 224 Exposed to suspected factor (a) Non Smokers 10 Non exposed to suspected causal factor ( b ) Deaths in total Population 74 ( c ) Individual RR a/b= 22. 40 Population AR ( c-b )/c = 86%

Importance of PAR • Estimates the amount by which the disease could be reduced in that population if the suspected factor was eliminated or modified

Quasi Experimental Study • Non Experimental Study • Pre-test Post-Test Study

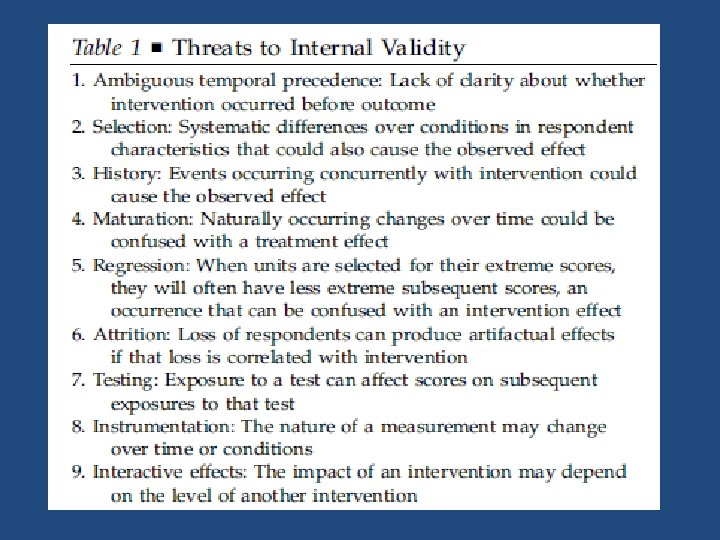
Internal Validity • Degree to which observed changes in outcomes can be correctly inferred to be caused by an exposure or an intervention Threats to Validity 1. Confounding Factor 2. Regression to the Mean 3. Lack of randomization

Confounding Factor

Limitations of RCT 1. 2. 3. 4. Ethical issues Difficulty in randomization of subjects Difficulty in randomization by locations Small available Sample size

Quasi Experimental Study 1. Quasi-experimental research designs, like experimental designs, test causal hypotheses. 2. A quasi-experimental design by definition lacks random assignment. 3. Quasi-experimental designs identify a comparison group that is as similar as possible to the treatment group in terms of baseline (pre-intervention) characteristics. 4. There are different techniques for creating a valid comparison group such as regression discontinuity design (RDD) and propensity score matching (PSM).
 • Propensity")
Techniques for creating a valid comparison group • Regression discontinuity design (RDD) • Propensity score matching (PSM).
. • Propensity score – that is, the likelihood that the")
Propensity score matching (PSM). • Propensity score – that is, the likelihood that the individual will participate in the intervention (predicted likelihood of participation). • PSM ensures that the average characteristics of the treatment and comparison groups are similar
 • This approach can be used when there is some")
Regression discontinuity design (RDD) • This approach can be used when there is some kind of criterion that must be met before people can participate in the intervention being evaluated. • This is known as a threshold. A threshold rule determines eligibility for participation in the programme/policy and is usually based on a continuous variable assessed for all potentially eligible individuals. • For example, women above or below a certain age are eligible for participation in a health programme (e. g. , women over 50 years old are eligible for free breast cancer screening).
 Quasi Experimental design without control groups. •")
Types of Quasi Experimental Study • A) Quasi Experimental design without control groups. • B) Quasi Experimental design that use control groups but no Pre-test. • C) Quasi Experimental design that use control groups and Pre-test. • D) Interrupted time series designs.

Quasi Experimental design without control groups. O= Outcome variable & X= Intervention Under study

A nonequivalent dependent variable • A nonequivalent dependent variable is a “. . . dependent variable that is predicted not to change because of the treatment but is expected to respond to some or all of the contextually important internal validity threats in the same way as the target outcome” (Shadish et al. , 2002, p. 509).

Quasi Experimental design that use control groups but no Pre-test.

Quasi Experimental design that use control groups and Pre-test.

Interrupted time series designs

Thank You
- Slides: 33